GMDC , 1WPattern is Looking very Great and is Ready to Breakout ,
if it broke the upper trendline with Good Volume then we can consider it is the best breakout
Follow for more Swing Ideas Like this
Priceaction

GU-Mon-12/05/25 TDA-Bulls and bears fighting strong!Analysis done directly on the chart
Ahead of GBP claimant count change and
US CPI I'll be cautious and lower my risks or
preserve the capital for more clarity after
the news events.
Not financial advice, DYOR.
Market Flow Strategy
Mister Y

GU-Wed-14/05/25 TDA-US CPI softens slightly, GU is rallying up!Analysis done directly on the chart
Follow for more, possible live trade updates!
Post trade analysis opened on Mon:
-Mistake: setting too wide tp ahead of US CPI
-Lesson learned: 3 types of tp set
1) Strong fundamental back up, wide tp (relying to push through levels)
2) Medium fundamental back up, tp to next major resistances (1h+)
3) No fundamental back up, tight tp and no holding
Always doing post trade analysis is really good and super
useful. By understanding if it was a technical problem, emotional
problem, fundamentally not understanding problem etc.
I advise you to do the same for each trade!
Comment down below what do you think!
Not financial advice, DYOR.
Market Flow Strategy
Mister Y

XAUUSD 4H | Strong Support in Play — Breakout or Bounce?🪙 Gold (XAUUSD) 4H Analysis — May 14, 2025
Gold is tapping into a critical support zone, where multiple SMC elements are aligning for either a massive bullish reversal or a stop-hunt breakdown. Let’s break it down:
🔻 1. Context & Price Action
Price has been in a down-channel, respecting structure and forming LHs (lower highs).
We're now tapping into a historically respected demand zone, clearly marked on the chart.
A large compression move into this level increases the probability of a volatile reaction.
🧱 2. Key Zones
✅ Support Zone: ~3,193 to 3,229 — highlighted in pink
💧 Sell Side Liquidity: rests just below support
🔼 Strong High: visible around 3,450 (target if bulls step in)
This is a textbook “liquidity trap or launch” zone.
📈 3. Possible Scenarios
🔵 Bullish Scenario:
If we see a fakeout and recovery from the yellow highlighted area:
Expect a sharp reversal, targeting the mid-channel and eventually the Strong High at 3,450+.
Smart Money may defend this level to grab external liquidity later.
🔴 Bearish Scenario:
If price closes strongly below support and holds beneath:
Sell-side liquidity sweep triggers, targeting deeper zones like 3,100 or even 3,025.
Trendline break + structure shift = full bearish continuation.
🎯 What to Watch For:
Rejection candlestick patterns near the yellow circle
Volume spikes on the bounce
Clean break + retest if bearish
This is a must-watch area for day traders and swing traders alike.
Stay reactive, not predictive!
🔁 Drop a 🔔 if you want to see how this plays out.
🧠 Follow @ChartNinjas88 for Smart Money insights on Gold and more!

GBP/USD Bulls Are Back? Institutions Are Loading Up1. Price Action & Zone Mapping
GBP/USD is consolidating above 1.3300 after a strong bullish reaction near the demand zone between 1.3040 and 1.3150 — an area that has already rejected price twice in recent months.
While the market structure still shows lower highs, the weekly candlestick formation signals a clear loss of bearish momentum. On the upside, the 1.3500–1.3600 zone remains the key supply area to break for a structural reversal to be confirmed.
2. COT Report – Institutional Positioning (as of May 6, 2025)
Non-Commercials (speculators) added +3,320 long positions and reduced -1,956 shorts, bringing the net long to +7,683 contracts — a strong bullish signal.
Commercials remain net short, but not with increasing aggression.
👉 The net positioning supports continued bullish bias, aligned with the recent technical rebound.
3. USD Index – Opposite Positioning
Non-Commercials increased both longs and shorts slightly on the US Dollar Index, but net positioning remains neutral with a slight bearish tilt.
This suggests a phase of indecision or mild retracement in the dollar, which indirectly supports GBP/USD upside.
4. GBP/USD Seasonality – Historical Behavior in May
According to MarketBulls data, May tends to be neutral-to-weak for the pair:
15-year avg: +0.0023
5-year avg: -0.016
2-year avg: +0.0069
Overall, this supports a ranging or corrective phase — not a high-conviction trending month. A breakout may need more confirmation.
5. Retail Sentiment
Currently, 60% of retail traders are short GBP/USD, with an average price of 1.2959, while only 40% are long from 1.3337.
👉 This imbalance favors a contrarian bullish narrative, especially if the market decides to run stops below 1.3300.
✅ Operational Outlook
GBP/USD is showing bullish consolidation signs, backed by:
Increasing institutional long interest
Contrarian retail sentiment (potential fuel for rallies)
Solid demand near 1.3040–1.3150
However, neutral seasonality and lack of structural breakout advise caution. A pullback towards 1.3200–1.3150 might come before any further upside move toward 1.3500.
🔍 Preferred Play: Wait for a retest of 1.3150 with price action confirmation before entering long. A strong breakout above 1.3350 would be early confirmation of renewed bullish pressure.

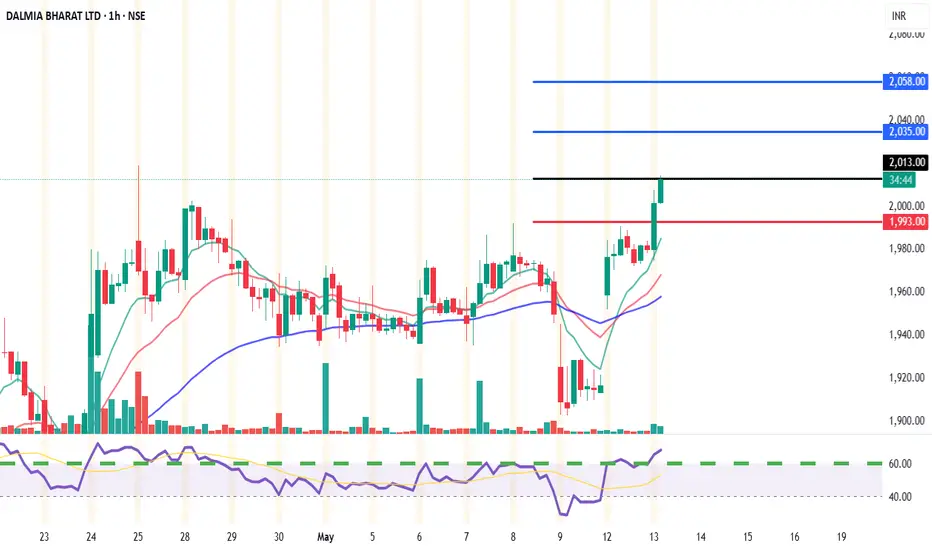
Trade Setup: DALMIA BHARAT (NSE)📊 Chart Summary:
Current Price: ₹2,009
EMA Support: 9 EMA (₹2,003.57) | 26 EMA (₹1,993.31)
Volume: Increasing with bullish candles
Price Action: Sustaining above key pivot and EMA levels
Momentum: Strong with minor consolidation
✅ Intraday Buy Setup (15min & 1h)
Buy Above: ₹2,013.50 (Break of intraday resistance zone)
Targets:
🎯 Target 1: ₹2,035.80 (Pivot R2)
🎯 Target 2: ₹2,058.30 (Pivot R3)
Stop Loss: ₹1,993 (below 26 EMA and pivot zone)
Risk:Reward: ~1:2 or better
For Education Purposes Only
No Clear Break Yet – Bounce or Bigger Correction?There haven’t been any major changes in Bitcoin’s directional structure compared to yesterday.
We saw a rebound while successfully holding the local low set during yesterday’s early morning session, and price action has followed the expected path quite well—reaching into the resistance zone and reacting accordingly.
The recent rebound from the $100,700 low may offer enough of a recovery move, but for a sustained continuation to the upside, we now need to see price hold the first support zone between $103,000 and $102,000, and ideally also preserve the second support around $101,500.
However, even if these support zones hold, failure to break previous highs could still result in another downward leg—potentially leading to a break back below $100K. This is an important scenario to keep in mind.
In short, we still need to determine whether this bounce is:
The completion of a correction wave and the start of a new uptrend
or
Just a temporary rebound before a deeper correction unfolds on the higher timeframe.
Even if we see meaningful bullish movement on the lower timeframes, it must also be confirmed across higher timeframes to be reliable. This is not a zone to hold blindly with blind optimism—whether long or short, if you’re in profit after a solid wave, consider partial profit-taking and manage your position proactively.
At the moment, the market remains in a range-bound structure, with neither the highs nor the lows broken decisively. I recommend using today’s update in conjunction with yesterday’s analysis—it will help you better understand the current structure, improve your positioning, and support your trading decisions.

Gabriel India Ltd (GABRIEL) – Weekly Resistance Breakout Setup✅ Trade Idea:
Price has reclaimed the 0.618 retracement at ₹608.25
Breakout above the ₹612 horizontal level (weekly closing basis)
Volume is rising and RSI shows strong uptrend
💰 Buy Zone:
Entry: ₹610 – ₹613
(preferably above ₹612 on strong 15min or 1H candle close)
🎯 Targets:
T1: ₹630 (previous minor supply zone)
T2: ₹646.65 (Fib 0.786 level)
T3: ₹695.55 (Fib 1.0 extension)
T4: ₹836.85 (1.618 extension for swing positional)
🛑 Stop Loss:
Intraday SL: ₹598 (below 9 EMA on 1H)
Swing SL: ₹581 (Fib 0.5 retracement support)
🔁 Strategy:
Wait for confirmation via volume + RSI > 60
Trail SL to ₹610 once ₹630 is hit
Lock partial profit near ₹646 if market sentiment weakens
For Education Purposes Only

2025-05-13 - priceactiontds - daily update - nasdaqGood Evening and I hope you are well.
comment: Can’t get more bullish than this but I am not willing to buy the exact high but rather would wait for a pullback. The only thing that we turn me neutral right now, would be a > -2% down day and close below 20800.
current market cycle: trading range
key levels: 19700 - 20600
bull case: My lowest measured move target is 22350. Market should stay above 20000 if bulls want to get there and that’s likely all that’s important about the nasdaq for now. Clear breakout and follow-through. Bears gave up and we are again at peak euphoria.
Invalidation is below 20000.
bear case: Bears need a miracle below 20000. That’s it. Could this become a bull trap and an exhaustion gap? Always possible but I think it’s so unlikely that you can not make money betting on those odds. Path of least resistance is up, Opex or not. What I do think is that we could be close to the top of the channel we are in and we go sideways for the next days. I drew potential upper bull channel line but confirmation would only be if we don’t print anything above 21350 tomorrow.
Invalidation is above 20400.
short term: Neutral. Bulls grinding but for how many more tries? If that is bad English, you can suck my Bratwurst.
medium-long term - Update from 2024-04-20: My most bearish target for 2025 was 17500ish, given in my year-end special. We are +18% from the lows and I do think, once this turns again, it will easily be the short trade of the year.
trade of the day: Shorting new highs continues to print money.

GBP/JPY Breaks Above 196.00! Continuation or Distribution?Detailed Techno-Macro Analysis – GBP/JPY
GBP/JPY has just completed a significant weekly structure breakout, pushing through a key supply zone between 195.00 and 196.30 — an area that historically acted as strong resistance. The breakout occurred via a high-volatility daily candle that closed above the zone, indicating strong bullish pressure.
🔍 Structure & Price Action
Price action shows higher lows and higher highs: a clearly defined bullish structure.
The breakout originated from an accumulation base, following a false bearish breakout below 188.50 (bull trap).
RSI is around 70 on the daily timeframe → strong momentum, but signs of potential exhaustion.
🧠 Key Zones Identified
Current weekly supply: 195.00 – 196.80 (being tested)
Next resistance: 198.70 – 199.50 (swing high and monthly level)
Immediate support: 194.00 – 192.80 (ideal area for pullback and long setups)
Structural support: 190.50 – 188.80
Invalidation: Daily close below 191.00 → potential reversal signal
📈 Macro & Fundamental Context
🇬🇧 UK Macro Update
Wages rising: +5.5% (above expectations) → could support further monetary tightening
Claimant count increasing → early weakness in the labor market
Mixed data, but wage growth bias favors GBP strength
🇯🇵 JPY Still Weak
BoJ remains ultra-accommodative
Verbal interventions from Japanese officials haven’t yet had structural impact
🪙 Retail Sentiment
70% of retail traders are short GBP/JPY, with an average price of 190.59
Only 30% are long, with an average price of 194.65
➡️ Current price (196.30) is above both → retail squeeze in play. Contrarian setup confirmed.
🧾 COT Report
GBP (Non-Commercial Speculators):
Long: +3,320 contracts
Short: -1,956 contracts
➡️ Net long positions increasing → favorable institutional exposure
JPY:
Mixed positions, with increases in both long and short → institutional neutrality on the yen
📅 Seasonality – GBP/JPY
May is historically bearish on both 5Y and 20Y timeframes:
5Y: -2.52%
20Y: -0.43%
Only the 2Y pattern shows a positive return
➡️ Negative seasonality vs. bullish technical structure → conflict worth watching
🔍 Execution Summary
The bullish breakout is strong and supported by sentiment and institutional positioning, but price is now entering a potential distribution zone, where profit-taking could increase.
👉 Main scenario: technical pullback toward 194.00–192.80 for possible long entries, targeting 198.50–199.50
👉 Alternative scenario: daily close below 191.00 → bias reversal and bearish continuation

EURJPY Sell - May 13, 2025📍Context:
Reaction from Daily Orderblock
Clear 15m BOS
Two Asia lows & a gap in our direction
Entry at 15m OB with 0.5% risk
If price gives a 1m BOS within the OB, I’ll add another 0.5% to go full risk.
Even though there’s a 5m OB above, I’m comfortable taking the trade if we show signs of rejection.
🎯 TP: Targeting Asia lows and continuation down with clean structure.

Gold Bulls Are Loading — Don’t Miss the Fair Value Launch Zone🔍 XAUUSD 30M | Smart Money Breakdown
Gold just gave a liquidation + FVG bounce setup with a high-probability bullish reaction.
Let’s break it down like a sniper 🧠👇
🔻 1. Falling Channel Structure
Gold’s been grinding down in a neat descending channel, consistently taking out liquidity beneath swing lows.
This compression usually ends in aggressive expansion — and Smart Money knows it.
🔁 2. FVG Reclaim = Institutional Entry Zone
The chart shows a Fair Value Gap (FVG) perfectly respected around $3,226 – $3,236.
Price dipped into this imbalance and is now reacting — textbook Smart Money entry.
You're seeing clear demand stepping in after a sell-side liquidity sweep.
📈 3. Target = Upper Channel + Imbalance Fill
If momentum holds, Gold likely reaches for the upper channel resistance and fills the imbalance zone up to ~$3,280+.
That’s your primary draw on liquidity.
🎯 4. Trade Plan (RR ~3:1)
📍 Entry: Around FVG zone ($3,226–$3,236)
❌ Stop-Loss: Below the FVG zone
✅ TP: $3,280 (upper channel tap)
Smart Money is entering early while retail waits for confirmation breakouts 👀
🧩 Key Confluences:
✅ Falling Channel
✅ Fair Value Gap Tap
✅ Bullish Engulfing Response
✅ Clean RRR Setup
✅ Liquidity Sweep Prior to Entry
📊 Summary:
This setup screams Smart Money Accumulation. Gold hunts the lows, reclaims the imbalance, and is now gearing up for a bullish run. The reaction off the FVG is your golden ticket.
Let price work — don’t chase, just manage risk like a pro.
💬 Comment “💰 XAU Sniper Setup” if you caught this one early!
⚔️ Follow @ChartNinjas88 for elite Smart Money plays.
👀 Tag a trader still shorting this range 😅

BTCUSD ChoCh + FVG Rejection = Drop Incoming🧠 Smart Money Concepts | BTCUSD 1H Breakdown
Here’s a crystal-clear Smart Money setup on Bitcoin that screams bearish intent. The wedge was a trap, the ChoCh confirmed the flip, and now price is reaching back into a Fair Value Gap that’s likely to reject hard.
Let’s dissect the setup:
🧱 1. Structure: Rising Wedge + ChoCh
Bitcoin climbed with a grinding structure inside a rising wedge — classic liquidity trap.
Smart Money lured in longs, then snapped structure (ChoCh) at ~102,700 — that’s your reversal confirmation.
📉 2. Fair Value Gap (FVG) Rejection Zone
After the ChoCh, price retraced into a juicy FVG zone around 103,219 – 103,913 —
right below a Strong High at 105,900. Inducement bait for breakout traders.
That’s premium pricing in a bearish environment = high-probability short.
🎯 3. Liquidity Target: Weak Low + Sell Side Sweep
Price is eyeing the Weak Low at 99,114, and below that sits the real magnet:
Sell Side Liquidity at ~98,800. That’s your ultimate draw.
📐 4. Trade Idea (R:R Approx. 3.5:1)
📍 Entry Zone: 103,200–103,900 (FVG zone)
❌ SL: Above Strong High @ 106,000
✅ TP1: Weak Low at 99,114
🏁 TP2: Sell Side Liquidity @ ~98,800
🧩 Confluences Checklist:
✅ Rising Wedge Trap
✅ ChoCh Confirmed
✅ FVG in Premium Zone
✅ Bearish Order Flow
✅ Weak Low + Sell Side as Target
⚠️ Caution:
Don’t short blindly. Wait for reaction in the FVG zone — ideally a rejection wick or lower timeframe BOS.
If price closes above the Strong High — setup is invalidated.
📊 Summary:
This BTCUSD setup is dripping with manipulation. Smart Money engineered a wedge, flipped structure, and is now likely to distribute before the next leg down.
Stay sharp. Trade with the big players, not against them.
💬 Type “🚨 BTC Short Alert” in the comments if you caught this setup too.
📉 Follow @ChartNinjas88 for more SMC alpha and sniper setups.
👀 Tag a fellow trader who thinks wedges always break upward 😂

GJ-Tue-13/05/25 TDA-Eyes on US CPI, weekend gap unfilled yet!Analysis done directly on the chart
Follow for more, possible live trade updates!
Stay up to date if you are daytrader (even if you aren't)
with Financial Juice, real live updates on flash news
speeches and a lot of more!
Not financial advice, DYOR.
Market Flow Strategy
Mister Y

GU-Tue-13/05/25 TDA-Flash news, bearish continuation before CPI!Analysis done directly on the chart
Sharing live trade updates!
Flash news yesterday to cause the price to continue
the bearish momentum breaking through strong
supports.
SOURCE: Financial Juice
If you are a daytrader (even if aren't) you should be
aware of flash news that can happen at any time and
cause price to move suddenly.
Not financial advice, DYOR.
Market Flow Strategy
Mister Y

Caught the Short? CPI Ahead, and This Pullback Isn’t Over YetIf you’ve been following the recent updates, I believe you were well-prepared for this move.
For the past few days, I repeatedly emphasized that we may not break through the supply zone in one go—and now, those who entered short positions likely enjoyed some solid profits.
Currently, we’re seeing a strong rebound from the second support zone.
This is the first real, sharp correction we’ve seen since the strong bullish trend began from the 74K–83K region, and that alone should remind us to proceed with caution going forward.
To maintain the broader uptrend, the market needs to do one of two things:
Either preserve the local low formed during the latest drop and climb from there (ideal scenario),
Or, if it dips lower once more, form a sideways base before recovering again.
This structure would confirm that the trend remains healthy and intact.
Right now, we must assess whether this bounce leads to continuation or if it’s just a relief rally before a deeper wave down.
If we break the structure and revisit previous demand zones, we want to see price hold and reverse from those levels—that’s the key confirmation.
The previous slow grind-up ("step-by-step climb") has now been disrupted.
This shift increases the likelihood of a deeper retracement before any new highs, especially with today's CPI data potentially triggering strong volatility and head-fake moves in both directions.
If price fails to push higher from here, we may see a breakdown below the psychological 100K level.
We’re still observing a bearish structure on the lower timeframes, as the price fails to make higher highs—so please, avoid jumping into positions impulsively.
This is the correction we’ve been waiting for, and those who followed the updates likely navigated it well.
However, be aware:
When a market climbs on strong green candles, the subsequent drop can be equally harsh, especially if profit-taking meets negative macro headlines.
So, wait for confirmation—whether it’s a bounce that protects support or a break that reclaims structure. Entering after such confirmation will always get you better entries than acting out of fear.
As I’ve said many times:
You don’t need to FOMO into every pump.
Opportunities always come again. And history shows us—trading out of impatience or greed rarely ends well.
Stay focused, stay patient, and I hope your next trade brings another solid win.

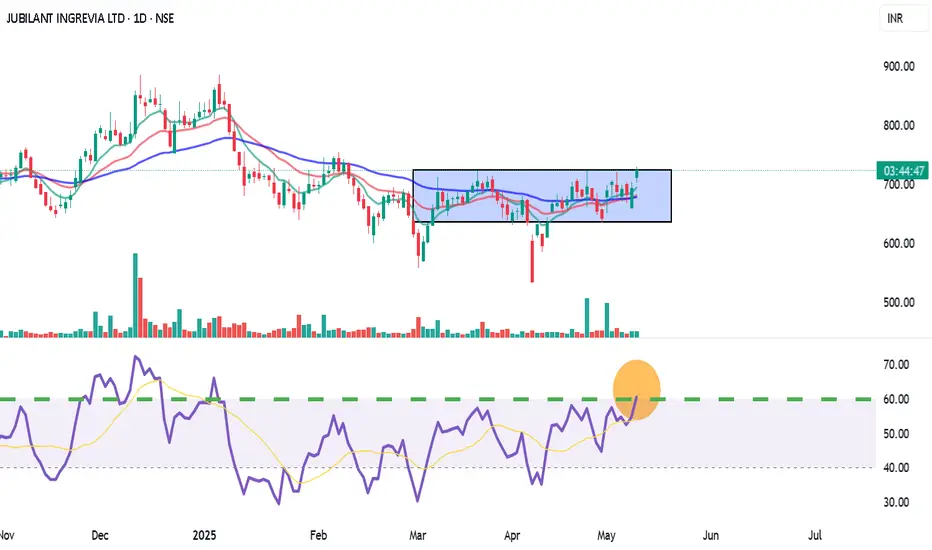
Jubilant Ingrevia (JUBLINGREA) – Short-Term Breakout Trade LTP: ₹726.30 | Recommended Entry: ₹722.00 – ₹723.00
Type: Short-Term Swing / Intraday MTF Trade
✅ Trade Setup:
Breakout above horizontal resistance near ₹725.75
9 EMA has crossed 26 EMA (bullish momentum)
RSI at 60.84 – strong trend, room for upside
BB %B: 0.96 – price pushing upper band = momentum buying
Good volume breakout on daily TF confirms buying interest
🟢 Buy Zone: ₹722 – ₹723
🔁 On retest or 15-min candle close above ₹725.75 with volume
🎯 Targets:
T1: ₹738
T2: ₹750 (supply zone / fib level)
T3: ₹765+ (if breakout sustains in 1H)
🛑 Stop Loss:
Conservative SL: ₹707 (below support + 9EMA)
Aggressive SL: ₹712 (tight SL for intraday)
For Education Purposes Only
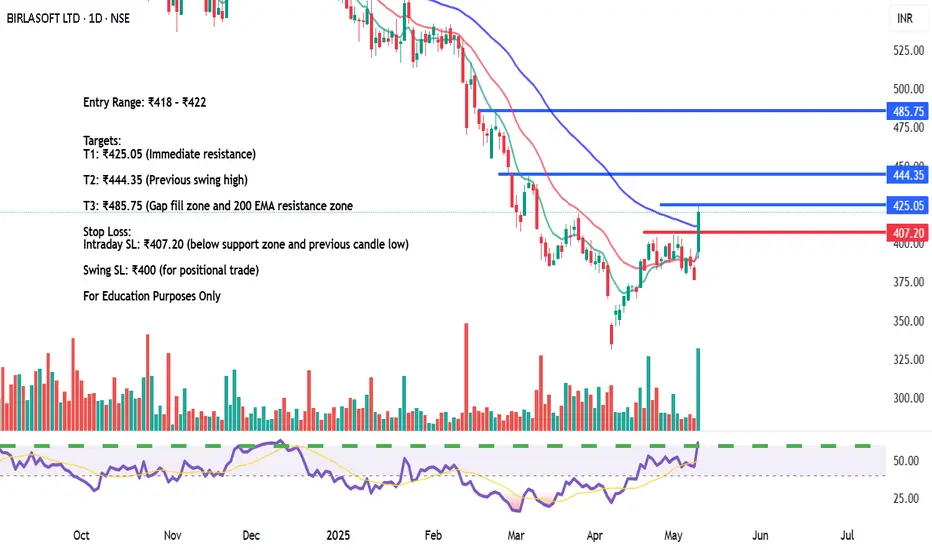
BIRLASOFT LTD – Bullish Reversal with Volume Surge✅ Trade Plan:
Stock gave a bullish breakout with a large green candle & volume spike
RSI crossed 60 level – bullish strength confirmed
Price broke above short-term resistance zone at ₹407 and nearing ₹425
💰 Buy Zone:
Entry Range: ₹418 – ₹422 (on 15min or 1H candle close above ₹420)
🎯 Targets:
T1: ₹425.05 (Immediate resistance)
T2: ₹444.35 (Previous swing high)
T3: ₹485.75 (Gap fill zone and 200 EMA resistance zone)
🛑 Stop Loss:
Intraday SL: ₹407.20 (below support zone and previous candle low)
Swing SL: ₹400 (for positional trade)
🔁 Strategy:
Scalp at ₹425 with 30–40% booking
Hold rest for breakout continuation toward ₹444+
Trail SL to ₹415 once above ₹425
For Education Purposes Only
2025-05-12 - priceactiontds - daily update - dax
Good Evening and I hope you are well.
comment: If you are a bull and longed anything last week and market hit your 24000 target today, you either took profits at the top and were happy about it or you watched them burn. Now what should we expect when the market hits 24000 the next time? Will bulls willingly hold through another pullback, knowing that it could be 500+ points deep again? I highly doubt that. Usually markets reach their targets and spend more time there or overshoot some to run more stops. Today we did not see any of that, which makes me think this could very well be the exhaustive end of the move → exhaustion gap.
current market cycle: broad bull channel or trading range - doesn’t matter since you trade them the same
key levels: 22000 - 24100
bull case: Bulls need to find acceptance above 23700 and go sideways here. Another strong move below 23500 would mean the bull trend line is broken for good and market could test lower in search of bigger support. I don’t have any targets above 24000 for the bulls and since the pullback was that deep, I am having a hard time believing we could do anything much higher than 24100. With today’s price action, I expect bulls to retest 24000 and maybe some, just to run stops but I do think most bulls will take profits there and bears will short it aggressively again, since it was so profitable today.
Invalidation is below 23300.
bear case: Bears did good in closing the gap down to 23588, making this an exhaustion gap. They will likely short again above 23800 since it has been profitable all day. Only a very strong move above 24100+ would force more bears to cover and we could accelerate up. Therefor sideways 23000 - 24000 is my expect price action for this week. Could bears push it down further because we have Opex? No idea and you should never try to ask why markets are doing something because you will never know the answer. Below 23400 I expect 23000 to come fast.
Invalidation is above 24100.
short term: Neutral. 23000 - 24000 is the range I see for the next days or even weeks, until we get better selling pressure. Trade the bull channel until it’s clearly broken.
medium-long term from 2025-05-11: So here is my very rough guess about the next months. This short squeeze is clearly overdone and global macro stuff has most likely already deteriorated a great deal. Down to 20000 over the next weeks and form a big trading range. Up through October-Year end. Zero thought about a new bull trend above 24000 or that we have seen the lows for either 2025 or 2026. Good question is always, “How would you allocate 100k right now?”. 50% short dax, 25% of it levered/options and with the rest I would scalp.
trade of the day: Long Globex open was the obvious trade but shorting 24000 was the even better one. I did not think the short was obvious and I took too long to realize it’s strength and then my risk was bigger than I was comfortable with, so I let it go down without me. I caught another long afterwards for 120+ points.

"USDJPY Just Printed a Trap — Smart Money Is In. Are You?"🧠 Smart Money Concepts (SMC) Setup Alert: USDJPY | 15-Min Timeframe
We’re spotting a high-probability bullish continuation setup on USDJPY backed by Smart Money logic. Let’s unpack what’s happening:
🧭 1. Liquidity Grab at the Low
Notice how price created a false breakdown below prior structure — a classic liquidity hunt. Late sellers got trapped before price snapped back aggressively, triggering a Bullish Break of Structure (BOS).
Smart Money needed to grab liquidity before running price higher. Textbook manipulation.
🟩 2. Refined Entry Zone: Discount + Bullish Order Flow
Price has now retraced back to a discount zone, entering the premium-to-discount pullback area. Buyers are expected to defend this level, creating the potential for a bullish continuation.
This entry is cleanly defined by a buy-side imbalance (light green area) which overlaps with a bullish order block and internal trendline support.
📐 3. Risk-to-Reward (R:R) Setup
We’ve got an excellent R:R opportunity here:
🎯 Entry: Near 145.910
❌ Stop Loss: Just above 146.314 (invalidate bullish bias)
✅ Take Profit Zone: 145.367 (with continuation possible beyond)
This gives us roughly a 2.3R setup, highly favorable for swing entries.
🎯 4. Confluence
Trendline support holding
Bullish BOS confirmed
Imbalance filled
Liquidity grabbed
Order block respected
FVG forming structure for propulsion
Smart Money is likely to push price back toward internal liquidity highs — and possibly sweep them for a final exit.
📊 Strategy:
Wait for bullish engulfing or strong rejection wick from this discount zone to confirm entry.
Trail stop as structure develops on lower timeframes. This setup can also be compounded if price forms another internal BOS.
⚠️ Risk Reminder:
Don’t chase. Let price come to you.
Manage risk at all times.
One setup doesn’t define the day — consistency wins.
🧪 Summary:
USDJPY is giving Smart Money vibes — from the liquidity grab, clean BOS, internal order block, to an excellent R:R setup.
This is the kind of trade where you want to be the hunter, not the prey.
💬 Drop a 🔥 if you caught this move.
📩 Tag a trading buddy who needs to learn SMC.
📊 Stay smart. Trade with purpose.

EURCHF Sell - May 12, 2025Risk : Full 1%
🧠 Reasoning:
Price reacted from Daily EMA, with a strong wick rejection and bearish engulfing.
Entry at 15m imbalance left behind inside a 15m POI.
🎯 TP:
First TP at Asia lows, 1:3 RR → take off 75%
Final TP at second Asia low or gap, close to 6RR
📉 Bias: Bearish | Risk Management: Partial close at 3RR

GBPUSD - Bearish Pressure Soon!Hello TradingView Family / Fellow Traders. This is Richard, also known as theSignalyst.
📈As per our last GBPUSD analysis, it rejected the $1.27 - $1.28 support zone and has been trading higher.
This week, GBPUSD is approaching the upper bound of its rising wedge pattern marked in red.
Moreover, the blue zone around $1.34 is a strong resistance and previous weekly high.
🏹 Thus, the highlighted red circle is a strong area to look for sell setups as it is the intersection of the upper red trendline and resistance.
📚 As per my trading style:
As #GBPUSD retests the red circle zone, I will be looking for bearish reversal setups (like a double top pattern, trendline break , and so on...)
📚 Always follow your trading plan regarding entry, risk management, and trade management.
Good luck!
All Strategies Are Good; If Managed Properly!
~Rich
Disclosure: I am part of Trade Nation's Influencer program and receive a monthly fee for using their TradingView charts in my analysis.

AUD/USD On the weekly timeframe, AUD/USD approached a previously tested resistance zone around 0.63926, marked by prior price interactions. On the 1-hour chart, the price broke out above this level, signaling bullish momentum. On the 15-minute chart, a backtest of the breakout level occurred, with the price retesting the 0.63926 zone, now acting as support, before continuing upward.
Trade Plan:
Entry: Entered a buy trade at 0.64072 after the backtest confirmation.
Take Profit (TP): Targeting 0.64352, aligning with the next significant resistance level.
Stop Loss (SL): Placed at 0.63926, just below the breakout level, to protect against a false breakout.
Risk-Reward Ratio (RR): The distance to TP is 280 pips (0.64352 - 0.64072), and the distance to SL is 146 pips (0.64072 - 0.63926), yielding an RR of approximately 1:1.9.
This AUD/USD trade capitalizes on a breakout and backtest strategy, offering a structured setup with a favorable risk-reward ratio for potential upside.
