COFORGE 8100 CE – 29 MAY EXPIntraday to Short-Term Trade Setup (15min/1H)
🟢 Bullish Breakout | Volume Surge Confirmed
🛒 Entry Zone (Buy Above): ₹258–260
🔑 Confirmation on 15min candle close above ₹260 with volume
🎯 Targets:
T1: ₹276
T2: ₹306.50
T3: ₹353.90 (if momentum continues into next session)
🛑 Stop Loss:
SL: ₹230 (on candle close basis for 15min TF)
Conservative SL: ₹240 (if tighter risk appetite)
📊 Indicators Signal:
✅ 9 EMA crossed 26 EMA (momentum confirmation)
✅ RSI at 76.79 – strong, but watch for pullback
✅ BB %B at 0.89 – breakout zone
✅ Clean breakout above resistance (~₹230) with volume spike
✅ Pivot & resistance flip visible on both 15min & 1H TF
For Education Purposes Only
Priceaction

Bitcoin Flips $94K Into Support — Bullish Momentum BuildsStructure Strengthens:
Bitcoin's technical structure has improved significantly, with price now holding firmly above the $94,000 level — a former resistance that has flipped into solid support after multiple successful retests.
Bullish Trend Confirmation:
This move reinforces the ongoing bullish trend, driven by a broad bottoming formation from February to April and a clear series of higher lows since March.
Investor Confidence:
The consistent accumulation signals strong buying interest from long-term investors, suggesting that market participants are positioning for further upside.
Outlook & Targets:
As long as Bitcoin maintains levels above $94,000, the bullish outlook remains intact. The next near-term targets lie in the $110,000–$115,000 range.
Bitcoin appears well-positioned for the next leg of its rally. 🚀📈
#Bitcoin #BTC #Crypto #TechnicalAnalysis #BullishTrend #Support #Breakout #MarketUpdate #PriceAction #CryptoMarket

GJ-Mon-12/05/25 TDA-Strong bull continuation from Friday!Analysis done directly on the chart
New week, new opportunity to learn,
to improve. To get better and better!
Not financial advice, DYOR.
Market Flow Strategy
Mister Y

Golden Rejection Candle Strategy–Catch Explosive Intraday Moves!Hello Trader!
Are you tired of buying options and watching premiums die slowly?
Or chasing breakouts that reverse the moment you enter?
Here’s your solution – the Golden Rejection Candle Strategy , designed especially for option buyers who want timed entries, fast momentum, and defined risk .
What is a Golden Rejection Candle?
A special candlestick that forms when price hits a strong level (like VWAP, trendline, or demand/supply zone) and gets instantly rejected.
It leaves behind a long wick (shadow), showing that buyers or sellers stepped in with force .
This candle often marks the start of a sharp intraday reversal .
It's not just a random wick — it’s a smart money footprint .
Live Chart Example – Nifty Spot vs Option Premium (23950 CE)
Date: 9th May 2025
Timeframe: 1 min (Spot), 1 min (Options)
Spot Chart Setup: Nifty approached a marked green support zone and created a strong wick rejection with a small body candle — classic sign of buyers defending the level.
Confirmation Candle: The next candle broke above the rejection candle’s high, confirming the reversal setup.
Premium Reaction: On the 1-min ATM Option chart (23950 CE), premiums jumped from 270 to 344 – a clean 26% gain within few minutes.
Risk-Reward Snapshot: Entry was at breakout, SL just below rejection wick, and target hit in a single momentum burst — the kind of move option buyers live for.
How to Trade It as an Option Buyer
Choose the Right Strike: Use ATM or slightly ITM options to get faster movement when price reverses.
Entry Strategy: Wait for the next candle to break the rejection candle’s high/low. No break = No trade.
SL Placement: Keep it just beyond the wick. Small loss if wrong, big reward if right.
Exit Plan: Aim for intraday resistance/support or spike-based exits — option premiums often give quick moves post-rejection.
What NOT to Do:
Don’t enter on the rejection candle itself — wait for confirmation.
Avoid trading this pattern in low volume or middle of the range.
Don’t hold blindly — if premium spikes, take the money and run!
Rahul’s Tip:
“Sudden reversals are where option buyers make money — not slow trends. The rejection candle shows intent. The breakout shows confirmation. Combine both.”
Conclusion:
The Golden Rejection Candle Strategy gives you an edge that most random trades lack — timing, context, and structure.
If you're an option buyer, this can be your go-to setup to avoid traps and enter only when smart money steps in.
No more guessing. No more fear.
Just clean, price-action-based entries that make sense.
👇 Have you ever used rejection-based setups? Drop your favorite trade below! Let’s learn together.
If you found this post valuable, don't forget to LIKE and FOLLOW!
I regularly share real-world trading setups, actionable strategies, and learning-focused content — all from real trading experience , not theory . Stay connected if you're serious about growing as a trader!

#202519 - priceactiontds - weekly update - bitcoinGood Day and I hope you are well.
#btcusd - bitcoin
comment: Can’t be anything but bullish. Weekly chart is clear as day and we are in the third leg up.
current market cycle: bull trend inside a big bull wedge and we are close to the top
key levels: 85k - 100k (if bears somehow manage to get below 85k again, we test 80k next)
bull case: Upside will likely be limited to something below 120000 but bulls are in full control until we print below a higher low again. Bulls want 110000 and then some. It’s a clear bull wedge and longs above 100000 are tough because stop has to be at least 97000. It looks like we could accelerate up and get to 110000 faster but betting on it is a bad strategy. Any decent pullback to 100000 or 98000 will most likely be bought.
Invalidation is below 96000.
bear case: Bears can scalp this at best but tough way to make a living. They are not doing much because most will wait for a new ath or at least let the market get closer to 109000 and see better selling pressure. We are at the top of a potential channel up but until bears print something below 102000 again, it would be gambling to hope for a better pullback to sell.
Invalidation is above 112000.
short term: Bullish but buying at the very top is tough. Any long 100000 or 98000 is likely good, if it’s not during a crazy strong bear spike.
medium-long term - Update from 2025-05-11: I expect a trading range 700000 - 100000 for longer. The current move above 100000 I see as a retest of the ath and it could overshoot but I doubt market can find acceptance there for longer. Only interested in shorts on anything above the 1h time frame.

#202519 - priceactiontds - weekly update - wti crude oilGood Day and I hope you are well.
comment: Market closed near the high of the week and we made a textbook double bottom below 56. Sometimes it’s not more complicated than that to take a trade.
current market cycle: trading range on monthly tf and bear trend on the daily
key levels: 58 - 64
bull case: 63 is my first bull target, followed by 64 and above 64.38 we likely test up to the bear trend line around 67. Best for bulls would be to keep the gap 59.8 - 60.3 open.
Invalidation is below 58.
bear case: If we drop below 58 again, it’s a clear descending triangle and we could do 56 or lower, again. Right now bears don’t have much since last week was bullish and closed at the highs. Best bears could get is a trading range 55 - 65, so they better keep making lower highs or they have to try again around 67 or higher.
Invalidation is above 64.4
short term: Bullish for 63 or higher. No interest in selling down here.
medium-long term - Update from 2025-05-11: 3 legs down on the weekly chart and market has printed a credible bottom around 55. I think we can test back to 65 over the next weeks.

#202519 - priceactiontds - weekly update - nasdaqGood Day and I hope you are well.
comment: Not much changed last week so I do not change much of what I wrote then. Bulls want at least 20536 now and run all the stops from before the big sell-off. Bears are not doing anything at all, so bulls will likely get it. This could be a breakout-retest and I marked the area for that with the red rectangle. Small chance bears come around next week but for now it’s still too early to short. The bull wedge is about to break out over the next 1-2 days and if bulls stay above 19600, we should expect higher prices.
current market cycle: trading range
key levels for next week: 19000 - 21000
bull case: 20536 and then 21000. Those are the next targets and bulls are in full control of the market. The measured move from the buy spike at the lows is around 22350 and it’s possible that we get there. I think we need to see a pullback and how deep that will be. If we get only another sell spike and immediate buying for higher highs, we can also assume much higher prices. Above 21100 there is no reason not to go for 23000. Nothing of this changed to last week. Bulls preventing the bears from getting any decent pullback, which is uber bullish.
Invalidation is below 19100.
bear case: Problem for the bulls is, that we have not closed above the weekly 20ema for two weeks now and bears defending the prior lower high 20536. That was and will be my line in the sand next week. Gap close to it, we have no reason not to print a new ath but below19600 I think more bulls will give up, depending on the strength of the selling. As of now, nothing about the chart is bearish but one decent down day > -2% could change that.
Invalidation is above 20620ish.
short term: Neutral. Market went nowhere and trading on hope and fairy dust is not my thing. I wait.
medium-long term - Update from 2024-05-11: My most bearish target for 2025 was 17500ish. Now I assume we will be in a trading range 16000 - 23000 for much longer. Same update as for dax, I guess we could go down and sideways over the next weeks/months and then have another squeeze into year end. Stairs up, elevator down.

#202519 - priceactiontds - weekly update - dax
Good Day and I hope you are well.
comment: Bull targets are met and we have 4 legs up. 5 even if you count the spikes at the lows. We can do higher but what are the odds? Market is overdue for correction again and given that we easily could do -20% from here, it will be a tough summer. Technically it’s still just bullish but I would not buy up here. Macro-schmackro-wise it’s reasonable to assume that most companies with any US/CN business are worse off than they were before “liberation day”. So my take on this is still a house of cards ready to be blown away by the next small breeze.
current market cycle: trading range
key levels for next week: 22600 - 24000
bull case: 5 Consecutive bull weeks now. If you buy into this at the high, only God may help you. 24000 is the obvious target and it’s a coin flip if bulls can get it. What would make me turn bull? Nothing. Even if bulls print 24400, I would expect it to crash down in less than 2 weeks.
Invalidation is below 22900.
bear case: Two very small pullbacks last week and bulls bought it. Market is refusing to go down and we are still making higher highs. Nothing for the bears here until bulls are clearly exhausted and want out. Market turns more neutral with a daily close below 23000 and I think bearish only below 22600.
Invalidation is above 24100.
short term: Neutral. I wait for clear topping signals and more selling pressure. Long scalps against support if bulls want 24000.
medium-long term from 2025-05-11: So here is my very rough guess about the next months. This short squeeze is clearly overdone and global macro stuff has most likely already deteriorated a great deal. Down to 20000 over the next weeks and form a big trading range. Up through October-Year end. Zero thought about a new bull trend above 24000 or that we have seen the lows for either 2025 or 2026. Good question is always, “How would you allocate 100k right now?”. 50% short dax, 25% of it levered/options and with the rest I would scalp.

QNT - The Bulls are Leading!Hello TradingView Family / Fellow Traders. This is Richard, also known as theSignalyst.
📈After breaking above the last major high marked in red, QNT has been overall bullish trading within the rising wedge pattern marked in blue.
Moreover, the green zone is a strong demand and structure.
🏹 Thus, the highlighted blue circle is a strong area to look for buy setups as it is the intersection of structure and lower blue trendline acting non-horizontal support.
📚 As per my trading style:
As #QNT retests the blue circle zone, I will be looking for bullish reversal setups (like a double bottom pattern, trendline break , and so on...)
📚 Always follow your trading plan regarding entry, risk management, and trade management.
Good luck!
All Strategies Are Good; If Managed Properly!
~Rich

Bitcoin -Weekly Forecast, Technical Analysis & Trading IdeasMidterm forecast:
86499.57 is a major support, while this level is not broken, the Midterm wave will be uptrend.
We will close our open trades, if the Midterm level 86499.57 is broken.
MARKETSCOM:BITCOIN BITSTAMP:BTCUSD
Technical analysis:
A trough is formed in daily chart at 74545.70 on 04/09/2025, so more gains to resistance(s) 105431.17, 109932.90, 115000.00 and more heights is expected.
Take Profits:
86499.57 ✅
91037.20 ✅
94505.46 ✅
98675.19 ✅
101430.12 ✅
105431.17
109932.90
115000.00
120000.00
125000.00
132000.00
140000.00
150000.00
160000.00
167666.00
________________________________________________________________
❤️ If you find this helpful and want more FREE forecasts in TradingView,
. . . . . . . . Hit the 'BOOST' button 👍
. . . . . . . . . . . Drop some feedback in the comments below! (e.g., What did you find most useful? How can we improve?)
🙏 Your support is appreciated!
Now, it's your turn!
Be sure to leave a comment; let us know how you see this opportunity and forecast.
Have a successful week,
ForecastCity Support Team

GBPAUD: 2 Strong Bearish Confirmations 🇬🇧🇦🇺
GBPAUD is in a very bearish price action after a test
of the underlined horizontal resistance.
The price formed an inverted cup and handle pattern
and violated its neckline and a support line of a rising
parallel channel on an hourly time frame.
Probabilities will be high to see a decline at least to 2.064 support.
❤️Please, support my work with like, thank you!❤️

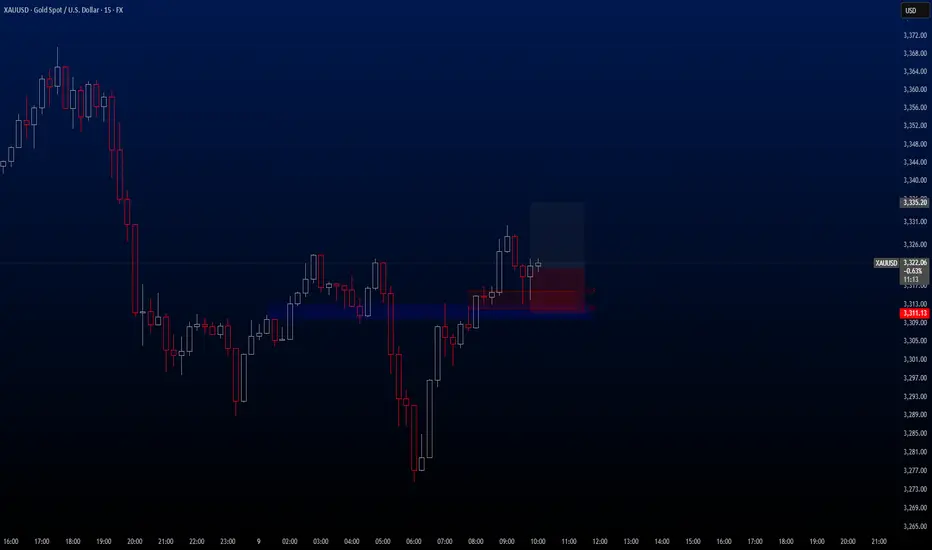
XAUUSDHello traders!
There's a buy opportunity on the XAUUSD pair, and I wanted to share this trade with you. The trade is currently active on my end, and I’ve set the Risk-to-Reward Ratio to 1:1.50.
🔍 Criteria:
✔️ Timeframe: 15M
✔️ Risk-to-Reward Ratio: 1:1.50
✔️ Trade Direction: Buy
✔️ Entry Price: 3320.74
✔️ Take Profit: 3335.20
✔️ Stop Loss: 3311.13
🔔 Disclaimer: This is not financial advice. It's a trade I’m taking based on my own system, shared purely for educational purposes.
📌 If you're also interested in systematic and data-driven trading strategies:
💡 Don’t forget to follow the page and subscribe to stay updated on future analyses.
GJ-Fri-9/05/25 TDA-GJ inside wide range!Analysis done directly on the chart
I'll try my best to update more on my daily
posts.
Not financial advice, DYOR.
Market Flow Strategy
Mister Y

GU-Fri-9/05/25 TDA-Potential bearish continuationAnalysis done directly on the chart
More bearish structure will confirm the
bearish continuation (1h-4h). As of now, we still
reacting good on strong support!
Not financial advice, DYOR.
Market Flow Strategy
Mister Y

09.05.25 Morning ForecastPairs on Watch -
FX:EURCAD
FX:USDCHF
FX:EURUSD
FOREXCOM:COFFEE
Heads up guys!! I will be heading to Greece today so next week my morning forecast videos may not be as consistent, due to internet and just not having my full equipment, so I will do my very best to get some forecasting posted for you all!
A short overview of the instruments I am looking at for today, multi-timeframe analysis down to what I will be looking at for an entry. Enjoy!

“+$25K Profit & Still Long – Don’t Chase, Trade Smart”Since the drop to 74K, we've seen an incredibly fast and powerful rally over the past month—and I’m currently sitting on a realized profit of over $25,000 during this move.
One of the most bullish signals in this entire structure is that since the reversal in April, we’ve never seen a proper correction or trend-reversing retracement. As I mentioned in previous updates, this shows exceptional strength and suggests the uptrend remains firmly intact.
In fact, we’re climbing without breaking any key lows—what I like to call a “step-by-step” grind upward. On higher time frames, these look like strong bullish candles, meaning more buyers than sellers, and aggressive market orders pushing price higher. That’s a characteristic of strong trends—remember that.
Now, with the historical ATH at $109,000 getting closer, I do not expect an immediate breakout to new highs. Instead, we might see a healthy consolidation—either price-wise or time-wise—around this major supply zone. This is not the time to FOMO in.
The recent surge was fueled by comments from President Trump, and that breakout candle was significant. But sharp moves often bring sharp corrections. If price pulls back to the 96–95K zone and finds support, that could be the base for a new push toward all-time highs.
If you’re not in a position right now:
🚫 Do NOT rush into the market.
We are at a spot where both a breakout and a reversal are possible. Whether you’re using the lower or higher time frame, wait for clear confirmation—a pullback, a base, a proper setup.
Look to long only after strong support is confirmed, or short if price keeps failing to break highs. Either way, keep a tight stop and let your winners run—there’s still opportunity here, but only with proper risk-reward.
I’ll say it again because it’s important:
If you missed this long, it’s okay.
The market will correct—whether sharply or slowly—and your edge is not in chasing, but in being ready. Don’t let impulsive trades erase your capital or your confidence.
Oh, and by the way—I’m still holding my long position.

Bitcoin Short Setup | 30m SMC OB Rejection + Clean RR💣 Bitcoin (BTCUSD) 30-Min SMC Short | May 9, 2025
We just caught BTC’s premium tap into a 30m bearish Order Block, followed by a strong rejection candle. This is a classic Smart Money play, where price fills inefficiency and instantly rejects the institutional footprint.
🔍 KEY CONFLUENCES:
📦 Bearish Order Block tapped at $101,752
📈 Strong bullish impulse followed by hard rejection
🎯 Short from premium into discount zone (~$99,114 target)
🔺 Clean Risk-to-Reward: ~1:5+
💰 High-probability Smart Money setup
📊 Setup Specs:
Timeframe: 30min
Direction: Short
Entry Zone: $101,752
TP: $99,114
SL: ~$102,000
RR: Approx. 1:5+
💡 Trade Logic:
Price made a liquidity grab + FVG fill before tapping a 30min Order Block. The sharp red engulfing candle at the top confirms SMC presence and intention to sell-off. This zone represents premium pricing, ideal for institutional distribution.
🎯 Chart Ninja Note:
“Smart Money never chases price… they wait for the retest where the fear begins.”

2025-05-08 - priceactiontds - daily update - nasdaqGood Evening and I hope you are well.
comment: Market closed where it opened, after the early rally from Globex to mid EU session and then another one after the US open bear trap. I could not believe that bulls would do another strong move up after such a rejection above 20250 but meh. Can they really do another tomorrow after yet another strong rejection? Until bears print lower lows, the answer is "probably”. Clear bull wedge and bears need to break below 19970 for more downside. If we stay above 20100 we can do higher highs until we ultimately hit 20536 or higher.
current market cycle: trading range
key levels: 19700 - 20600
bull case: Bulls printed two amazing rallies and they we not enough to make meaningful higher highs and accelerate upwards. Usually that price action would have been enough for more bears to give up but once market began to stall on new highs, bulls vanished and bears overwhelmed them. I don’t have much for the bulls tbh. 5 tries and they are still failing.
Invalidation is below 19100.
bear case: Bears need to break the bull wedge and print below 19970. That’s about it. The rejections from new highs are good but the follow-through is trash. Going below 19600 into the weekend is me next wet dream.
Invalidation is above 20400.
short term: Neutral. Bulls grinding but for how many more tries? If that is bad English, you can do you.
medium-long term - Update from 2024-04-20: My most bearish target for 2025 was 17500ish, given in my year-end special. We are +18% from the lows and I do think, once this turns again, it will easily be the short trade of the year.
trade of the day: Shorting new highs continues to print money.

GBPUSD - Liquidity Grab & BoS Signals Bearish ReversalSmart Money Concepts (SMC) Analysis
1. Liquidity Sweep & Break of Structure (BOS):
Price consolidates above a trendline with multiple rejections (blue lines).
A liquidity grab occurs below this trendline – classic inducement setup.
After the grab, a bearish BOS (break of structure) is confirmed with a strong candle closing below the trendline and recent lows.
2. Order Block:
Price retested a 4H bearish order block (grey shaded zone) before rejection. This OB aligns with the last bullish candle before the drop.
Rejection from the OB confirms institutional interest (SMC).
3. Imbalance / Fair Value Gap (FVG):
The drop left a minor imbalance zone, suggesting possible continuation down to fill the inefficiency.
Price Action Analysis:
1. Trendline Break:
Ascending trendline has been broken with strong bearish momentum.
Indicates a shift from higher lows to lower lows → possible trend reversal.
2. Supply Zone Respect:
The price failed to make a new high and was firmly rejected at resistance.
Double top or lower high formation adds bearish confluence.
3. Target & Risk-Reward:
The trade setup indicates a short entry just below trendline break.
Target around 1.29393, likely based on previous demand zone or liquidity pocket.
Stop above 1.33664, likely above the OB or structural high.
Solid RRR (>3:1) visible.
Confluences Supporting Bearish Bias:
Break of internal structure (Price Action)
Liquidity sweep below trendline (SMC)
Bearish Order Block rejection (SMC)
Strong bearish engulfing candle
Favourable RR trade plan
Conclusion:
This is a high-probability bearish setup combining a trendline liquidity sweep (inducement), break of structure, order block rejection, and efficient risk-reward positioning. The price is expected to target 1.29393, aligning with a previous demand or liquidity zone.
Thanks for your time..

BTCUSD – 1H Long Setup | Discount Entry With RR 1:5+🧩 BTCUSD – 1H Reversal Play | May 5, 2025
We’re deep in Discount Territory, and the market just showed signs of strength with a bullish reaction from the OB. The Risk-to-Reward on this one is chef’s kiss 👨🍳💋
🧠 Smart Money Breakdown:
📉 Market Context: Prolonged bearish leg forming equal lows — liquidity engineered ✅
📍 Entry Point: EQ/OB level @ ~$93,736
🟢 SL: Below OB at ~$92,730
🚀 TP: Previous structure high ~97,912
🧮 RRR: Around 1:5+ (massive potential)
🔎 Narrative & Confluence:
🔄 Price reacting to OB zone after taking liquidity
🧲 Potential inducement below = liquidity swept
⚠️ Engulfing bullish candle = signs of LTF accumulation
📈 Expectation: Push back into premium zone above 97K
🧠 Execution Tips:
Set and forget, or trail aggressively above 94,800
Watch M15-M5 for CHoCH + order flow confirmation
Add to position on micro pullbacks with tight risk
Partial TP around 96,000 zone, full exit at 97,912
📣 Chart Ninja Tip:
“Discount isn't just a price zone — it's where patience meets precision. Let price hunt liquidity, then strike!”
💬 Drop a 💎 if you caught this sniper long.
📊 Save this setup and tag a fellow price action beast.
🔁 Share if your RR game strong today!

GJ-Thu-8/05/25 TDA-GJ in a mini uptrend after structure formed!Analysis done directly on the chart
Nothing is easy, we as humans always
complain about something. It's good,
it's part of our nature. Just have discipline,
and willpower to control yourself.
Not financial advice, DYOR.
Market Flow Strategy
Mister Y

GU-Thu-8/05/25 TDA-Eyes on BoE possible rate cut 0.25%!Analysis done directly on the chart
If BoE cuts rate, more easing policy. Printing
more money, easier access to credit, lower
cost of borrowing.
Not financial advice, DYOR.
Market Flow Strategy
Mister Y

USD/JPY: Ready for a Rally or a False Recovery?USD/JPY is at a crucial stage, with the price hovering around 143.900. After a bearish move, the market is attempting to recover, aiming for the resistance zone between 149.000 and 151.000.
COT Insight:
COT data shows a slight increase in long positions among speculative traders (+397), while commercials are increasing their short coverage (+539), indicating caution.
Seasonality:
Historically, May has been a slightly bullish month for USD/JPY (+0.42% over the last 10 years), but the trend has been negative in the last 5 years (-0.57%), indicating uncertainty.
Retail Sentiment:
65% of retail traders are long, which could indicate potential bearish pressure in case of opposite moves, given the risk of position liquidation.
Conclusion:
Carefully monitor the price reaction around 144.000. A breakout towards 149.000 could signal a significant move, but the long retail pressure might represent an obstacle.
