EUR/USD Breakdown Imminent – Rising Wedge at Major ResistanceOn the 1H chart, EUR/USD has developed a Rising Wedge pattern, a classical bearish reversal formation. The pair has been moving higher within a tightening structure, marked by converging trendlines—indicating weakening bullish momentum.
What makes this pattern more compelling is that it’s occurring just below a well-defined Major Resistance Zone around 1.1380–1.1400, where previous attempts to break higher have failed. This area has historically acted as a strong supply zone, increasing the probability of a reversal.
🔍 Key Technical Components:
Rising Wedge Pattern: The wedge reflects a temporary uptrend with weakening strength. Bullish candles are getting smaller, and volume appears to be fading (not shown here but typically expected in this setup).
Black Mind Curve Support: A custom support curve illustrating the underlying parabolic trend. Once this is broken, it often leads to a steeper selloff.
Change of Character (CHOCH): Around the 1.1260 level, there's a possible shift from bullish to bearish structure. If price breaks and closes below this level, it will likely confirm a momentum reversal.
Target Projection: The measured move and previous structural support suggest a drop toward 1.11479, which coincides with a prior demand zone. This also aligns with a potential liquidity sweep beneath recent lows.
🔔 Price Action Signals to Watch:
Bearish engulfing candles or strong rejections from the wedge’s upper boundary.
Breakdown below the lower wedge line and the curved support.
CHOCH confirmation – market structure shift from bullish to bearish around 1.1260.
Retest of the wedge breakout level, followed by continuation to the downside.
📌 Trading Plan (Not Financial Advice):
Entry: On break and retest of wedge support.
Stop Loss: Above the wedge high or resistance (~1.1400).
Target: 1.11479 for first take-profit level; partials can be taken at 1.1260 if needed.
📉 Bias:
Short-Term Bearish – Only upon wedge breakdown and confirmation.
🧠 Minds Section (Expanded for Traders' Perspective)
EUR/USD is approaching a critical technical juncture. We are seeing a textbook rising wedge formation into a major resistance zone, signaling exhaustion of bullish strength. While the pair has enjoyed upward momentum, price action is showing signs of slowing, and the structure is no longer sustainable.
This pattern often traps late buyers before reversing. We are closely watching the lower wedge boundary and curved support—a breakdown here will likely trigger bearish momentum, especially with the CHOCH area near 1.1260 acting as a structure-defining level.
If sellers gain control and the breakdown confirms, there’s high probability for a fall to 1.11479, targeting prior demand zones and potential liquidity pockets.
Now is the time to be cautious if long, or begin planning short setups. Wait for confirmation—no need to rush the trade.
Priceaction

EURUSD - SHORT PREDICTION - MONDAY, 26TH MAY 2025A pullback appears to be underway, following a sweep of inducement around the 15-minute level at 1.13900—marking our first significant Change of Character (CHoCH). This shift aligns with the broader narrative from the 1-hour timeframe, suggesting the potential for a deeper retracement into the extreme 1H order block.
With the current price trading around 1.13777, we anticipate a move back up to the 1.14078 level. This area is of interest for initiating short positions, in line with the ongoing correction.
Our first take-profit target is set at 1.13368, where we expect an initial reaction. Should bearish momentum continue, we foresee price extending lower to sweep the previous daily low at 1.12771 and potentially tapping into the daily external order block at 1.12664.
From there, we’ll closely monitor price behavior. If bullish intent begins to form, we’ll assess the potential for long setups targeting a move back toward the weekly high at 1.14190.

JPY/USD Rising Wedge Breakdown – Bearish Reversal in Play🔎 Technical Breakdown:
1. Rising Wedge Formation:
The pair has been trading within a Rising Wedge, a bearish reversal pattern that forms when price makes higher highs and higher lows but with diminishing momentum. The wedge is visible from the swing low on May 13, where price began to climb aggressively but within increasingly narrow price action. This narrowing range signals weakening bullish strength.
2. Key Resistance Zone:
The wedge forms right below a Major Resistance Zone marked earlier in the chart (around 0.007050), where price had previously faced heavy selling pressure. This adds confluence to the bearish bias, as the zone historically acted as a turning point.
3. SR Interchange Zone:
Below the wedge lies a Support-turned-Resistance (SR) Interchange level, a critical price area where past support may now act as resistance if the price attempts to retrace. This is a commonly watched level by institutional and technical traders.
4. Breakdown Confirmation:
The price has broken below the wedge's lower trendline, which is often considered the breakdown signal. A valid breakdown typically includes a close outside the wedge body followed by a retest or continuation.
5. Bearish Target:
The projected move is toward 0.006796, derived by measuring the wedge height and applying it from the breakdown point. This level aligns with a historical support zone, adding more confluence to the target.
🧠 Psychological & Structural View:
Bullish exhaustion: Buyers pushed price higher into resistance, but momentum slowed, signaling exhaustion.
Trapped longs: Traders who entered late in the wedge may now be trapped, potentially accelerating a sell-off as they exit.
Smart money behavior: Rising wedges near resistance often signal distribution by smart money before a drop.
🛠️ Trading Plan Suggestion (Not Financial Advice):
Entry: After a clear wedge breakdown, consider short entries on a retest of the broken trendline or a bearish candle confirmation.
SL: Above the wedge high or major resistance zone.
TP: Staggered exits below 0.006850 and final target around 0.006796.
🔁 What to Watch For:
Retest of the wedge breakdown (potential short entry zone)
Momentum confirmation via volume or bearish candles
Price reaction at SR Interchange and final support target
🧠 Minds Section – Condensed Summary
JPY/USD formed a Rising Wedge below major resistance, signaling bullish exhaustion. Price has broken down from the wedge, confirming bearish momentum. A clean breakdown targets 0.006796, with SR interchange acting as a minor support. A retest of the wedge breakdown could offer a good short opportunity.

XAGUSD Technical Analysis : MMC Breakdown from Resistance ZoneChart Concept: By Using MMC – Mirror Market Concepts
🔎 1. Major Resistance Zone – The Brick Wall
At the top of the chart, around $33.85–$34.00, we see a strong major resistance zone. This area has acted as a ceiling for price multiple times in the past. Think of it like a brick wall where the bulls keep trying to break through but get pushed back. When price touches this level and fails to break above it, that’s a clear rejection.
This rejection gives the first sign that buyers are losing steam and sellers are stepping in.
🧠 2. Mirror Market Concept (MMC) in Action
Using the MMC (Mirror Market Concept), we’re treating the chart like a reflection — what happened on one side of the move is likely to mirror or repeat on the other.
So when price aggressively moved up into resistance, you look for a symmetrical move back down once it's rejected — just like looking in a mirror. This concept helps predict where price might land based on previous movements, levels, and psychological patterns.
🧱 3. SR Interchange Zone (Support ↔ Resistance Flip)
Look around the $33.10–$33.25 area — this is a critical SR interchange zone. Price used this zone as resistance in the past, broke above it, and then used it as support.
Now that price has rejected from the top, it’s coming back down to retest this SR zone. If it breaks below this area, it confirms a shift in market structure—from bullish to bearish.
🌀 4. Black Mind Curve Support – Dynamic Support
That curved black line? That’s not just a drawing — it's called Mind Curve Support in MMC. This curve helps map out dynamic support based on price memory and human psychology.
As long as the price respects that curve, the structure is bullish. But once it breaks below it — like it’s threatening to do now — it often means momentum has shifted and a correction is underway.
⛓️ 5. Bearish Breakdown Structure
Once price touched the major resistance, it formed two swing highs labeled TP1 and TP2. That’s very similar to a double top pattern, which is a strong bearish reversal signal. After the second peak, price dropped sharply — that’s your early confirmation of a potential move lower.
And now, price is forming lower highs and lower lows, another classic sign of bearish momentum taking over.
🎯 6. Target Zone – Why $32.72?
Here’s where MMC really helps:
The projected target zone is $32.72, which is marked in the chart.
Why this exact level?
It’s previous market structure (support zone from earlier)
It aligns with the 50% Fibonacci retracement
It’s the mirror reflection of the bullish move, completing the MMC concept
This is a high-probability area where buyers may step in again.
💼 Trade Setup Summary (Educational Only)
Parameter Level
Entry Below $33.20 after confirmation candle
Stop Loss Above $33.85 (recent high)
Take Profit $32.72 (MMC Mirror Target)
🧠 Final Thoughts – The MMC Edge
This chart isn’t just about lines and levels. It’s about understanding how traders think — where they get excited, scared, greedy, or exhausted. That’s what Mirror Market Concepts (MMC) are built on.
By recognizing structure, psychological curves, and SR flips, you're not just guessing—you’re reading the market’s mind.
⚠️ Risk Disclaimer
This is not financial advice. Always use proper risk management and confirm setups with your own trading plan before entering any trade.

Bitcoin (BTC/USD) Bullish Breakout – Targeting $116K Using MMCBitcoin has printed one of the most powerful continuation setups in technical analysis — a Bullish Pennant — and it's playing out beautifully, backed by Mirror Market Concepts (MMC). Let's break down the structure, the reasoning behind this move, and how smart money could be driving this price action.
📈 1. Market Context – The Impulsive Rally That Set the Stage
The first thing to notice is the strong bullish move that occurred before the pennant started forming. This rally is important because a Bullish Pennant is a continuation pattern, and without a strong preceding trend, the pattern loses its credibility.
This initial move acts as the “pole” of the pennant — a clean, impulsive leg upward, driven by demand and momentum.
Such moves are often the result of strong buying from institutions, retail FOMO, or positive macroeconomic catalysts.
🧠 Psychology Insight: The rally injects confidence into the market. Buyers who missed the move now wait for a pullback, while early buyers prepare to scale in on continuation.
🔺 2. Bullish Pennant Structure – The Calm Before the Next Storm
After the bullish pole, the price enters a tight consolidation phase, forming a symmetrical triangle:
Lower highs and higher lows compress price into a pennant shape.
Volume usually declines during this phase, showing that the market is resting, not reversing.
The market is essentially "charging up" for the next big move.
💡 Why This Matters: The Pennant shows temporary equilibrium between buyers and sellers. A breakout typically signals which side wins — and in this case, buyers have taken control.
🪞 3. Mirror Market Concepts (MMC) – The Secret Weapon
This chart also showcases the power of MMC (Mirror Market Concepts), a strategy based on the idea that the market tends to reflect its previous behavior, structure, and reactions.
Here’s how MMC applies:
The price broke out of the pennant, then came back to retest the breakout area, just like it did during the previous breakout from the consolidation zone.
The Mini SR – Interchange zone acted as resistance before, and now it’s acting as support — a classic Support/Resistance flip (SR flip).
The retest behavior mirrors the earlier breakout structure, offering a confirmation that the market is following a familiar rhythm.
📊 Trading Logic: When a market behaves similarly at two different points in time, it’s often a signal of institutional activity — "smart money" repeating proven entry points and exits.
🔁 4. Retesting – The Entry Opportunity for Smart Traders
After the breakout from the pennant, price didn’t just shoot up — it pulled back to retest the broken structure. This is a high-conviction setup in technical trading:
✅ Retest confirms the breakout was valid (not a fakeout).
✅ It provides a safe entry point for traders who missed the initial impulse.
✅ Volume and bullish candle structure post-retest indicate buyer interest.
📌 The Mini SR – Interchange zone, around $106,631.69, acted as the perfect launchpad for the next bullish leg.
🎯 5. Trade Setup – High R:R Swing Opportunity
Let’s look at the exact setup this chart offers:
Entry: After the breakout and retest near $107K–$108K
Stop Loss (SL): Below the support zone at $106,631.69
Target (TP): At $116,105.65 — derived by projecting the height of the pole from the breakout zone
This gives an excellent reward-to-risk ratio, a key principle in sustainable trading.
🧠 6. Psychological Fuel – Why This Move Has Legs
Traders who missed the earlier rally are now watching closely for entries.
Retail traders are seeing confirmation.
Institutions may already be in from lower levels and are now defending support zones.
Sentiment is bullish post-retest, increasing volume and momentum.
It’s a self-fulfilling prophecy: as more traders recognize the pattern and the confluence, the trade becomes even more likely to play out.
🗓️ 7. What to Watch Next – Smart Risk Management
Even though the pattern looks strong, smart traders always remain cautious:
✅ Move SL to breakeven once price moves halfway toward the target.
🔄 Consider taking partial profits near interim resistance zones (like $112K).
📆 Stay alert for economic events or Bitcoin news that could cause sudden volatility.
📘 Conclusion: Bullish Setup with Proven Structure and MMC Confirmation
This BTC/USD chart is a textbook example of a Bullish Pennant breakout, with added strength from Mirror Market Concepts and a clean SR Flip retest. For swing traders and price action lovers, this setup offers a structured, strategic, and smart opportunity to ride the next wave of Bitcoin momentum.

GBPAUD - One More Leg for Bears to Take Over!Hello TradingView Family / Fellow Traders. This is Richard, also known as theSignalyst.
📈GBPAUD has been overall bullish trading within the rising channel marked in blue.
However, it is currently approaching the upper bound of its channel acting as an over-bought zone.
And the $2.1 - $2.104 is a strong resistance zone.
🏹 Thus, the highlighted red circle is a strong area to look for sell setups as it is the intersection of resistance and upper blue trendline acting as a non-horizontal resistance.
📚 As per my trading style:
As #GBPAUD is around the red circle zone, I will be looking for bearish reversal setups (like a double top pattern, trendline break , and so on...)
📚 Always follow your trading plan regarding entry, risk management, and trade management.
Good luck!
All Strategies Are Good; If Managed Properly!
~Rich
Disclosure: I am part of Trade Nation's Influencer program and receive a monthly fee for using their TradingView charts in my analysis.

Gold (XAU/USD) Technical Analysis – Rising Wedge Breakdown & MMC🧠 2. Introduction to Mirror Market Concepts (MMC):
MMC, or Mirror Market Concepts, is a powerful technique that views price action as symmetrical or repetitive in nature. In this scenario, we notice that the right side of the chart mirrors the left — suggesting that after this bullish climb, the market might repeat its earlier bearish behavior but in a reflected pattern.
This adds confluence to our bearish outlook and makes the forecast more robust.
🔺 3. Rising Wedge Pattern – Bearish Reversal Signal:
The most critical part of this analysis is the formation of a Rising Wedge — a classic reversal pattern. Let’s break down what it means:
Structure: The wedge is formed by two upward-sloping trendlines converging at the top.
Volume Behavior: Volume typically decreases as the wedge matures, showing that bulls are losing strength.
Psychology: Buyers keep pushing the price higher, but each move has less momentum than the last. Sellers are quietly preparing for a breakdown.
The moment price breaks below the wedge’s lower trendline, it usually triggers panic selling or aggressive short entries.
🔄 4. Key Price Levels & Zones:
Minor Resistance Zone: Price rejected near a historical resistance area, showing sellers are still active.
Previous Target Zone: This area acted as a ceiling before the rejection — important for reversal confirmation.
SR Interchange Zone: A classic zone where support becomes resistance — this adds strong confluence to the reversal idea.
🎯 Bearish Trade Plan & Take-Profit Levels:
Once the wedge breaks down, the projected move is based on measured moves and prior support levels. Here’s the breakdown:
✅ TP1 (Take Profit 1): 3,275.30 – This is the first key support level right after the wedge breakdown. Ideal for partial profits.
✅ TP2: 3,205.64 – Previous support zone from earlier consolidation. High probability target.
✅ TP3: 3,169.18 – A more extended target that aligns with historical price memory and full wedge depth.
Each TP level is supported by historical price structure and previous volume clusters.
⚠️ Risk Factors & Trade Management:
While this setup looks strong, always consider:
False Breakouts : Wedges can fake out traders. Wait for candle close confirmation below the wedge.
News Events : Macroeconomic announcements (especially U.S. dollar data) can reverse technical setups.
Risk-to-Reward: Don’t enter without calculating your stop loss above the wedge and aiming for at least a 1:2 ratio.
🧠 Conclusion – What This Setup Tells Us:
This chart is a perfect blend of price action + market symmetry (MMC). The rising wedge signals that bulls are running out of steam, while MMC suggests a mirrored decline could follow.
If price action confirms the breakdown with momentum and volume, this could be a high-probability short setup for swing traders and intraday players alike.

GBPCHF: Long Setup – Bounce from Trendline + EMA CrossThe price has bounced from the lower boundary of the ascending channel and confirmed a bullish reversal after EMA cross. Current momentum supports a long position.
📌 Entry: Market buy (current price ~1.1142)
🎯 Targets:
TP1: 1.1291 – minor resistance
TP2: 1.1394 – upper channel border
🛡️ Stop-loss: Below 1.1090 (under channel + EMAs)
This setup favors continuation of the bullish trend after liquidity grab and structure shift.

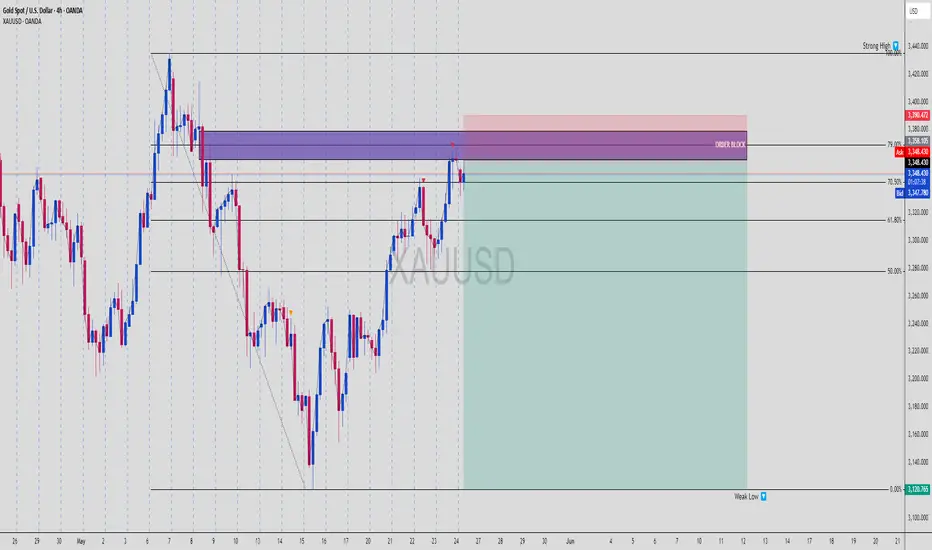
GOLD Short Setup – OB Rejection + FVG Play to Weak Low 📉 XAUUSD | 4H Short Setup – Classic Smart Money Reversal Zone
Gold is giving us a prime reversal opportunity off a stacked supply zone, aligning with:
🔵 79% Fibonacci Retracement
🟪 High-Timeframe Order Block (OB)
🚫 Failure to create a new high (bearish intent confirmed)
Let’s break it down:
🔻 1. Price Structure Insight
Clean swing high printed near 3400
Retraced down to a discount zone, then sharply reversed
Price now tapping into a premium supply zone between 70.5% – 79% Fib
🟣 2. Key Zone Confluence
📍 Order Block: The final up-candle before a massive drop = institutional sell zone
📍 Fibonacci Levels: 70.5%–79% = premium sell levels
📍 Internal Liquidity: Price swept local highs before stalling
📍 Strong High Above: Untouched = inducement for future sweep (or rejection fuel)
Everything screams Smart Money Sell Setup 📉
🎯 3. Trade Idea
Sell Entry: Around 3,348
Stop Loss: Above OB & Strong High ~ 3,390
Take Profit: 3,120 (clear weak low = liquidity pool)
⚖️ 4. Risk-Reward Ratio (RRR)
📥 Entry: 3,348
🔒 SL: 3,390
💰 TP: 3,120
✅ RRR ≈ 1:5.4
Perfect textbook SMC setup—high confluence + asymmetric RRR = 🔑
🧠 5. Why This Setup Works
Retail traders are lured into longs after bullish push
Smart Money taps OB, rejects hard at premium
Target: internal liquidity resting at weak low (3120)
This creates a controlled sell-off that avoids grabbing the strong high
🟢 Drop a “GOLDEN SHORT 🪙💥” if you caught this setup before the crowd
💾 Save it for reference – this is how institutions trap liquidity
📤 Share with your trading fam — this setup is 🔥🔥🔥
GJ-Mon-26/05/25 TDA-Big range, possible scalping buy! Analysis done directly on the chart
Follow for more, possible live trades update!
There are periods when price will push smoothly,
others when price give little pushes and not so
clean. Understanding and reacting to how good
the volume is and price readiness is important to
create a consistent edge in your system.
Not financial advice, DYOR.
Market Flow Strategy
Mister Y

GU-Mon-26/05/25 TDA-WR 1.35790 hit, some pullback now?Analysis done directly on the chart
Follow for more, possible live trades update!
I can't, you can't. Nobody can catch every single
move on the chart. Knowing when there are higher
probabilities to win, it's a key to your long term edge.
Not financial advice, DYOR.
Market Flow Strategy
Mister Y

Another small cap primed for a breakout?Very clean range formation on the verge of a breakout. Price has rallied nicely into the top of range. We just need to see where the pullback comes to but overall, a great area to start accumulating. Ideally a bullish candle close on the monthly would indicate a “safer” entry. A quick and easy target would be the EQ of the FVG which is around the macro 50% level
*note the arrows are not time analysis just price pathway.

EURUSD Trendline Breakout – Bullish Target Ahead
EURUSD has successfully broken out of a strong descending trendline, which was acting as dynamic resistance for weeks. The breakout is backed by strong bullish candles and clear higher lows forming.
After the breakout, the price also reclaimed a key horizontal support zone around 1.12573, turning it into a solid base for further upside.
🎯 Bullish Target (Expected):
First major bullish target at 1.13864 based on the 1.618 Fibonacci extension from the last swing move.
📌 Support: 1.12573
📌 Breakout Confirmation: Valid as long as price holds above the trendline and support.
📈 Outlook:
The momentum looks strong for further bullish continuation. If the price holds above the breakout zone, we expect a move toward 1.13864 in the coming sessions.

Breakout after a brutal ~10 year Range? A great risk to reward trade in play with price pulling back and printing bullish hammer into the covid low demand structure, major 50% and near previous ATH zone. Expect price to move quickly up through the range here for a potential breakout of a brutal 10~ year range.
Great place to buy are the LPS (pullbacks) and trail SL on the monthly swing bottoms.
The 100% extension is a minimal target with price potentially slicing through it after such a long consolidation.
*Arrows are not based on time analysis just a path for PA

MERL Markup phase inbound? Overall, PA has been building up nicely on the daily TF with a clean Wyckoff range building. In phase D we’re seeing increased volume on up bars with larger spreads than the pullback candles. Market could be ready to move into Phase E (markup) after the SOS and pullback. The pullback is sitting nicely on the range top, range 50% level and FVG of Thursdays 22/5 candle.
Daily swings 1 bar and weekly 1bar/2bar swings are up.
Could enter now for more aggressive play as 25 May daily high is broken indicating continuation of trend with SL under the low. However, have to be careful as BTC is primed for a potential pullback to around 98-100k~

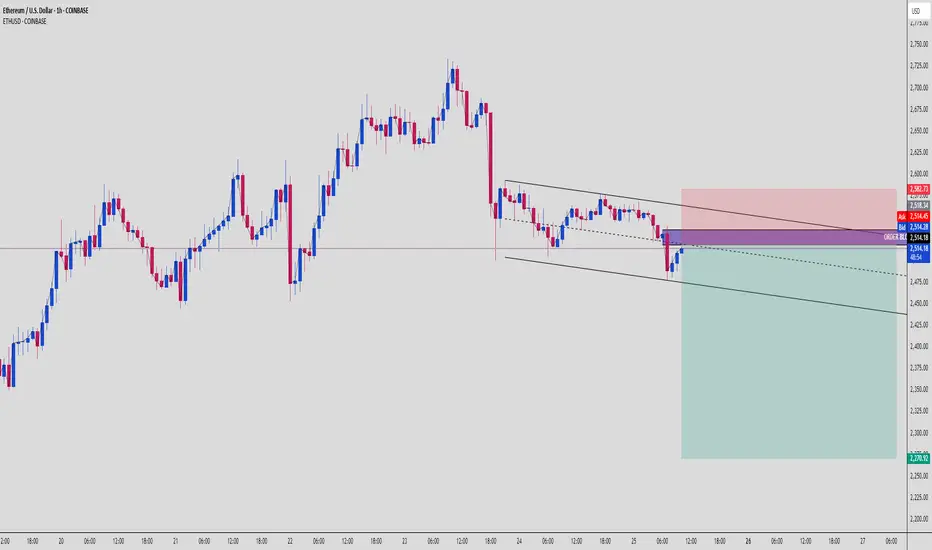
ETH Trap & Drop Setup – OB Rejection + Bearish Channel📉 Ethereum (ETHUSD) | 1H SMC Breakdown | Bearish Setup Explained
Another clean setup for the SMC gang. ETH just gave us a beautiful opportunity, respecting market structure, reacting to Order Block supply, and aiming to clean up sell-side liquidity. Let’s dive in 👇
🧱 1. Structure: Bearish Channel Formation
ETH has been moving in a tight bearish channel, producing:
Lower highs (confirmed supply zones)
Lower lows (liquidity grabs + structure breaks)
This shows consistent bearish pressure.
🧊 2. Premium OB Tap + Rejection Zone
Price just retraced into a Bearish Order Block sitting in the Premium zone, right around $2,514.
💥 OB zone is aligned with:
Upper channel resistance
Supply rejection
Clean inefficiency fill
Price wicked inside and immediately rejected = Smart Money active.
🧠 3. Retail Psychology Trap
Retail likely:
Longing support bounce
Placing stops under structure lows
Not respecting OB/imbalance narrative
Meanwhile, Smart Money:
Enters short from OB
Targets imbalanced zones
Eyes the $2,270 weak low
🎯 4. Liquidity Pool & Final Target
🔻 Target Zone: $2,270
This level is:
A weak low (high chance of being swept)
Sits at lower channel boundary
Acts as a liquidity magnet
Expect price to accelerate as it approaches this zone.
⚔️ 5. Trade Plan (Short Setup)
📍 Entry: $2,514 OB Zone
🔐 Stop Loss: Above $2,582 (structure break + OB invalidation)
🎯 Targets:
TP1: $2,460
TP2: $2,400
TP3: $2,270
⚖️ RRR: ~1:4+ – high precision trade
🧠 Key Concepts in Play:
Order Block Rejection
Premium Pricing Sell Setup
Bearish Channel Continuation
Liquidity Sweep Targeting
📌 Chart Summary:
"Don’t chase candles – follow the narrative. OB tells the story, liquidity gives the profit."
📚 Study the OB zone reaction. These setups repeat every week across assets if you know what to look for.
💬 Drop “ETH OB SNIPER” in the comments if this is your kind of entry.
📈 Tag a trader who needs to stop fading Smart Money moves!
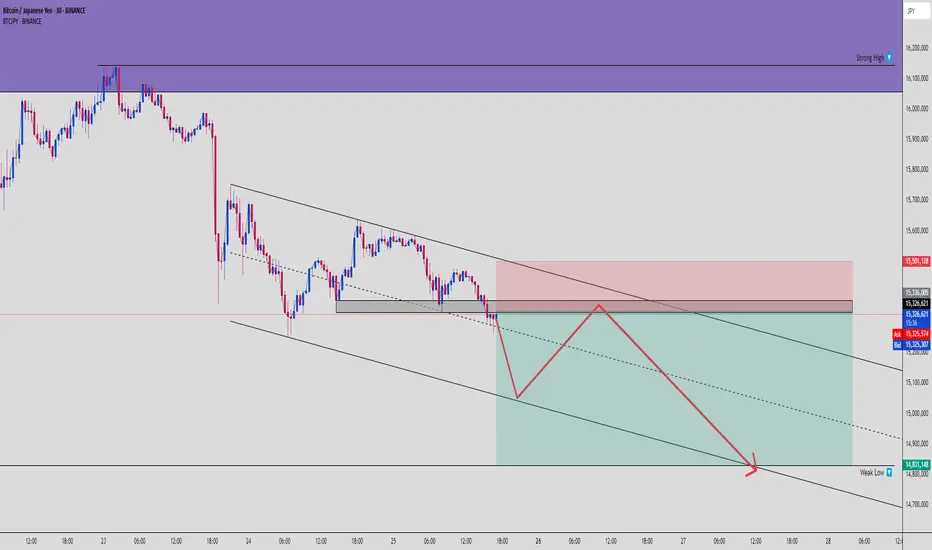
BTCJPY Bearish Channel Setup – OB Rejection to Weak Low Sweep🧠 Bitcoin vs Yen (BTCJPY) | 30M Smart Money Breakdown
BTCJPY is painting the same story we’ve seen before: liquidity builds → OB rejection → channel continuation → weak low sweep. This is how the markets bleed slow then drop fast. Let’s break it down.
🧱 1. Bearish Channel Structure
We’re inside a clear descending channel, where price:
Forms consistent lower highs (supply zones)
Prints lower lows (liquidity grabs)
Shows rejections at channel tops = perfect confluence
This structure supports a continuation downward move.
🧊 2. Order Block + Supply Rejection
Price recently tapped into a clean Bearish Order Block (OB) within the premium zone just under 15.5M.
OB was respected with a sharp reaction
Immediate sell pressure confirms Smart Money entry
Red zone = OB + supply + channel midline
No candle closes above OB = bias confirmed bearish.
🧲 3. Smart Money Flow vs Retail
Retail likely went long on the mini bounce.
Smart Money waited for:
Price to tap into the OB
Retail to stack longs
Opportunity to fill imbalance and dump
This gives us an ideal Sell-to-Buy-to-Sell structure forming.
🕯️ 4. Projected Move: Weak Low Sweep
🧨 Target = 14,831,148
Why?
That’s a marked Weak Low
It aligns with channel support
It’s a known liquidity magnet
Expect acceleration into this zone.
⚔️ 5. Trade Plan (Short Setup)
📍 Entry Zone: 15.315M – 15.33M
🔐 Stop Loss: Above OB → ~15.50M
🎯 Targets:
TP1: 15.200M
TP2: 15.000M
TP3: 14.831M
⚖️ RRR: ~1:4+ depending on execution precision
🧠 Summary:
This chart screams:
“Trap the liquidity, respect the OB, ride the channel.”
These setups repeat. Same pattern, different chart, every week.
📣 Engage Call:
💬 Comment “BTCJPY SHORT SNIPER” if you caught this one
👥 Tag your trading partner – don’t let them miss this play
🔄 Save this chart to study the OB entry mechanics
Coiling for a Breakout – Watch This LevelAfter a strong upward move, BYBIT:SUIUSDT is currently consolidating in a sideways range, forming what appears to be a falling wedge pattern — a classic bullish continuation setup.
If this pattern plays out, there's a good chance the price will resume its uptrend, supported by a bullish divergence forming within the wedge. The key level to watch is the resistance at 4.0040. A clean breakout above this level should be backed by strong momentum. However, if the price breaks above but quickly drops back below 4.0040, it could signal a lack of buying pressure — increasing the risk of a failed breakout.
This bullish scenario remains valid as long as the price holds above 3.5868. The next potential upside targets are 4.7996 and 5.0552.
Keep an eye out for a high-volume breakout and a strong candle close above 4.0040 to confirm the move.
What’s your take on BINANCE:SUIUSDT ?

Sideways Still in Play for ETH After RejectionIf you find this information inspiring/helpful, please consider a boost and follow! Any questions or comments, please leave a comment!
Recap
Ethereum just tapped into a key Area of Interest and got rejected. The move confirmed short-term resistance while keeping the broader wave structure intact. Although no clear breakdown has followed, the rejection signals that the asset is still mid-cycle.
The expectation now is for a sideways consolidation. This aligns with a developing wave 4, but the price action ahead will determine how this structure unfolds.
Wave Structure
At present, the count favors a completed wave 3 followed by a wave 4 that is still forming. The rejection at the AOI fits the narrative of a corrective structure underway. Whether that plays out as a triangle or a flat will depend on how the next legs print.
Key markers are in place:
AOI was respected
No breakdown of the prior key support level
Above the 0.382 to 0.5 retracement zone remains in focus as a reaction area
Should price expand beyond typical retrace/time boundaries, the degree of the count may need to be adjusted. A more complex correction or a deeper reset could shift the current interpretation from a wave 4 into something more substantial.
Outlook
• Rejection confirms resistance
• Expecting sideways movement to continue
• Watching the 0.382 to 0.5 zone for key price behavior
• Price action will determine the next wave structure
• If momentum expands rapidly, degree reassessment is on the table
Ethereum’s current posture suggests a market in digestion mode. Whether this leads to a launch into wave 5 or deeper corrective behavior, the next prints will be critical. No confirmation of bullish continuation yet.
More updates soon as the next leg develops.
Trade safe, trade smart, trade clarity.

#202521 - priceactiontds - weekly update - dax futuresGood Day and I hope you are well.
comment: tl;dr covered it. I would be really surprised if we see 24000 again over the next days, if not months. If there is no 180° reversal from orange face next week, this is a de-facto embargo and we will see new lows over the summer.
current market cycle: trading range and very broad bull channel on the weekly time frame
key levels for next week: 22000 - 24000
bull case: My base assumption is that we have started a new bear trend on Friday and any pullback will be a lower high. The higher bulls can get it, the better and weaker the trend will be. On Friday they could not hit the 50% retracement and if bears are strong, market will not trade above 23750 for the next weeks/months. If bulls can get above it, their next target would be the breakout retest 23900. Above 24000 means I am wrong about my thesis and market is doing something else, which will likely be a trading range 23000 - 243000.
Invalidation is below 22900.
bear case: Last Sunday I only wanted to short this but bears did not do enough until then. Friday changed it and I am in full bear mode if Monday goes well for the bears. Clear invalidation above 24000 and if bulls do not get it, shorts with stop new ath are reasonable. Donald gave the gift to bears, now I want to see some carnage. Market held above the daily 20ema but likely only due to the climactic selling, bears happy for any profit for such a long time and algos buying the first touch of the ema. Next targets for bears are the obvious round number 23000 and then closing the big gap down to 22600 and yes, I absolutely think we can get there next week.
Invalidation is above 24000.
short term: Neutral until bears show me some follow-through and not letting the bulls out with anything above 23800/23900. We need a big open bear gap and then we can see some bull slaughter.
medium-long term from 2025-05-25: My rough guess from early May was down over the summer and up into year end. POTUS certainly helped with the 50% tariffs. I need to see market reaction next week and if there is no 180° reversal until Friday, they will become reality the week after and dax should do 20-30% down over the next months. Markets were not positioned for any risk what so ever. Now we got the atomic trade bomb.

#202521 - priceactiontds - weekly update - nasdaq futuresGood Day and I hope you are well.
comment: Not as bearish as I am on dax but I think market should not go above 21200 again and continue down. For that to happen, bears need to leave a strong bear gap somewhere. Gap down on Monday or Tuesday will likely do the trick. If the bull trend line holds and the current bear trend line breaks, There is the small possibility of another leg up but for now I can’t see that happening.
current market cycle: trading range
key levels for next week: 19000 - 21000
bull case: Bulls need to stop the selling and reverse to above 21000 fast or bears will push this much lower. If they manage to stay around 21000, more bears could doubt the strength of this selling but it’s a weak argument as of now. If bulls go only sideways around 21000 and close Monday above it, that would change a lot to the better for them. They have support from the daily 20ema until clearly broken.
Invalidation is below 20600.
bear case: Bears see a clear topping pattern with at least 3 decent tries of going above 21350 and now we have the strong selling on Friday with a total escalation of the trade war with the EU. Bears were given a gift and they need follow-through and leave a big gap that has to stay open, like the bulls did with the 3 current open gaps. Targets for the bears in order are the breakout retest 20277, 20000 and then the prior support around 19300/19400 which is around the 50% retracement.
Invalidation is above 21200.
short term: Neutral until we clearly have follow-through selling by the bears. I want to lean max bearish but need more confirmation.
medium-long term - Update from 2024-05-24: Will update this section more after the coming week but in general the thesis is as for dax. Down over the summer and sideways to up into year end. I don’t think the lows for this year are in.

#202521 - priceactiontds - weekly update - wti crude oil futuresGood Day and I hope you are well.
comment: The past week we saw 3 tries by the bulls to push above 63 and they found no acceptance. I got trapped once because the spike looked so strong but it got zero follow-through. Markets will only try one direction so many times before they try the other one.
current market cycle: monthly time frame is a broad bear channel - weekly tf is a bear wedge - daily is a trading range
key levels: 55 - 63
bull case: Bulls need to stay above 60 or risk that the market tries back down to 56 or lower. If they can go sideways inside the given range, the better and if we hit 63 enough, it will break. Problem for them is, they tried couple of times now and the odds that 60 breaks are bigger than the breakout above 63. Friday was strong enough to expect not a big bear day on Monday but I am not eager to buy this.
Invalidation is below 59.8.
bear case: Bears need a stronger break below 59.8 for more downside and they need to make a lower high below 62. That’s the whole story. They are slightly favored since we are at the top of the current range that has been going on for almost 2 months now. They have defended the bear gap up to 64.5 more than 5 times.
Invalidation is above 64.4
short term: Neutral. Shorts closer to 63 are good or on a clear break below 59.8. No interest in buying up here unless bulls do something big above 64.4 and break the bear trend line.
medium-long term - Update from 2025-05-25: Need a clear break of the trading range 54 - 64 before we can come up with new targets. Bear trend is valid until the trend line breaks.

#202521 - priceactiontds - weekly update - bitcoinGood Day and I hope you are well.
comment: Bulls finally got the breakout on Wednesday and we printed the new ath. My max upside target was around 115/116k and the high so far is 112k. Can we do more? Bull trend line is unbroken, so yeah. We have seen 3 clear legs up and betting on more is always a bad strategy. My broader bearish bias also includes btc and I expect another try above 110k but it can be a higher high or lower high, you never know in advance.
current market cycle: Broad bull channel on the weekly and monthly chart. Daily is in a tight bull channel that will likely break next week
key levels: 100k - 115k
bull case: Bulls are fine as long as the trend line holds and they stay above 100k. I don’t have any targets above 116k and I do think we are in the last stretches of this trend. So if you are looking for confirmation bias on your “btc to 1mil”, you have come to the wrong place.
Invalidation is below 100k.
bear case: Bears need the daily close below 100k and/or print a clear lower high. Right now we have one big bear bar from Friday with terrible follow-through. Bears are not doing enough so don’t be early. I expect btc to hit at least 80k again this year but for now there is not much more to comment on until bears come around. Worst case for bears would be sideways above 100k for 2-3 weeks because that would be huge confirmation and bulls could dream about prices above 120k.
Invalidation is above 116k.
short term: Neutral. Expecting another try above 100k but that should conclude this bull trend. Only interested in shorts once bears come around.
medium-long term - Update from 2025-05-25: Will update this next week but plan here is the same as other markets. I wait for this to top out and trade it back down to 80k over the summer.
