BITCOIN PULLBACK 110.000🔹 The uptrend remains intact
After setting a new high, the price may enter a mild correction toward the $110K zone.
Key support levels in this uptrend are:
✅ $115K
✅ $110K
✅ $105K
As long as the price holds above $105K, any pullback is considered healthy and the uptrend is likely to continue.
📊 A shallow correction is part of a healthy market structure.
Priceaction

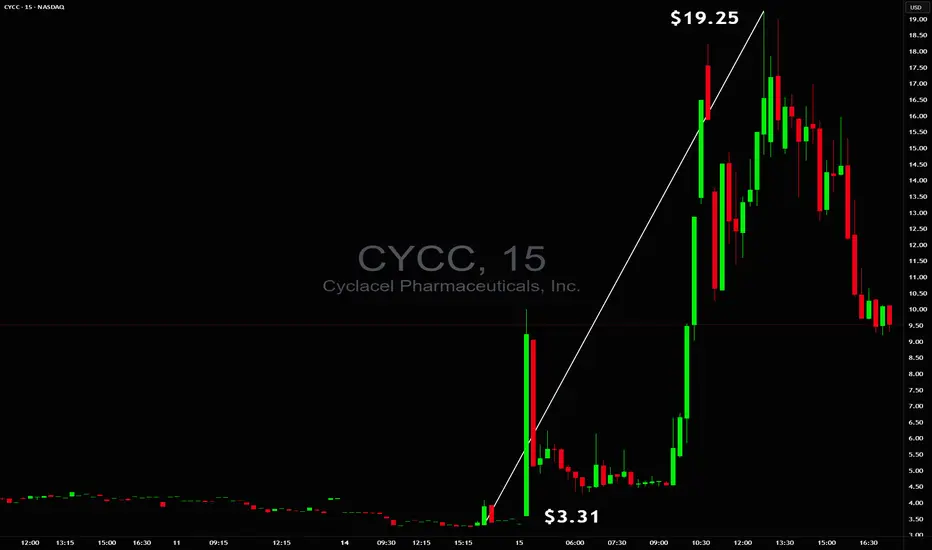
$3.31 to $19.25 in minutes$3.31 to $19.25 in minutes 🚀 but without a safe trade setup ❌ NASDAQ:CYCC
Too unstable to trade early while end of day there was a chance for power squeeze but even on 60M+ volume, tiny float and huge borrow fee they were able to reverse it so safe stop had to be respected ✔️
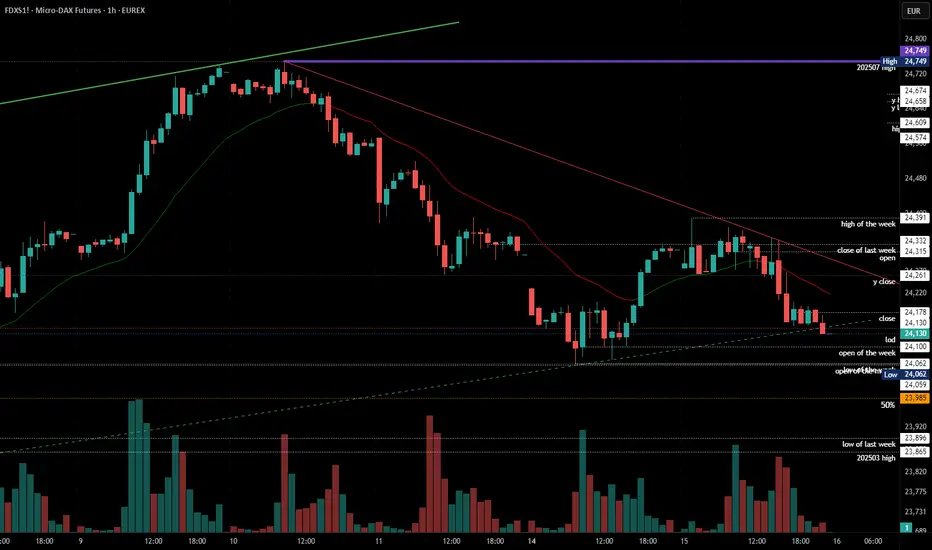
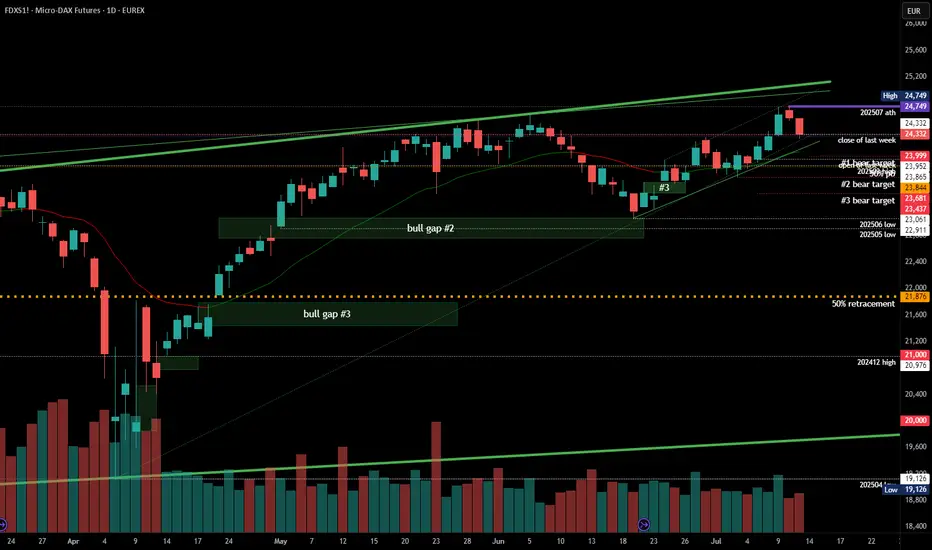
2025-07-15 - priceactiontds - daily update - daxGood Evening and I hope you are well.
comment: Very important day tomorrow. If we trade below 24000, this means we saw leg 1 from 24749 down to 24100 and leg 2 could lead us to 23500 or lower. Until we have clearly broken below 24000, I remain neutral but hopeful we can finally go lower again.
current market cycle: trading range
key levels: 23000 - 24750
bull case: Bulls need to stay above 24000 or risk a sell-off down to 23700ish. No matter how you try to draw the bull trend lines, they are all broken now but bears need lower lows below 23690 to confirm it. Daily ema is around 24100 and it has been support for 3 weeks and that is the reason I remain neutral for now.
Invalidation is below 24270.
bear case: Bears need to break below the daily ema and close below. Only then can we go lower. It’s good for the bears that they printed a lower high below 24400 but we are still too high for bulls to give up on BTFD.
Invalidation is above 24400.
short term: Neutral. If we stay below 24400, we have a shot at breaking down but 24000ish is support until proven otherwise. The selling today was not strong and the chart is rather neutral. Bears have only set up a potential structure which could break down but you have to wait for confirmation before betting on it.
medium-long term from 2025-06-29: Bull surprise last week but my targets for the second half of 2025 remain the same. I still expect at least 21000 to get hit again this year. As of now, bulls are favored until we drop below 23000
trade of the day: Scalping between 24250 - 24300 which was clear support & resistance for 4h after EU open. The bear breakdown was a surprise and not obvious to trade.
Remains Below 1.3700 Ahead of CPI Data from the US and CADUSD/CAD Remains Below 1.3700 Ahead of CPI Data from the US and Canada
USD/CAD continues to decline ahead of inflation data from both the US and Canada.
The US inflation rate is expected to rise to 2.7% year-over-year in June, up from 2.4% recorded in May.
Meanwhile, Canada’s CPI is forecasted to increase by 1.9% year-over-year in June, up from 1.7% in May.
USD/CAD is trading around 1.3690 during the European session on Tuesday, following two days of gains. The pair is declining as the US dollar (USD) continues to weaken ahead of the June CPI data from the US. The inflation figures will provide new insights into the Federal Reserve's (Fed) monetary outlook.
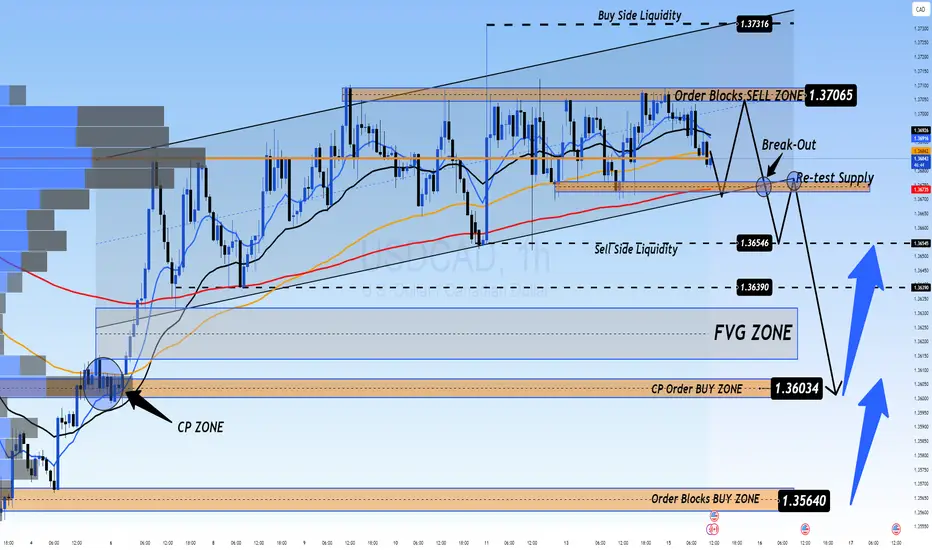
📉 Market Outlook for USD/CAD – Possible Drop on CPI Release
The USDCAD is still in a downtrend, and a sharp drop could occur with today’s CPI data release. Currently, there are two Buy Side Liquidity zones above and Sell Side Liquidity below, with the price balanced around the VPOC zone, which will soon decide the direction after the CPI announcement today.
Market liquidity still holds a FVG below, and with CPI data expected to favor USD, this could trigger a sharp drop towards this liquidity zone, possibly nearing CP OBS at 1.3600, followed by a potential rebound.
If price breaks CP zone, it may head toward a strong OB zone near 1.35xxx. Therefore, caution is advised when monitoring these OB zones.
🎯 Trading Strategy for Today
🟢 BUY ZONE: 1.36000
SL: 1.35500
TP: 1.36500 → 1.37000 → 1.37500 → ????
💬 What are your thoughts on USD/CAD ahead of the CPI data release? Do you expect a strong bounce or a continued decline? Share your views and join the conversation below!
👉 Follow for more updates and insights, and join the community to discuss real-time market moves!
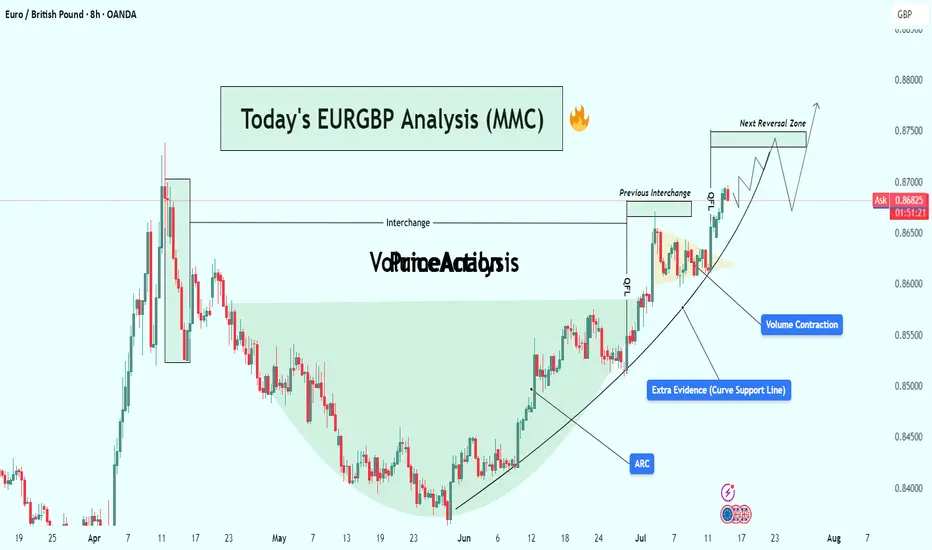
EURGBP Analysis : Bullish Setup + Support & Reversal Zone Ahead🔍 Overview:
This analysis explores a well-developed Mid-Market Cycle (MMC) pattern playing out on the EUR/GBP 8H chart. The price action has transitioned from accumulation to markup, forming a classic cup-shaped recovery structure supported by a parabolic ARC curve. With strong volume contraction, historical interchange zones, and clean breakouts, this setup indicates bullish momentum heading into the next reversal zone.
Let’s walk through each component in detail and build the case for this trade setup.
🧩 1. MMC Cycle Framework
The chart structure aligns with the MMC (Mid-Market Cycle) model:
Phase 1 – Accumulation:
From April to late May, price formed a rounded bottom resembling a "cup" — a known sign of smart money accumulation. The downward momentum stalled, and sellers were gradually absorbed by larger participants.
Phase 2 – Breakout & Expansion:
Early June saw price breaking out of this base, beginning an aggressive uptrend supported by rising structure. This marks the transition to the markup phase of the MMC.
Phase 3 – Pullback & Continuation:
Price pulled back slightly into previous resistance (now turned support), forming a bullish continuation triangle and breaking out again. A textbook MMC continuation.
🧠 2. Technical Confluences
✅ A. ARC Support Curve
The curved support line (ARC) acts as dynamic demand.
Price has bounced multiple times off the curve, reinforcing its strength.
ARC patterns often signal increasing bullish acceleration, reflecting market psychology as traders gain confidence with each higher low.
✅ B. Interchange Zones
The concept of Interchange refers to zones where support becomes resistance or vice versa.
This chart features two key interchange levels:
First interchange formed after the April high.
Second interchange was retested and held cleanly after the breakout.
These areas indicate institutional interest, and their successful retests confirm trend continuation.
✅ C. Volume Contraction
Volume has been shrinking during the markup, which is counterintuitive but strategic.
In Wyckoff theory, this shows absorption of supply — institutions deliberately suppress volatility to accumulate before the next breakout.
Once the contraction ends, explosive moves often follow.
🎯 3. Target Zone: Next Reversal Area
Price is now heading into a clearly defined resistance zone around 0.87400–0.87500.
This level was respected in prior price history (April peak) and may trigger short-term selling or distribution.
The chart shows a possible liquidity grab scenario at the reversal zone, followed by a corrective move (mini bearish ABC).
📈 4. Price Projection & Scenarios
Bullish Case (High Probability)
Breakout Above 0.87500: Triggers a major leg upward.
Potential extension targets:
0.87850 (Fibonacci projection)
0.88200 (next higher timeframe resistance)
Bearish Case (Short-Term Pullback)
Rejection at Reversal Zone:
A corrective leg toward the ARC or prior interchange.
Ideal re-entry for buyers near:
0.86400–0.86600 zone
Or curve retest near 0.86000
🧭 5. Trade Strategy
🔹 Entry Options:
Breakout Entry: Above 0.87500 on strong candle + volume.
Retest Entry: On dip toward ARC curve or interchange.
🔹 Stop-Loss Ideas:
Below ARC line (~0.86000)
Below last bullish engulfing (~0.86250)
🔹 Targets:
TP1: 0.87500
TP2: 0.87850
TP3: 0.88200 (longer-term swing)
💡 6. Trader Psychology in This Chart
This chart represents a controlled bullish structure — a hallmark of smart money participation. Here’s why:
The rounding base was methodically built without sudden volatility.
Each breakout was followed by healthy retests (no fakeouts).
Volume stayed low during markups, reducing retail confidence and allowing institutional loading.
The ARC curve reflects increasing confidence and participation — buyers consistently stepping in on higher lows.
📌 Conclusion
This EUR/GBP setup is a textbook MMC/ARC structure with multiple confirmations:
Smart accumulation
Curve support respected
Volume and structure aligned
Clear next resistance zone
Whether you’re swing trading or monitoring for breakout scalps, this is a high-quality setup worth tracking. Be ready to act at the reversal zone, as it will either confirm continuation or offer a lucrative retest entry.
🔔 Follow for More:
I post regular MMC, structure-based, and Smart Money trade setups. Drop a like, comment your thoughts, or ask questions below!
USDJPY Analysis : Bullish Channel Strategy & FMFR Zone Reaction🧩 Market Structure Overview
USDJPY has been in a strong bullish market structure, forming consistent higher highs and higher lows since the beginning of July. The pair recently created a rising ascending channel, where price action has respected both the upper and lower bounds with clean impulsive and corrective moves.
From the 11th to 15th July, USDJPY moved steadily within this bullish channel, forming minor consolidation zones and reacting to short-term supply-demand levels. However, on the 15th, we witnessed a pullback from the upper channel resistance, indicating short-term profit-taking or internal bearish liquidity sweep.
🧠 Current Price Action
Now, price is pulling back and approaching a high-confluence demand zone, marked as:
FMFR (Fair Market Fill Range): A zone where unfilled buy-side orders are likely resting.
SR Flip (Support-Resistance Interchange): A previous resistance zone, now turned into a potential support base.
This area (between 146.80 – 147.00) has multiple confirmations:
Past supply zone → broken and retested
Strong impulsive bullish move originated here
Mid-point of the current bullish channel
Psychological level (147.00 round number)
The market is now offering a potential buying opportunity from this zone, provided a bullish confirmation pattern is printed on lower timeframes (1H or 30M).
🔍 Key Technical Confluences
Bullish Ascending Channel:
Clearly respected — suggesting institutional accumulation. Price is now retesting mid-level or base structure of this channel.
FMFR Zone:
Typically used to spot unbalanced price areas where limit buy orders may rest. Smart money often returns to fill these zones before moving further.
SR Flip:
The prior supply zone from July 8–10 was broken decisively, and price is now using this same level as support.
Liquidity Sweep & Trap:
The current rejection from the channel top may have liquidated early longs. That opens room for a smart-money reversal from the deeper FMFR zone.
📌 Trading Plan (Execution-Based Strategy)
🔽 Entry Criteria:
Wait for a clear bullish reversal candle within the FMFR zone (e.g., bullish engulfing, pin bar, morning star).
Entry can be refined on the 1H or 30M timeframe using a BOS (Break of Structure) signal.
🟢 Buy Zone:
Between 146.80 – 147.00
🔴 Stop Loss:
Below 146.40, well below the FMFR zone and recent wick lows
🎯 Take Profits:
TP1: 148.20 – Retest of the central channel zone
TP2: 149.60 – Next Major Reversal Zone
TP3 (Optional): 150.00 psychological round level (if bullish continuation breaks structure)
⚠️ Risk Management Tips:
Wait for confirmation — don’t rush into the zone without candle proof.
Risk only 1-2% per trade idea.
Adjust lot size according to stop-loss distance.
Avoid chasing if price closes below 146.40 — structure will be invalid.
🔮 What Could Invalidate This Setup?
Clean break below 146.40 support with bearish structure forming (LL, LH)
Bearish fundamentals from USD side (e.g., CPI, FOMC impact)
A tight channel breakdown without bullish volume
📅 Fundamental Backdrop:
USD is currently reacting to macro data and rate expectations.
JPY remains weak structurally, unless BOJ introduces surprise tightening.
US CPI & Fed commentary may influence short-term volatility and liquidity grabs.
🧠 Conclusion:
USDJPY is presenting a high-probability buy setup as it revisits a strong confluence zone formed by FMFR + SR flip. Smart money often re-engages at these levels after liquidity hunts, especially within a bullish structure. Watch for confirmation on lower timeframes, and manage risk responsibly.
This trade idea is based on price action, structure, and institutional concepts, aiming for a trend continuation with clear invalidation levels.

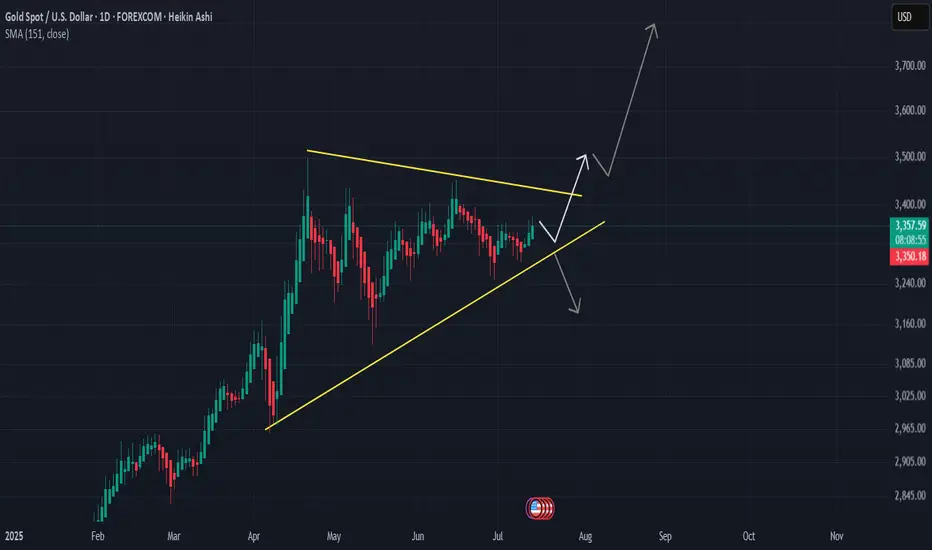
XAUUSD: Gold Moves Sideways, Awaiting Key Economic DataXAUUSD: Gold Moves Sideways, Awaiting Key Economic Data – Correction or Continued Uptrend?
🌍 Macro Overview – Waiting for CPI Data from the US
At the moment, Gold is trading in a wide sideways range between the 3x and 4x price levels, while traders are awaiting key economic data this week from USD, GBP, AUD, and EUR.
📊 Important Economic Data Today:
US CPI Report will be released during the US session today, making it one of the most important reports of the month.
CPI forecast is at 0.3%, which is considered positive for the US economy.
This report is expected to align with the recent Nonfarm data, and could lead to significant price movements upon release, potentially helping to adjust liquidity in the market.
🔍 Technical Analysis – Current Trend with Key Resistance Levels
The current trend remains bullish, but the movement on higher timeframes isn’t as pronounced.
Key resistance levels are located around 337x to 339x, where selling pressure is currently strong.
If price breaks through these levels, Gold could find support and move towards 3400.
📈 Short-Term Forecast:
A pullback to around 333x is expected, offering a good buying opportunity.
Looking further, 331x is a potential target, as the price range remains quite wide.
🎯 Trading Strategy for Today
🟢 BUY ZONE:
Entry: 3331 – 3329
SL: 3325
TP: 3335 → 3340 → 3345 → 3350 → 3360 → 3370 → ????
🔴 SELL ZONE:
Entry: 3392 – 3394
SL: 3398
TP: 3388 → 3384 → 3380 → 3376 → 3370
⚠️ Important Notes:
Watch for support and resistance levels to set up scalping trades that align with the current market trend.
Always set SL and TP to protect your account and avoid FOMO when there’s no clear confirmation for entry.
The 3350-3347 range is a key zone to look for buy opportunities.
💬 What’s your take on Gold’s movement today? Do you think it will break the resistance or will we see further correction? Share your thoughts in the comments below and join the discussion with fellow traders!
👉 If you want more daily updates and to participate in live discussions, don’t forget to follow and join our community! Let’s take advantage of these market opportunities together.
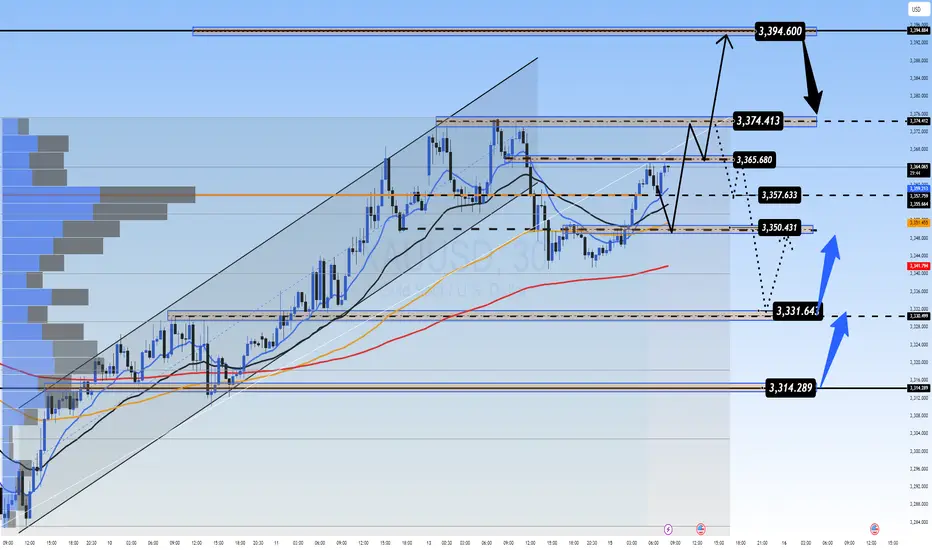
Gold/XAUUSD Analysis Breaks Bullish Channel – Targeting 3400+🟨 Market Context:
Gold (XAU/USD) has recently completed a significant technical move that signals the potential start of a strong bullish continuation phase. After a period of consolidation inside a descending channel, price has broken above key resistance levels and is showing firm buyer strength across the board.
🔍 Technical Structure Breakdown:
🔹 Descending Channel (Consolidation Phase)
For several sessions, gold was confined within a well-defined descending channel, which typically indicates a temporary correction in a broader bullish trend. This phase served as a liquidity-building zone where smart money accumulated long positions.
🔹 Breakout & Retest Confirmation
The breakout above the upper boundary of the channel was clean and impulsive, confirming bullish intent. This breakout aligned perfectly with a previous demand zone (now retested as support), adding strong confluence.
Key Breakout Zone: $3,330–$3,340
Retest Action: Price pulled back to test the breakout zone, respected it, and printed a bullish reversal.
This behavior confirms the “breakout–retest–continuation” pattern—highly reliable in trending markets.
🔹 SR Interchange – Key Pivot Zone
The level around $3,340 served a dual role:
Previously acted as resistance within the channel.
Now acting as support post-breakout (SR flip).
This interchange area is significant because it reinforces the idea that bulls are now defending this level aggressively.
🔹 Bullish Pattern Confirmation
A bullish price pattern has formed exactly at the SR zone and near the trendline. This double confluence (pattern + level) provides high-probability trade setups and confirms the entry point for buyers.
🔹 Ascending Trendline Support
An emerging bullish trendline is now guiding the move upward, confirming that the market has shifted its short-term trend. Every bounce on this trendline reinforces bullish structure and validates higher-low formations.
🎯 Price Targets & Expectations:
✅ Previous Target Zone:
Around $3,375, already tapped and respected.
This shows that gold is following technical targets with precision.
🎯 Next Bullish Target:
$3,400 – $3,410 zone stands as the next supply region.
This area is a major psychological resistance and aligns with historical reaction points.
🧠 Trading Insight & Strategy:
With current price action and momentum, buying dips remains the optimal approach, provided the price stays above the SR Interchange zone.
🔽 Entry Zone: $3,345 – $3,350
📈 Targets:
TP1: $3,375 (partial exit)
TP2: $3,400–$3,410 (final target)
❌ Invalidation Zone (Stop Loss): Below $3,330
Breaking below this would invalidate the breakout structure and possibly signal a false breakout.
📌 Summary:
✅ Clear breakout from descending channel
✅ Retest of previous demand and SR flip zone
✅ Bullish pattern confirmed on key support
✅ Ascending trendline intact
🎯 Next logical move: $3,400+
The gold market is giving strong bullish cues, and this setup could be a textbook example of “buy the breakout, ride the trend.”
Stay sharp, trade smart, and keep your risk in check. 👑

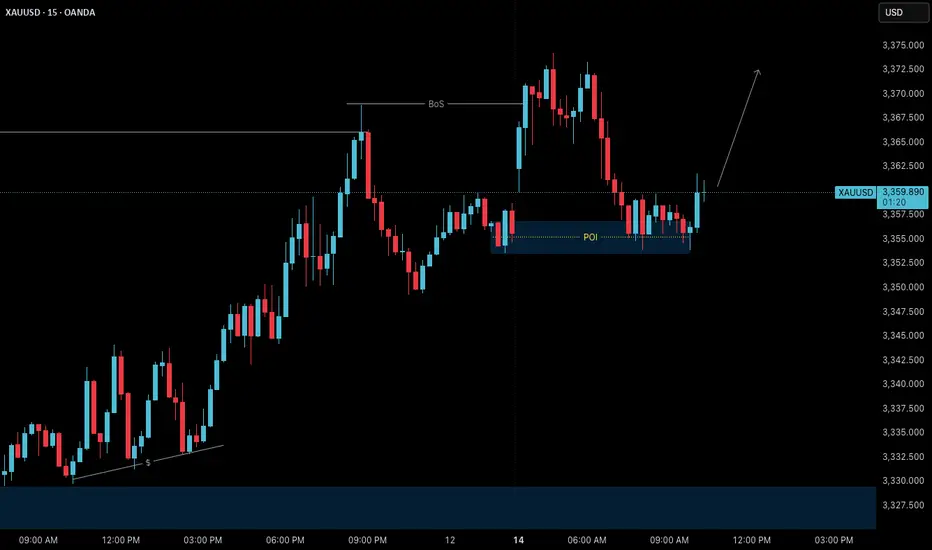
Gold – M15 Downtrend in Play | July 15 Analysis🔻 Gold (XAUUSD) – July 15 Analysis | Bearish Bias Until Proven Otherwise
The market has entered a pullback phase on H4, and we’re expecting a potential retest of the 3320 Order Block before any continuation of the broader uptrend resumes.
🔍 M15 Market Structure:
✅ ChoCH followed by BoS confirms a downtrend on M15
🎯 Current short-term objective: Retest of H4 OB (3320)
📍 Price Action Context:
Price is now revisiting the same M15 POI where yesterday’s short setup originated.
Last session, this POI was respected, but instead of creating a new Lower Low, price is trading inside the same zone again.
This signals indecision — so we let price reveal its intent
🧭 Trade Planning Scenarios:
Scenario 1 – Bearish Continuation:
→ If the POI is respected again with clear M1 confirmation ( Micro-ChoCH + BoS ), we will plan for a short setup toward 3320
Scenario 2 – POI Breaks:
→ If price breaks above this POI zone, the next key level to observe is the 3355–3359 supply zone
→ We’ll reassess from there based on new confirmation
📌 Bias for Today:
🔻 Bearish bias remains intact as long as M15 structure does not shift back to bullish.
All setups must align with structure — we are short-biased only until the market proves otherwise
📖 Structure before emotion. Let the market invite you — not the other way around.
📘 Shared by @ChartIsMirror

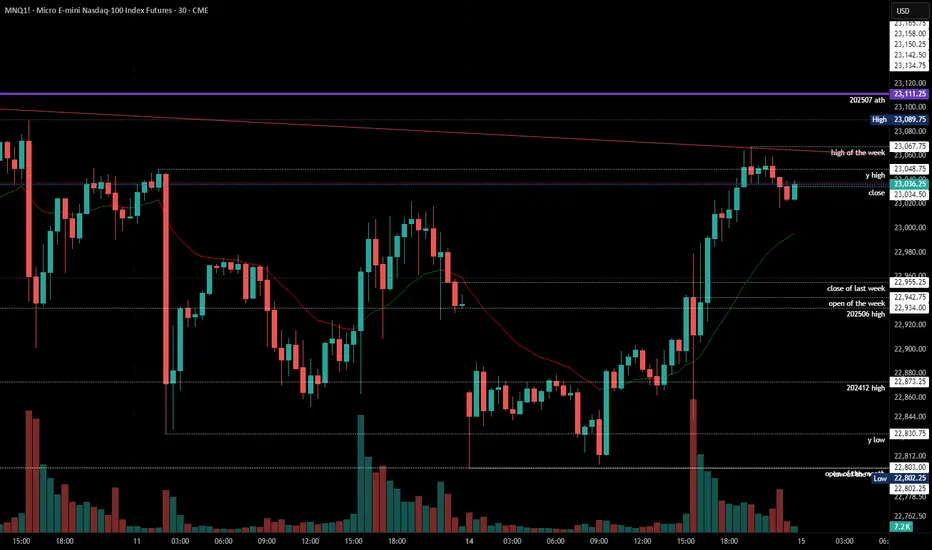
2025-07-14 - priceactiontds - daily update - nasdaqGood Evening and I hope you are well.
nasdaq e-mini futures
comment:
The biggest surprise for next week would be a huge gap down Sunday futures open and having that gap stay open. If bears could actually do something like that and trap all bulls who bought above 22600, that would be amazing.
Spoiler: Bears could not. Another gap down and bear trap. It’s sad but the reality. Don’t expect strong bears all of the sudden.
current market cycle: bull trend
key levels: 22000 - 23100
bull case: Bulls defended 22800 which is still as bullish as it gets. Don’t make it more complicated than it is. We are going sideways under the ath, can print a new one any given day. Since I don’t have any targets above 23100ish, I won’t make stuff up here. I only wait for the profit taking to begin to look for shorts.
Invalidation is below 22700.
bear case: Bears are sad. Need a daily close below 22700. If they prevent bulls from printing a new ath above 23111, I would be surprised. No need to write more here until we see much much bigger selling pressure.
Invalidation is above 23500.
short term: Neutral. Bears not doing enough and bulls going sideways under ath. No interest in buying, so I am neutral until big bears come around.
medium-long term - Update from 2024-06-29: No change in plans. I expect 20000 to get hit over the next 3 months and maybe 19000 again.
trade of the day: Long the double bottom above 22800 or the retest on US open around 22830. Bears failed to print consecutive good looking 30m/1h bear bars, so a reversal was the most likely outcome after the double bottom.
XAUUSD - GOLD TO UP and never back down.never say never.
Due to the current and near-future military and political developments, gold will maintain its upward trend for a long time, and any short position will only be a temporary correction.
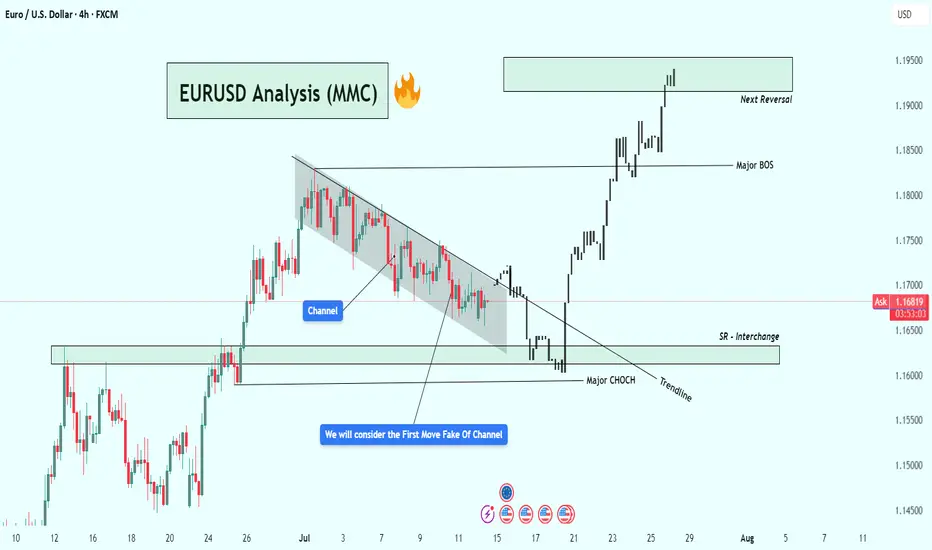
EURUSD Analysis – Smart Money Breakout + Reversal Zone in Play🔹 1. Bearish Channel & Liquidity Trap Setup
Price action from late June into mid-July formed a clearly defined descending channel, with consistent lower highs and lower lows. This structure likely attracted retail traders into short positions, expecting continued downside.
💡 Key Insight: The initial breakout of the channel was a fake move — often referred to as a liquidity grab or inducement. This is typical in smart money models where institutions trap early traders before the real move begins.
🔹 2. Major CHoCH (Change of Character)
Shortly after the fakeout, price sharply reversed and broke a major internal structure level, giving us our first CHoCH confirmation. This is a critical event in SMC, signaling a possible trend reversal from bearish to bullish.
Why it matters: A CHoCH after a channel + fakeout combo is a strong reversal signal, especially when supported by volume and aggression.
Visual cue: Look at the bullish engulfing momentum candle post-fakeout — this was the moment smart money entered.
🔹 3. Trendline Break + SR Interchange (Support/Resistance Flip)
Following the CHoCH, price broke the trendline and came back down to test a high-probability SR Interchange Zone — an area where previous resistance turned into fresh support.
This zone also aligns with the order block and inefficiency area, making it a premium entry for institutions.
Notice how price respected the zone before launching aggressively upward.
🧠 Note: This was the cleanest entry point in this setup — combining structure break, liquidity, and a demand zone.
🔹 4. Major BOS (Break of Structure)
After the retest, EURUSD broke the last major lower high, confirming a Bullish BOS (Break of Structure). This is where many traders realized the trend had shifted.
Market sentiment flipped from bearish to bullish.
Momentum increased, indicating institutional buying pressure.
🔹 5. Next Target: Reversal Zone (Supply Area)
Price has now reached a critical supply zone (1.1930 – 1.1970) where the next major reaction is likely to occur. This area was previously a strong rejection point, and it aligns with a potential higher timeframe supply zone.
⚠️ Watch for:
Bearish rejection wicks
Liquidity sweeps above highs
Bearish engulfing or mitigation patterns
CHoCH on lower timeframes (1H, 15m)
✅ Key Trading Takeaways:
Liquidity Trap: Retail was trapped inside a clean channel.
Fakeout Move: Induced shorts were wiped out.
CHoCH & BOS: Clear reversal pattern with momentum.
Perfect Retest Entry: Price retested demand and launched.
Current Area = Supply/Distribution: Great place to look for shorts or take profits.
📌 Possible Trading Plans:
🔸 Plan A: Reversal Short (Countertrend)
Entry: Inside 1.1930–1.1970 zone
Confirmation: Bearish PA + LTF CHoCH
TP1: Previous BOS (~1.1830)
TP2: Demand zone retest (~1.1650)
SL: Above 1.1980–1.2000
🔸 Plan B: Continuation Long (Breakout Bias)
Entry: Break + Retest above 1.2000 psychological level
SL: Below breakout wick
TP1: 1.2100
TP2: 1.2200+
🔖 Concepts Applied:
Smart Money Concepts (CHoCH, BOS, liquidity sweep)
Price Action Structure
Trendline break and retest
Supply & Demand Zones
Support/Resistance Flip (SR Interchange)
Volume + Momentum Confirmation
🔄 Conclusion:
This chart demonstrates a classic Smart Money narrative:
“Trap the retail, shift the structure, drive price into premium, then reverse.”
We're now at a make-or-break supply zone. Watch price behavior carefully — this is where smart traders either secure profits or prepare for the next leg.
Gold – M15 Bias Within POI Zone | July 14 Analysis🟡 Gold – M15 Bias Within POI Zone | July 14 Analysis
As discussed in our previous H4 analysis, Gold opened the week with a gap above the spinning top candle, effectively skipping seller pressure and breaking above the H4 swing high ( 3366 ).
This Break of Structure (BoS) confirmed the H4 bullish continuation , and now price may be preparing for a pullback toward the 3320 Order Block (OB) before resuming its upward trend.
🔍 M15 Intraday Bias:
📍 Price is currently trading inside the 3355 M15 POI zone — a potential continuation zone
🔄 On Lower Timeframes ( M1 ), a micro ChoCH has already occurred — an early signal of possible bullish interest
However, we're still waiting for a micro BoS to validate the reversal and confirm that the POI is being respected
Until that confirmation is in place, we continue to observe market behavior and remain patient
🧭 High-Probability Scenario:
If the current zone fails to hold or doesn’t provide clean M1 confirmation , we will shift focus to the 3320 OB , which remains the most reliable zone for a long setup in line with the H4 trend
A pullback to this level, combined with confirmation, would provide a strong case for continuation trades
🎯 Observational Trade Plan:
✅ Plan 1 (Aggressive Option):
→ If M1 micro BoS occurs from 3355 zone , a short-term long setup may be considered based on internal structure
✅ Plan 2 (Conservative Option):
→ If price pulls back to 3320 OB and M1 confirms , the setup aligns with higher timeframe trend continuation
🛑 Avoid counter-trading — structure remains bullish, and there's no confirmation for shorts at this point
🧠 Final Thoughts:
Let the market do the work. Structure is already pointing up — all we need is confirmation and timing.
No need to rush. Wait, observe, and only execute when the market invites you in with clarity.
📖 Structure leads, emotion misleads. Follow the flow — trade the mirror, not the noise.
📘 Shared by @ChartIsMirror
GBPUSD Week 29 Swing Zone/LevelsAfter 7 straight weeks of profitable gold trading, we’re shifting gears to GBPUSD.
Why this pair? It’s offering a classic low-risk, high-reward setup that many traders appreciate:
🔒 Stop Loss: 10–15 pips
🎯 Take Profit: 50–100 pips
We’re analyzing price action using a simple but powerful concept:
Each zone is drawn based on how the high and low of one day compares with the next. For example:
Monday’s high/low vs Tuesday’s range
Tuesday’s vs Wednesday’s, and so on
This method helps spot potential continuation zones as market structure unfolds across the week.
👉 The key? Patience, and letting the levels tell the story.
As always price action determines trades

NIFTY 24740: Smart Money Signals Bearish Move IncomingThe directional bias is clear – bearish – and I'm currently waiting for a precise setup to present itself. Based on the Smart Money Concept, we could be looking at a potential short opportunity around the 24740 zone.
📍 Once the setup is confirmed, I’ll be sharing the exact entry and stop-loss levels with you.
Stay tuned – patience here is key. Let the market come to us.

GBPCAD OUTLOOKIn this analysis we're focusing on 2H time frame for finding possible upcoming movement in price. So as per my strategy today I'm looking for a sell trade opportunity. Confirmation is very important, after confirmation we'll execute our trade. Let's see which opportunity market will give us.
Always use stoploss for your trade.
Always use proper money management and proper risk to reward ratio.
This is my prediction.
#GBPCAD 1H Technical Analysis Expected Move.

#202528 - priceactiontds - weekly update - daxGood Evening and I hope you are well.
comment: Third leg up is done and now it’s all about how long do we need for a lower low below 23680 again. For now I don’t know since we have another risk-off news but of them were bought the past 3 months, so I remain skeptical. Too early for shorts but I think longs near 24000 are likely good for a bounce to either retest 24749 or print a lower high.
current market cycle: bull wedge
key levels for next week: 23000 - 24800
bull case: Bulls want to continue sideways to up and trap all eager bears again who think that 30% tariffs between the US-EU are bad. Those poor souls. Markets can only go up.
Invalidation is below 23680
bear case: Bears need a lower low below 23680. That’s all there is to it. No idea how fast and if we get there but shorts before are most likely a gamble, since literally every dip since April has been bought and especially every Sunday Globex gap down became a giant trap. I do think 24749 is a perfect double top with the prior ath from June and we can go down from here but until we have a daily close below 23680, I am not eager to run into another bear trap.
Invalidation is above 24749
short term: Neutral. Tariff news are bad but they are not in-effect, so could be that we see another bear trap. I don’t know and I won’t pretend otherwise. Sitting on hands.
medium-long term from 2025-06-29: Bull surprise last week but my targets for the second half of 2025 remain the same. I still expect at least 21000 to get hit again this year. As of now, bulls are favored until we drop below 23000.
$7.73 to $76.00 in 1 day! Another 800% runner $INKTAGAIN? Another 800% runner in a day? 🚀 Such massive moves became a daily thing these days? 😲 NASDAQ:INKT
Can't wait to see new one in the morning!

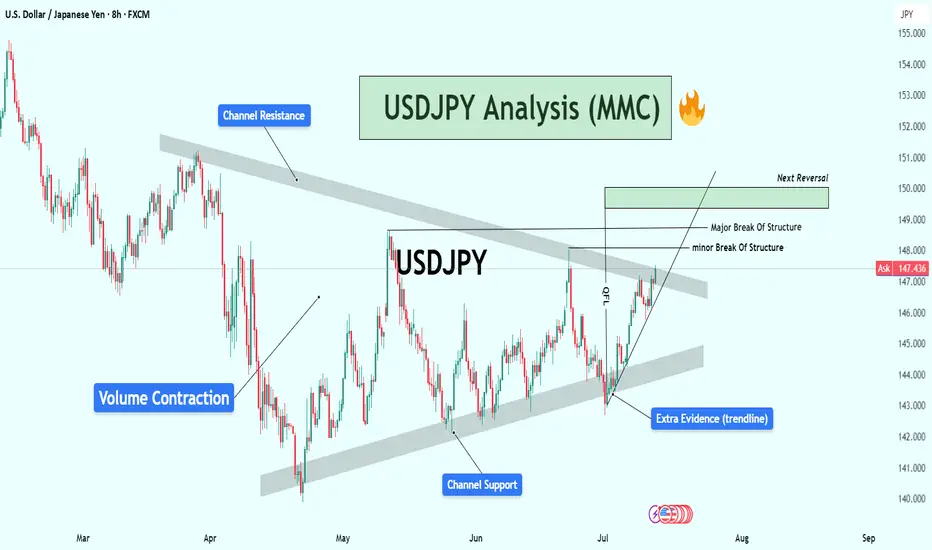
USDJPY Analysis : Major Move Loading Towards Target Zone🕵️♂️ Overview
The USDJPY pair is approaching a critical turning point within a well-established descending channel structure. After several months of corrective movement and internal structure shifts, the market is now displaying multiple layers of confluence pointing toward an impending major reaction or reversal. Let’s break down this chart step by step.
🧱 Market Structure Analysis
🔹 Descending Channel:
The entire chart is governed by a broad descending channel, with price making lower highs and lower lows since early March.
Each touch of the channel support has led to a bounce, and the price is now once again near channel resistance, creating a possible reaction zone.
🔹 Volume Contraction Phase:
In the mid-section of the chart, we observe volume contraction, indicating liquidity drying up and buyers/sellers entering a phase of uncertainty.
This contraction is typical in accumulation or re-accumulation phases, which often precede strong impulsive moves — exactly what followed here.
🧩 Structural Breaks and Trendline Clarity
🔸 Minor Break of Structure:
A recent high was taken out in early July, marking a minor break of structure (BOS), showing the first signs of bulls taking short-term control.
🔸 Major Break of Structure:
A more significant high (marked on the chart) has also been broken, confirming a major BOS — this implies institutional positioning or a shift in market sentiment.
🔸 Trendline Break – Extra Confirmation:
The bullish push came after breaking a clean internal trendline, which acted as diagonal resistance.
Once this trendline broke, price aggressively accelerated upward — this is a classic market maker cycle (MMC) Phase 2 (expansion) move.
📍 Confluence at Next Reversal Zone (149.00 – 150.00)
The green highlighted zone is the next potential area for bearish pressure to return, based on:
Key Supply Zone: Historical area where sellers previously dominated.
Channel Resistance Confluence: Top of the descending channel aligns with this zone.
Psychological Level: 150.00 is a major psychological round number — often attracts profit-taking and institutional activity.
Fibonacci (if plotted): Likely 78.6% – 88.6% retracement from last swing high.
Overextended Rally: Price has rallied strongly since early July with very little correction — it’s approaching exhaustion.
🔄 Market Maker Cycle (MMC) Alignment
This move perfectly reflects the Market Maker Cycle:
Accumulation: During volume contraction phase.
Manipulation: Fakeouts near channel support to trap shorts.
Expansion: Break of structure + trendline, aggressive rally.
Distribution (Next): Likely to occur at the 149–150 zone with a sharp rejection.
🧠 Trader’s Plan – What to Look For
📈 If Bullish:
Targets: 148.80 to 149.80 zone
Hold until rejection signs (bearish candles, volume spikes, divergences)
SL: Below recent swing low/trendline (~146.00)
📉 If Bearish (After Rejection):
Watch for:
Strong bearish engulfing candle or shooting star
RSI/MACD divergence (not shown but suggested)
Break of short-term ascending trendline
Targets: Back toward 145.50 or mid-channel (dynamic)
🔖 Summary
USDJPY is showing clear signs of bullish exhaustion near the upper channel resistance and major structure levels. If price respects this zone (149–150), expect a healthy corrective leg or full reversal. Multiple layers of technical evidence, including structure breaks, trendline breach, and MMC phases, are aligning for a high-probability play.
This is a textbook setup for experienced traders watching key zones with proper confirmations.
XAGUSD Weekly Analysis (MMC) : Bullish Channel Toward Target🧠 1. Trend Shift Confirmed – Silver in Full Bullish Momentum
Silver has officially broken free from its multi-year sideways range and has entered a well-defined ascending channel, pushing toward higher highs week after week. The momentum is strong and supported by a combination of technical elements, structure shifts, and clean retests.
The trend is now clear: bullish, with the price aiming for the Next Reversal Zone between $46 and $48 — a level not seen since mid-2020.
🔷 2. Blue Ray Break – Start of the Rally
The breakout began with a clean move above the Blue Ray trendline, a key structure that had suppressed Silver’s growth for several years.
As the chart notes:
“Blue Ray Always Continue Trend” — until broken.
Once Silver broke above this resistance, it not only confirmed the trend reversal but also triggered the formation of a new bullish market structure, supported by aggressive buying.
🔁 3. SR – Interchange Zone Holding Strong
The SR Interchange zone (around $27 – $30) has played a critical role in this breakout. It acted as:
Resistance during the multi-year range.
Then Support after the breakout, confirming a classic Support-Resistance Flip (SRF).
This zone now serves as a solid demand base, giving the rally a stable foundation to push higher.
🪙 4. QFL Formation – Momentum Confirmation
The breakout also aligns with a QFL (Quick Flip Level) structure — a powerful bullish continuation pattern.
QFL setups form when price breaks above a former base, pulls back slightly, and then quickly resumes the upward trend.
This indicates that buyers are aggressive and unwilling to let price fall too far, fueling a rally.
Combined with the ascending channel, the QFL structure gives extra confidence that Silver is on track to reach the $46–$48 Reversal Zone.
📏 5. Trendline & Channel – Price Structure in Control
Silver is currently moving cleanly within an ascending parallel channel, respecting both upper resistance and lower support trendlines. The inner trendline has been tested multiple times, and price is now riding its upper half.
This shows:
Buyers are in control.
Each correction is shallow.
Market confidence is growing week after week.
Expect volatility to increase as Silver approaches the next target area.
🎯 6. Next Reversal Zone: $46 – $48
The green box at the top marks the Next Reversal Zone, where Silver might:
Stall temporarily and consolidate.
Or face a pullback back toward the mid-channel line or lower support.
This zone corresponds to:
Historical supply area (2020 highs)
Strong psychological resistance
Potential profit-taking by institutions or swing traders
🔭 Trade Scenarios to Watch
✅ Bullish Continuation:
If Silver maintains support above $36 and remains inside the ascending channel, we may see a smooth ride into the reversal zone. Look for:
Break-and-retest of the midline
Bullish candles with long wicks on dips
⚠️ Short-Term Rejection:
If price reaches $46–$48 and shows signs of exhaustion (like long upper wicks, evening star, or bearish engulfing), expect a healthy pullback toward $35–$36 or even $32.
As long as the ascending structure holds, bulls remain in control.
🧩 Key Technical Levels
Element Zone / Level Action
SR Interchange Support $27 – $30 Strong demand zone
Blue Ray Breakout Confirmed Trend reversal signal
QFL Zone Around $36 Retest and rally confirmation
Reversal Zone $46 – $48 High-probability reaction area
Trendline Support Dynamic ($35–$36) Bullish channel continuation
📌 Final Thoughts:
Silver is now playing in the big leagues again. With the Blue Ray broken, QFL confirmed, and price following a disciplined trendline channel, this rally looks both technically sound and fundamentally strong.
Watch the $46–$48 zone carefully. Whether price rejects or breaks through, there will be high-probability setups for both breakout traders and dip buyers.
Stay disciplined, don’t chase, and let price give you confirmation.

XAUUSD Analysis : Bullish Move Toward Key Resistance + Target🟩 Overview:
Gold is currently showing a clear bullish breakout on the 2-hour timeframe. The market structure has shifted from a downtrend into a bullish phase, with price now approaching a critical Reversal Zone. Let’s break down the key levels, structure shifts, and potential trade opportunities.
🔍 1. Structure Shift – Trendline Break & BOS Signals:
The price previously followed a Blue Ray Descending Trendline, which acted as dynamic resistance and guided the bearish trend.
As highlighted, “Blue Ray Always Continue Trend” – but in this case, we’ve seen a clean Break of Structure (BOS) that invalidated the bearish setup.
A Minor BOS occurred first, which hinted at weakening selling pressure.
Later, a Major BOS confirmed the bullish transition as the price broke above a key resistance level with strong momentum.
This transition was supported by consistent higher lows and a breakout above the descending resistance trendline — a classic reversal signal.
🟩 2. Demand Zone Reaction – Major Support Held Firm:
The Major Support Zone between $3,280 – $3,300 provided a strong base for buyers.
Multiple wick rejections and bullish engulfing patterns near this zone indicated aggressive buyer interest.
This support has now become the foundation for the recent bullish rally.
🎯 3. Next Target & Reversal Zone:
The current price is hovering around $3,358, showing strong bullish momentum.
The next major resistance area is marked between $3,380 – $3,400, identified as the Next Target + Reversal Zone.
This zone is critical — it aligns with a historical supply area and the previous market swing highs.
Traders should be cautious here, as price may react sharply. Reversal patterns (like bearish engulfing, pin bars, or double tops) could signal a potential retracement.
⚠️ 4. Trade Plan:
🟢 Bullish Bias (Short-Term):
If you entered from the support or trendline breakout, continue to hold long positions until price nears the reversal zone.
Trail stop-loss under the most recent higher low to secure profits.
🔴 Bearish Scenario (Near-Term Reversal Play):
Watch for bearish rejection patterns in the $3,380 – $3,400 zone.
If confirmation appears, potential short setups could offer a retracement back to $3,330 – $3,320.
📌 Key Levels Summary:
Major Support Zone: $3,280 – $3,300 ✅
Next Target + Reversal Zone: $3,380 – $3,400 ⚠️
Current Price: $3,358
Major BOS Level: Confirmed
Trendline: Broken with strong bullish pressure
🧠 Final Thoughts:
Gold has officially shifted gears. The bullish breakout is in motion, and the trendline break + BOS combo supports further upside — at least until the reversal zone is tested. However, this is also where the market could exhaust, making it crucial to monitor price action closely.
Stay patient, wait for confirmation, and let the levels guide your next move.

Gold – H4 Structure at Key Decision Point | July 14 Outlook🟡 Gold (XAUUSD) – July 14 Outlook | Key Reaction Ahead at 3366
Gold closed Friday at 3355.665 , after facing resistance from the H4 swing high (3366) .
While price failed to break that level during the session, the last H4 candle closed as a bullish spinning top , signaling indecision — but with slight bullish pressure.
As we head into Monday’s open, the next move could be pivotal in determining the direction of the upcoming H4 trend leg.
🔮 Key Scenarios to Watch
1️⃣ Bullish Scenario (Preferred Bias):
If the market opens above 3366 , creating a clean Break of Structure (BoS) , it would confirm the continuation of the H4 uptrend.
→ In this case, we will watch for a retest of the 3320 Order Block (OB) — a potential long setup zone.
→ If price gives another BoS after the first, it may also present a continuation entry opportunity, depending on structure.
2️⃣ Rejection / Bearish Case:
If the market fails to break 3366 , we’ll step back and observe how M15 reacts.
→ Consolidation could follow before any significant BoS.
→ In this scenario, patience is key — we’ll wait for either confirmation of a deeper pullback or a structure shift on lower timeframes.
3️⃣ Consolidation Possibility:
There’s also a strong possibility that price consolidates between the H4 swing high (3366) and the 3320 OB before making a structural decision.
→ A tight range can trap both buyers and sellers — so it’s crucial not to act prematurely.
🧭 Trade Bias Summary
✅ If BoS (above 3366):
→ Bullish bias confirmed
→ Look for long on OB retest (e.g., 3320 zone) or next M15 structure break
⚠️ If No BoS:
→ Step back, observe M15
→ Wait for structure clarity before forming bias
🔁 If Range Forms (3366–3320):
→ Stay out until market resolves direction
→ Let breakout + retest guide the next setup
🧠 Final Thoughts
This analysis is shared for educational and structural observation purposes only — not as trade advice or recommendation.
The goal is to track price behavior around key zones and adapt based on how structure confirms or invalidates bias.
📖 Let the market reveal its intention — not with emotion, but through structure.
We don’t predict the breakout — we prepare for both outcomes.
📘 Shared by @ChartIsMirror

ETH Hits $3K — Next Stop: Moon or Pause?ETH just tagged the psychological $3 000 barrier after a sharp impulse, printing a fresh higher high inside its rising channel.
🧠 Game plan:
1️⃣Pullback zone: The orange structure area at $2 550 – $2 700 aligns with the channel’s lower trend-line — a prime spot for bulls to reload.
2️⃣Continuation trigger: A clean 4H close back above $3 000 turns the level into support, unlocking the path toward $3 100 (first target) and potentially higher into the summer.
3️⃣Invalidation: A decisive break below the channel would neutralise the setup and shift focus back to the macro support near $2 400.
Until then, every dip toward the orange demand is a gift in this bullish structure. Trade the plan, not the noise.
📚 Always follow your trading plan regarding entry, risk management, and trade management.
Good luck!
All Strategies Are Good; If Managed Properly!
~Richard Nasr
