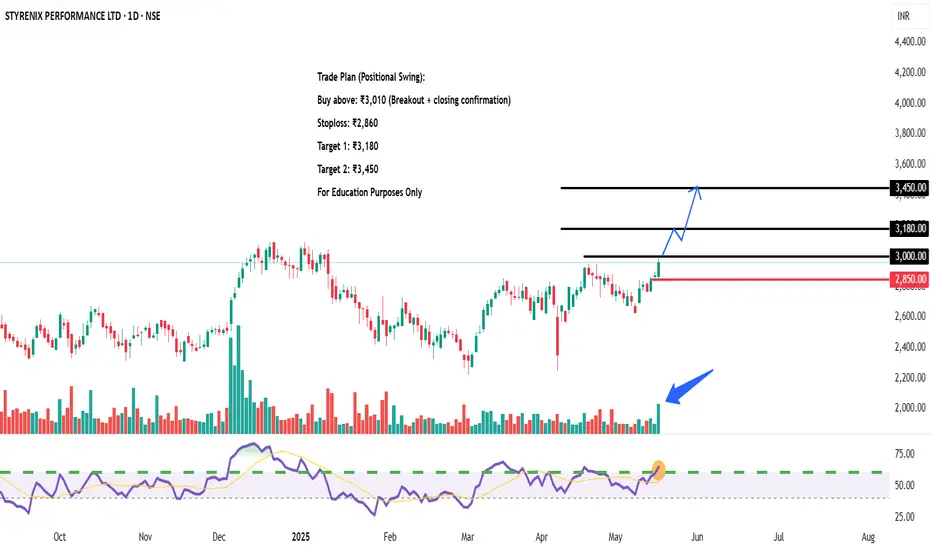
STYRENIX PERFORMANCE LTD – Near Resistance 🔍 Technical View:
Multiple BOS/CHoCH indicate structure shift
Strong low formed at ₹2,100 zone
Demand zones tested & respected between ₹2,400–₹2,600
RSI near breakout level (~70), indicating building momentum
📌 Trade Plan (Positional Swing):
Buy above: ₹3,010 (Breakout + closing confirmation)
Stoploss: ₹2,860
Target 1: ₹3,180
Target 2: ₹3,450
Sell below: ₹2,850 (If resistance holds or breakdown happens)
Priceaction
WTI Update | Oil CrashSince the last update we were able to perform about two to three swing trades. One from $70 - $79, and from $79 to $68. The next move I'm looking for is another short position from current market price ~($62) to swing to the next major low $33.
We saw a rejection last week and we're currently pulling back to retest the little selloff we had.
Could say this next local move will look to selloff mid week making its way back to $57 which would be a nice short term swing.
The $33 target would be the long term swing of course and moving on I would like to see a break below $57 and a retest.

GOLD → Correction & The decline will continueGold is trading below major resistance zones: Bearish Bias Below Key Levels
Price recently rejected this zone multiple times, forming lower highs and showing bearish momentum.
📉 Idea: Sell
📍 Sell Zone: $3,245–$3,250
📍 Sell Zone: $3,265–$3,270
Bias remains bearish unless price breaks and holds above $3,270.
Comment below your thoughts. Thank you.

GU-Mon-19/05/25 TDA-Closure above for buy and below for sell!Analysis done directly on the chart
Follow for more, possible live updates!
Before trade analysis
During trade analysis
After trade analysis
All important steps to fully understand
technically and fundamentally why price
moved this, that way.
Not financial advice, DYOR.
Market Flow Strategy
Mister Y

NZDJPY: Another Bullish Confirmation 🇳🇿🇯🇵
If you remember, I already posted a bullish outlook for NZDJPY on Friday.
This morning, I spotted one more intraday bullish confirmation.
I see a breakout of a resistance line of a bullish flag pattern on an hourly time frame.
I expect a bullish movement at least to 85.9 level soon.
❤️Please, support my work with like, thank you!❤️
I am part of Trade Nation's Influencer program and receive a monthly fee for using their TradingView charts in my analysis.

Market Analysis For DXY: Week of May 19thThe DXY has an interesting weekly chart with some key levels that could support further bearish price action.

EUR/USD – Symmetrical Triangle Breakout & Bullish Continuation🔍 Overview
The EUR/USD pair has presented a classic and high-probability trading setup based on a symmetrical triangle formation, which recently experienced a bullish breakout. This pattern has formed after a period of compression and consolidation, creating a coiled spring scenario. Technical traders often watch for such breakouts as they signal the resumption of momentum with clear entry, stop-loss, and target zones.
This chart combines pattern recognition, key price action levels, psychological curve mapping, and structured trade planning. Let’s dive deeper into each component.
🧱 1. Chart Structure and Pattern Analysis
🔷 Symmetrical Triangle Formation
A symmetrical triangle is a continuation pattern formed when price action contracts between two converging trendlines.
This represents market indecision — both buyers and sellers are cautious, gradually narrowing the price range.
In this setup, the triangle has been forming since May 11, 2025, with a visible tightening of price action.
The chart shows well-respected upper and lower trendlines, confirmed with multiple touches on both sides.
🔼 Breakout Confirmation
A breakout occurred from the triangle's upper boundary around May 19, with a strong bullish candle closing above the structure.
Breakouts from symmetrical triangles often lead to sharp movements due to built-up pressure during the consolidation phase.
The volume typically expands at breakout zones (although volume is not displayed, price behavior implies it).
🔁 Retesting Area
Price may revisit the broken trendline (previous resistance → now support) for a retest before continuing higher.
This "retesting area" provides an ideal entry for those who missed the initial breakout.
Retests validate the breakout and confirm buyer strength.
🧱 2. Key Levels and Market Dynamics
🔻 Minor Resistance Zone (~1.13700–1.14100)
This zone has previously acted as a supply area where sellers pushed price down multiple times.
Price may hesitate or range within this area before breaking higher.
If bulls maintain control, breaking through this resistance zone will add confirmation to the bullish momentum.
📈 Target Projection: 1.14662
The target is derived by measuring the height of the triangle and projecting it from the breakout point.
It also aligns with a previous horizontal resistance level and psychological round number area.
This zone could act as a medium-term profit-taking level for swing traders.
🧠 3. Black Mind Curve – Market Psychology in Play
The "Black Mind Curve" is a representation of anticipated market sentiment and price flow.
It reflects a wave-like journey post-breakout — early breakout, pullback, bullish continuation, minor consolidation, and final push toward the target.
Such curves are used to forecast crowd behavior patterns, capturing how traders typically react post-breakout:
📌 Initial breakout ➜ Profit taking ➜ Retest ➜ Re-entry ➜ Final impulsive move.
🧮 4. Trading Strategy & Execution Plan
✅ Trade Setup
Entry:
Breakout Entry (already active)
OR Retest Entry near the triangle’s upper boundary for conservative traders.
Stop-Loss (SL) :
Placed just below the triangle’s lower boundary at 1.11726.
This level invalidates the breakout and prevents deeper drawdowns.
Take-Profit (TP):
Final target at 1.14662, offering excellent risk-to-reward potential.
📊 Risk-to-Reward Ratio:
Depending on the entry (breakout or retest), the RR can range from 1:2.5 to 1:3.5, which is ideal for swing or short-term position traders.
📚 5. Educational Insight
This pattern illustrates the importance of:
Price compression zones (triangles and wedges) as precursors to momentum trades.
Confirmation via breakout candles before entering high-conviction setups.
Patience during retests, which allow re-entries with defined risk and improved pricing.
Blending technical structure with psychological forecasting to stay aligned with market sentiment.
🔚 Conclusion
EUR/USD is showing a technically sound and psychologically supportive setup for bullish continuation. The symmetrical triangle has broken with strength, and price is heading toward key resistance with momentum.
If you're already long — consider holding until the target is hit or trailing stops to protect profits. If you're not in yet — watch for a retest to join the move with precision.
🔔 Always remember to manage risk effectively. No setup is guaranteed, but trading based on structure, confluence, and price behavior improves your edge

GJ-Mon-19/05/25 TDA-Possible scalp buy to 4hR 193.630Analysis done directly on the chart
Follow for more, possible live trades update!
Unless it's systematic approach to trading, all
manual execution trade come from some form
of price action trading. (different people call it
in different ways) If you have a different idea,
comment down below! Let's have a good discussion!
Not financial advice, DYOR.
Market Flow Strategy
Mister Y

BTCUSD Rectangle Pattern Breakout + Bearish Retest & Target🧩 Chart Overview
This chart captures a well-defined rectangle continuation pattern forming within a rising channel on the 1-hour timeframe. This setup is a classic combination of horizontal and diagonal price structure interaction, offering valuable insights into potential market behavior and trade opportunities.
🧱 Structure Breakdown
Rectangle Pattern: Price action was trapped in a sideways consolidation phase between the resistance zone (~104,800 - 105,400) and the support zone (~101,200 - 101,800).
This rectangle followed a strong bullish rally, which often implies a continuation pattern. However, the lack of follow-through from bulls near the resistance led to repeated failures to break out, suggesting weakening momentum.
Rising Channel: Within this rectangle, price respected a rising trendline support and resistance structure, forming a parallel ascending channel.
Bearish Breakout: The significant event occurred when BTC broke down below both the horizontal support of the rectangle and the lower boundary of the rising channel, triggering a structural shift from bullish to bearish.
🔁 Retesting Phase – What’s Happening Now
After the breakdown:
Price pulled back toward the prior support zone, which is now acting as resistance (a classic example of the support-turns-resistance principle).
This is commonly referred to as a retest, which validates the breakout and offers a lower-risk entry point for traders looking to short.
The retest area (around 101,500 - 102,000) is crucial. If price fails to reclaim this level and prints bearish confirmation (e.g., rejection wick, bearish engulfing candle), it increases the probability of downward continuation.
🎯 Trade Setup (Short Bias)
Entry Zone: 101,500 – 102,000 (on retest rejection confirmation)
Stop Loss: Above 103,000 (above prior highs and invalidation point)
Target 1 (TP1): 99,347 – key psychological and horizontal support level from prior structure
Target 2 (TP2): 97,277 – measured move of the rectangle height projected downward, aligning with previous demand area
This setup offers an attractive risk-to-reward ratio, assuming proper trade management and confirmation-based entry.
📊 Additional Technical Confluences
Bearish Momentum: The aggressive breakdown candle shows strong seller interest and increased volatility.
Volume: If confirmed with high selling volume during the breakdown and low buying volume during the retest, the move gains more credibility.
Trend Reversal Signals: The break of the channel and the rectangle support indicates potential trend reversal from short-term bullish to bearish.
RSI & Momentum Indicators (optional): Traders may use tools like RSI or MACD to confirm momentum shifts during retest.
📉 Psychological and Price-Level Significance
101,500 was a strong intraday support zone throughout the consolidation phase. Once broken, it flips polarity and acts as resistance.
The round-number level of 100,000 is always a psychological magnet for BTC. It often acts as a bounce or breakout zone, so traders should watch price behavior near this area closely.
Deeper demand may emerge around 97,000 – 96,500, which can serve as an extended target or reaccumulation zone depending on broader market conditions.
⚠️ Risk Management & Final Thoughts
This setup is high-probability only if the retest confirms rejection. Avoid early entries or assumptions before confirmation.
Always use proper stop-loss placement to avoid whipsaws or fake-outs.
Manage position sizing based on account size and risk tolerance.
News events or macro data can override technicals, so be aware of upcoming economic releases or sentiment shifts.
🧵 Conclusion
Bitcoin is showing clear signs of short-term weakness following the breakdown of a long-standing consolidation range within a rising channel. The ongoing retest provides an ideal area for short positioning, with clearly defined invalidation and profit targets.
✅ If bears defend the retest zone, expect downside continuation toward 99.3K and possibly 97.2K.

XAUUSD – Triangle Pattern Forming with Breakout PotentialThe price of Gold (XAU/USD) has recently gone through a structural shift, transitioning from a strong downtrend to a phase of market consolidation. This transition is clearly visible on the 1H chart where price has formed a symmetrical triangle, which generally signals price compression and often precedes a large breakout in either direction.
The most recent significant downtrend came to a halt near a well-identified support zone around the $3,157 level. This level aligns with previous reactions, and the price sharply rebounded from this demand area—indicating strong buyer interest and liquidity absorption.
Following this, the market has shown higher lows and lower highs, compressing into a tight range that is forming the triangle pattern.
📐 Technical Structure Breakdown:
🔸 Symmetrical Triangle Pattern
A classic consolidation pattern.
Formed by converging trendlines—one sloping down (resistance) and one sloping up (support).
This triangle signifies market indecision between buyers and sellers.
Volume is decreasing, which is typical in triangle formations and suggests a breakout is nearing.
🔸 Trendline Breakout & CHoCH (Change of Character)
The earlier bearish trendline was broken, indicating a change in the short-term trend bias.
The CHoCH label on the chart signals the point where bearish market structure was invalidated by a bullish rally, shifting momentum toward buyers.
🔸 Support Zone ($3,157)
This zone served as the springboard for the current bullish impulse.
Price wicked into this level multiple times and formed long lower shadows, confirming buyer absorption.
Acts as the last line of defense for bulls if price retraces after a fakeout or failed breakout.
🔸 Major Resistance Zone ($3,393)
This level is derived from historical supply, where sellers previously overwhelmed buyers.
Now identified as the target zone in case of a successful bullish breakout from the triangle.
A breakout above the triangle would likely trigger buy-side liquidity up to this resistance area.
🔄 Trade Scenario Planning
✅ Bullish Breakout Setup:
Entry: Above upper triangle boundary (aggressive) or after successful retest (conservative).
Confirmation: Break and close above triangle with volume.
Target: $3,393 (major resistance zone).
Stop Loss: Below last higher low inside triangle or breakout candle low.
Risk-to-Reward: Favorable if managed properly from triangle base.
❌ Bearish Breakdown Scenario:
Entry: Below triangle support trendline or upon hitting marked Sell Stop at ~$3,223.
Confirmation: Strong bearish candle closing below the triangle with rising volume.
Target: $3,157 support zone (first target), lower if momentum continues.
Stop Loss: Just above the breakdown candle or inside triangle top.
This provides a hedge setup if the market traps breakout buyers.
📉 Curve Zone & Parabolic Projection:
A curve zone has been drawn to simulate a potential parabolic move to the upside.
If price respects the curve, we might witness accelerated buying once the breakout confirms.
This is a visual guide to monitor momentum alignment with volume and RSI.
📊 Conclusion:
The market is currently in a compressed volatility phase within the triangle. Price is winding up and preparing for a large move. The setup provides a dual-opportunity strategy, allowing traders to position for either direction, depending on which side breaks first. Key levels of support and resistance are clearly defined, and risk can be tightly managed around the breakout points.
This triangle pattern, coupled with a prior CHoCH and clear curve trajectory, gives a strong technical bias for a bullish breakout, but always stay alert for fakeouts and liquidity grabs, especially before big economic news.
🔔 Trading Notes:
Watch for breakout volume and RSI divergence.
Avoid entering prematurely—confirmation is key.
Use alerts at breakout levels.
Be aware of fundamental catalysts (e.g., USD news, Fed decisions, geopolitical tensions).

Cup and Handle Breakout | Strong Trend Reversal in PlayNSE:PREMEXPLN
Analysis:
This chart showcases a classic "Cup and Handle" breakout pattern — a powerful bullish reversal setup. After a prolonged downtrend, the stock formed a rounded base, retested the neckline zone near ₹500, and broke out with strong momentum and volume.
Trendline Breakout: A long-term descending trendline has been broken, signaling a trend reversal.
Cup Formation: A smooth, rounded bottom formed over several months indicates accumulation and base-building.
Breakout Confirmation: A sharp breakout above the neckline resistance (around ₹500–₹510) with volume confirms the breakout.
Target Levels: Price has already moved toward ₹606 and is now approaching ₹678 — the measured move target from the depth of the cup.
Trade Setup:
Entry: Ideal entry was near breakout of ₹510.
Targets: ₹606 (hit), ₹678 (approaching).
Stop-loss: Below ₹500 or trailing below recent swing lows for momentum trades.
Outlook:
The chart signals a strong reversal and momentum continuation. If ₹678 is broken, further upside potential opens up.
HAPPY TRADING !!

CADCHF Update | ~150pipsSimilar to USDCHF price broke below a major range and is now pulling back towards the latest breakout zone.
Bulls are looking strong after securing the lower support level and we could see about 150pips as price action looks for targets around 0.61000.

USDCHF Update | ~200pipsSince the last post USDCHF sold off towards the demand zone and broke below support. Price is now pulling back towards the mid channel of the range where bulls will be tested again.
For now price looks bullish but could see another selloff later down the road.

Nasdaq – Fair Value Gap (FVG) in Play: Breakout or Rejection?US100 is going up and reaching a critical inflection point, the Daily Fair Value Gap (FVG) between 21,500 and 21,700.
This FVG is not just any level; it’s the last inefficiency left by aggressive sellers, and the market is now deciding whether to reclaim or reject it.
Key Zones
- Daily FVG (Supply): 21,400 – 21,600
- Major Resistance: 22,400
Trade Scenarios
Bullish Continuation
A clean daily close above 21,600 confirms FVG reclamation.
Could trigger a momentum burst toward 22,250.
Ideal play: wait for consolidation above 21,700 or breakout-retest setup.
Bearish Rejection
Rejection from the FVG could lead to a retracement toward 20,300, where demand and a lower imbalance reside.
Look for rejection in the FVG zone.
Technical Takeaways
The FVG at 21,400–21,600 is acting as both a magnet and a battlefield expect volatility.
The impulsive move leading here lacks a clear retest, which may increase the probability of a short-term correction.
Momentum is strong, but traders should wait for confirmation not emotion.
Summary
The Nasdaq 100 is knocking on a daily FVG door and what happens next will set the tone for the coming weeks.
Above 21,600 = bull trend continuation
Rejection = short-term dip to 20,300 possible
What's your take, breakout or rejection?
Follow for real-time trade updates and educational charts.

JPY/USD Breakout from Curve Line – Targeting Upper Resistance JPY/USD presents a classic curve bottom formation, which is a powerful technical structure indicating accumulation by smart money. It’s supported by key price action behaviors like support/resistance flips, retesting confirmation, and a well-defined target zone.
Let’s break it down piece by piece.
📉 1. Curve Formation – Accumulation Phase
The most noticeable element here is the parabolic (curve) structure formed between October 2024 and March 2025. This kind of structure often reflects a slow accumulation process:
Price dips over several months form a rounded bottom — also called a saucer pattern.
This shows institutional players are quietly accumulating, while retail traders are often trapped in sell-side positions.
As the curve matures, the volume and momentum begin to shift, signaling the beginning of a bullish breakout.
This accumulation curve is bullish by nature and becomes even more potent when followed by a breakout and retest.
🔄 2. SR Flip Zone (Support-Resistance Interchange)
One of the most critical concepts in price action is the SR flip — where old resistance turns into new support. In this case:
The yellow-shaded zone previously acted as resistance — confirmed by multiple rejections.
After the breakout, this same zone is being retested as support — a healthy technical confirmation that the market has accepted higher prices.
This flip zone is a launchpad for continuation to the upside.
📍 3. Retest Confirmation – Smart Entry Opportunity
Zooming into recent price action:
The market pulled back cleanly into the SR zone and the curve line.
The confluence of horizontal support and the curved trendline makes this an extremely strong retest zone.
Buyers stepped in with force, suggesting that demand is active at this level.
This retest is where risk-to-reward is optimized. The ideal entries usually happen when price confirms structure after a breakout — not before.
🎯 4. Target Zone – Next Bullish Objective
The next logical target is shown in the blue box above (~0.00705–0.00710). Here's why this zone is important:
It marks a previous supply/resistance area.
It aligns with psychological round numbers and past consolidation.
A measured move from the bottom of the curve also aligns with this target.
In essence, it is the profit-taking zone where the market is likely to pause or reverse temporarily.
🔎 5. Insider Supply & Central Zone – Institutional Traces
The chart labels an “Insider Supply” area at the base of the curve. This implies:
Hidden accumulation likely occurred at this level.
Institutions tend to trap retail sellers during these periods with false breakdowns.
Once they’ve loaded up, price shifts upward in a controlled fashion — exactly what has happened here.
The Central Zone is the battlefield — the area where prior indecision took place, which has now turned into a stepping stone for upward movement.
💡 Strategy Recap:
Parameter Value
Entry Retest of SR Flip (0.00680–0.00685)
Stop Loss Below curve base (~0.00670 or lower)
Target 0.00705–0.00710
R/R Ratio 1:2 or better
This strategy is technically sound, supported by structure, and has strong reward potential.
🧠 Market Psychology:
Smart money accumulates when price is quiet and sentiment is bearish.
After accumulation, a controlled markup begins, with retests engineered to confirm the breakout.
Retail traders tend to enter late or get faked out — while institutions already hold positions.
This chart is a textbook example of how professional traders operate and manage structure-based risk.
🏁 Final Thoughts:
This is a high-probability technical setup built on multiple layers of confluence:
Curve structure
SR flip
Demand zone retest
Momentum shift
If momentum continues, the 0.00710 zone is a very realistic short-term target. Traders should manage risk tightly and monitor price behavior near the upper resistance box.

XAUUSD Double Top Breakdown & Target – Bearish Reversal in Play?In today’s analysis, we focus on Silver (XAG/USD) on the daily timeframe, which is currently presenting a high-probability bearish reversal setup. The price action has completed a Double Top pattern — a classic reversal formation — and has broken down below its neckline support, signaling a potential shift in momentum from bullish to bearish.
This chart setup is particularly valuable for swing traders, pattern traders, and anyone seeking to anticipate mid-term directional moves in the commodities market.
📐 Technical Breakdown:
🔷 1. Double Top Formation:
The Double Top pattern forms after a sustained uptrend and is identified by two peaks at nearly the same level.
In this case:
Top 1 formed near $35.5.
Top 2 retested the same zone but failed to break above.
The neckline support — drawn across the $28 zone — was eventually broken.
This price action confirms the classic M-shaped structure, signaling distribution and potential bearish continuation.
🔷 2. Neckline and Breakdown:
After failing at Top 2, price dropped below the neckline, breaking critical horizontal support.
This move completed the pattern, triggering many technical sell signals.
Price is now retesting the neckline zone, a common phenomenon where broken support becomes resistance (known as a "retest").
This retest offers a textbook short opportunity if bearish confirmation follows.
🔷 3. Curve Resistance:
The upper curved blue line represents dynamic resistance.
It has successfully capped price action across multiple attempts and aligns with the pattern's second top — enhancing the strength of this rejection area.
🧱 Support & Resistance Zones:
Resistance Zone: $34.50–$35.50
Strong resistance from both peaks (Top 1 & Top 2) and historical sellers.
Neckline / Retest Zone: ~$28.00
Now acting as resistance — this is the critical level to watch for rejection or breakout.
Support Zones / Take-Profit Levels:
TP1: ~$26.40 — aligns with recent horizontal structure and minor support.
TP2: ~$22.58 — matches major historical support and measured move projection from the Double Top pattern.
📉 Measured Move Target (Pattern Projection):
To calculate the target from a Double Top:
Measure the height from top to neckline.
Project that downward from the neckline’s breakout point.
In this case:
Height: ~$35.5 – $28 = $7.5
Breakdown point: $28 – $7.5 = Target near $20.5–22.5
The TP2 at $22.58 matches this logic — further validating the downside potential.
🔄 Market Psychology & Sentiment:
This pattern reflects a shift in sentiment:
Bulls tried and failed twice to push through resistance.
The eventual breakdown shows bearish conviction, and the ongoing retest represents a decision point.
If sellers hold this level, we could see a cascade of downside pressure as stops are triggered and momentum builds.
🛠️ Trade Setup & Scenarios:
📌 Scenario 1 – Bearish Continuation (High Probability):
If price fails to reclaim the neckline (now resistance) and forms bearish confirmation (e.g., engulfing candle, rejection wick, breakdown below $31), this confirms a likely move toward TP1 and TP2.
Entry Idea: Short on rejection from the $28–$29 zone
Stop-Loss: Above $30
TP1: $26.40
TP2: $22.58
📌 Scenario 2 – Invalidated Pattern:
If bulls push price back above the neckline ($29–$30 zone) with strong volume and daily close, this invalidates the setup and may lead to:
Bullish continuation toward $32–$34
Possible trend resumption if curve resistance breaks
🧠 Educational Notes:
Double Tops are most reliable when:
Formed at the top of strong uptrends.
Followed by a neckline break with volume.
Retested with rejection.
The retest phase is often the best risk/reward entry because:
It confirms resistance.
Offers clear invalidation levels.
Keeps your stop tight while targeting deeper moves.
📢 Final Thoughts:
Silver is currently at a critical technical juncture. The Double Top breakdown has played out, and now all eyes are on the retest. If bears defend the neckline, this setup provides a strong case for continued downside, offering a clean structure with well-defined targets.
⚠️ Risk Management is crucial — always manage your position size and respect invalidation zones.

BTCUSD - Bullish Breakout from Falling Wedge Pattern | Target Bitcoin has broken out of a Falling Wedge Pattern on the daily timeframe, signaling a bullish reversal that aligns with the broader market sentiment. Let’s examine this setup in detail, from pattern recognition to key support/resistance levels and trade planning.
🧠 Pattern Analysis – Falling Wedge Formation
The chart displays a textbook Falling Wedge, which is a bullish chart pattern that typically forms after a downtrend. It’s characterized by converging trendlines sloping downward, showing a slowdown in bearish momentum and a potential reversal point.
Formation Period: This wedge developed over a multi-week period (Feb–April 2025).
Structure: Each swing high and swing low forms lower highs and lower lows inside the wedge.
Breakout Confirmation: Price has decisively broken above the upper trendline of the wedge, validating a potential bullish continuation.
👉 Falling Wedge patterns are often seen near the end of a corrective move and suggest accumulation before a rally.
🔎 Key Technical Zones
🔸 Resistance Zone (~$103K–$105K)
This area has historically acted as a strong resistance zone.
Price is currently consolidating just below this region, indicating a possible breakout retest or a temporary pause before the next leg up.
🔸 Trendline Support
A new rising trendline has emerged post-breakout, acting as dynamic support.
Price has respected this trendline multiple times, forming higher highs and higher lows — a strong bullish signal.
🔸 SR Interchange Zone (~ GETTEX:92K –$94K)
Previously acted as resistance; now flipped to support.
This makes it a critical level where bulls may defend positions, and a good place for a stop-loss.
🔸 Support Zone (~$75K–$78K)
Major historical support area where the wedge bottom formed.
Buyers stepped in aggressively in this zone during the final leg of the wedge.
🎯 Trade Plan
This setup offers a clearly defined risk-reward profile based on breakout trading principles.
📌 Entry Idea:
Current consolidation near resistance offers two entry strategies:
Aggressive Entry: Near current price, anticipating breakout continuation.
Conservative Entry: On a confirmed breakout above $105K or a pullback to trendline support around GETTEX:98K –$100K.
✅ Target: $112,116
Measured by projecting the height of the wedge from the breakout point.
Also aligns with a previous key structural high, adding confluence to the target.
⛔ Stop Loss: $93,294
Strategically placed just below the SR interchange zone and rising trendline.
Protects against potential fakeouts or trendline breaks.
📉 Risk Management
Risk/Reward Ratio: ~2:1 or higher depending on entry point.
Always use proper position sizing.
Be prepared to cut the trade if price closes below trendline and SR zone on high volume.
🔮 Outlook and Strategy
This breakout suggests Bitcoin may be entering a renewed bullish phase. If macro conditions remain favorable and price sustains above key support zones, we could see continuation toward the $112K region.
However, it’s important to monitor:
Volume: Watch for rising volume on any breakout above the resistance zone.
Market Sentiment: External factors (e.g., news, ETF flows, regulatory updates) may influence the move.
Trendline behavior: A break and close below the rising support line may invalidate the setup.
💬 Final Thoughts
This is a technically clean setup combining a bullish pattern breakout, supportive structure (trendline & SR zones), and a logical target based on classical charting. If Bitcoin maintains current momentum, traders may see significant upside in the coming weeks.

#202520 - priceactiontds - weekly update - dax futuresGood Day and I hope you are well.
comment: We are only about 300 points higher than the previous week but market printed the obvious big round number and Friday we had the retest, which did not quite get there but close is always close enough. We are seeing somewhat of an increase in selling pressure but it’s not enough.
current market cycle: trading range and very broad bull channel on the weekly time frame
key levels for next week: 23000 - 24000
bull case: Best for bulls would be to go sideways and not let market fall below 23400. That’s pretty much all I can come up with for the bulls. Can we go much above 24000? We can but I can not see it happening. If we go higher, it will be without me. I am only interested in seeing an increase in selling pressure and looking for a good short entry. I give bulls 2-3 more days in trying to print 24000 again and if they fail 1-2 more times, they will give up and we can test back down to 23000. It would still be the most bullish outcome if we continue to range between 23000 and 24000.
Invalidation is below 22900.
bear case: I only want to short this but bears are not doing enough for me to consider it. I hate being early because it correlates big time with being wrong. My line in the sand would be a daily close below 23000 and the daily 20ema. Until bears get that, odds heavily favor the bulls to buy any pullback. So for now, not much to do as a bear. For this year I still expect at least 20000 to get hit again. So if you would force me to give an answer, I would short this with a stop 24600 and wait until we hit 20000 again. If we go into a recession, I would likely hold for lower.
Invalidation is above 24100.
short term: Neutral. I wait for clear topping signals and more selling pressure. Long scalps against support if bulls want 24000. Same as last week.
medium-long term from 2025-05-11: So here is my very rough guess about the next months. This short squeeze is clearly overdone and global macro stuff has most likely already deteriorated a great deal. Down to 20000 over the next weeks/months and form a big trading range. Up through October-Year end. Zero thought about a new bull trend above 24000. We most likely have not seen the lows for either 2025 or 2026. Good question is always, “How would you allocate 100k right now?” 50% short dax, 25% of it levered/options and with the rest I would scalp.

#202520 - priceactiontds - weekly update - nasdaq e-mini futures
Good Day and I hope you are well.
comment: The bulls gapped up on Monday’s Globex open and we never looked back. My line in the sand was 20536 and we are now about 1000 points higher. The rally is climactic in a very tight bull channel and those are always unsustainable. We are close to the ath to expect a new one or a retest but I doubt we can get there without at least a couple of days sideways to down movement. If we continue higher from 21500, it will go without me because I don’t think this is a good trade. Bulls should not let the market fall below 20800ish or the trend line breaks and that would decrease the odds of a new ath somewhat. Even if I expect a pullback, I doubt bears will get something big going next week. The rally is too strong to not expect the next pullback to get bought. The only chance bears have to reverse would be a news event and trading on hope is never a good strategy.
current market cycle: trading range
key levels for next week: 20000 - 22000
bull case: 22000 is the next obvious target for the bulls but I doubt we can get there without some sideways to down movement first. If we print 22000 next week, there is no reason we can’t go for 22500 as well. Bulls have all the arguments on their side right now and the bull channel is clear, so trade it until it is clearly broken.
Invalidation is below 19100.
bear case: Very small chance my wave count is correct and we have seen the high of this move. The two-legged correction with a higher high is the best guess I have for now but I would not initiate trades based on that right now. It helps with expectations but not more. Base assumption is a pullback, more upside and then a stronger reversal over the summer and Q2. As of now, bears have absolutely nothing going for them and you can only think about shorts if you are comfortable with holding through 23300ish because that’s how high I can potentially see it going. I fully expect 19000 to get hit again this year but for now this market is as bullish as it gets.
Invalidation is above 21600.
short term: Neutral. Expecting a pullback and that will likely be another good long opportunity if nothing changes dramatically. 22000 is the obvious next target. If we get real bad news, we could see a bigger pullback but even then I would expect at least a retest of 21500.
medium-long term - Update from 2024-05-11: My most bearish target for 2025 was 17500ish. Now I assume we will be in a trading range 16000 - 23000 for much longer. Same update as for dax, I guess we could go down and sideways over the next weeks/months and then have another squeeze into year end. Stairs up, elevator down.

#202520 - priceactiontds - weekly update - wti crude oil futuresGood Day and I hope you are well.
comment: I think buying that weekly time frame double bottom below 55 makes sense. Bulls are trying to print 64+ again and hit the weekly 20ema around 64.5ish. I favor the bulls to get to the upper bear wedge trend line a bit higher around 66ish and there market will decide if we continue further in it. The structure has a lot more room, so I don’t think bulls can get much more than that. We are in a bear wedge inside a broad bear channel. Making money as a bear is just easier, that is why I don’t expect too much from the bulls.
current market cycle: monthly time frame is a broad bear channel - weekly tf is a bear wedge - daily is a trading range
key levels: 59 - 65
bull case: Bulls trying to make last week’s low a credible higher low and test up to the bear wedge trend line around 64.5 - 65. If we stay above 59.5ish, I favor the bulls. Below that price it get’s neutral again and I would see the odds of 55 the same as for 65.
Invalidation is below 59.
bear case: Bulls are trying to keep the market above the daily 20ema and form a two-legged pullback at the moving average, which is a buy signal if they get a good signal bar the next 1-3 days. Bears can invalidate it, if they break below 59 and get follow-through below it. It is technically slightly more likely that we continue sideways inside the given range, like we did the past 5 weeks. Structure is neutral, so if bears want to reverse from above 60, they need to print a decent sell signal on Monday/Tuesday.
Invalidation is above 64.4
short term: Neutral and will lean towards the side that can print the next decent bull/bear day. Bulls can go up to 65 and bears could trade back down to 55 if we go below 59 again. Only a big bull surprise could get us above the closest next bear trend line and prices above 66.
medium-long term - Update from 2025-05-11: 3 legs down on the weekly chart and market has printed a credible bottom around 55. I think we can test back to 65 over the next weeks.

#202520 - priceactiontds - weekly update - bitcoinGood Day and I hope you are well.
comment: Can’t be anything but bullish. Nothing changed so this bias did not change either. Bulls were so strong that we have corrected sideways in a tight range for 9 days now and if bears can’t even print one decent bear bar after such a rally, bears are doing absolutely nothing and the correction is mostly from bulls taking profits. We can only expect higher prices until bears come around with much bigger selling pressure. Targets above are obvious, new ath above 109396 and then the big bull trend line around 113000.
current market cycle: weekly time frame is in a bull trend inside a big bull wedge - daily time frame is in a tight bull channel
key levels: 95k - 115k
bull case: Upside will likely be limited to something below 120000 but bulls are in full control until we print below a higher low again. Bulls want 110000 and then some. It’s a clear bull wedge and longs above 100000 are tough because stop has to be at least 97000. Market has moved sideways enough to expect another leg up any day now.
Invalidation is below 97000.
bear case: Bears can only have hope that we will still find no acceptance above 100000 on the weekly & monthly time frames and once we get the spike to 110000 we will turn again. I printed the monthly chart because it shows the tails above 100000 and that we are in the retest of the previous ath, which is the same structure as we did in 2021. As of now, bears have nothing going for them until we actually turn again. I still heavily favor the bears to print below 80000 this year but right now you should not look for shorts.
Invalidation is above 112000.
short term: Bullish but buying at the very top is tough. Any long 100000 or 98000 is likely good, if it’s not during a crazy strong bear spike. New ath or something close is expected.
medium-long term - Update from 2025-05-11: I expect a trading range 700000 - 100000 for longer. The current move above 100000 I see as a retest of the ath and it could overshoot but I doubt market can find acceptance there for longer. Only interested in shorts on anything above the 1h time frame.

USOIL Weekly Analysis – Major Breakdown and Retest in PlayAfter several months of holding firm, USOIL has finally broken below its key support zone around $67–$70, which had acted as a floor since mid-2021 . This is a significant technical development, and the current price action is showing a classic bearish retest of that broken structure.
Technical Breakdown:
Support Broken:
The $67–$70 zone was tested multiple times over the past 2 years. Price has now cleanly broken through it and is struggling to reclaim it.
Retest in Progress:
Price is currently hovering around $62.36 and failing to push back above the broken support. This retest is textbook and could confirm further downside.
Market Structure:
Lower highs and lower lows dominate the weekly chart = clear bearish trend.
Bearish Targets:
Target 1: $53.50 – Previous minor demand zone from 2021.
Target 2: $41.50 – Strong historical support and potential major bounce area.
Invalidation Zone:
If price closes above $70 on the weekly chart, the breakdown would be invalidated and we’ll reconsider our bias.
Confluence:
Broken multi-year support
Bearish retest on weekly timeframe
Clear downside liquidity below
Summary:
Bias: Bearish
Setup: Short on confirmation of rejection below $67
Timeframe: Weekly / Daily
This is a high-probability setup if the rejection continues. Look for further bearish price action on the daily or 4H chart for refined entries. As always, manage risk carefully .
Like & Follow for more clean, high-timeframe breakdowns!

Gold Just Grabbed Liquidity Below a Key LowGold reacted sharply at a major structural level last week, sweeping liquidity below the previous weekly swing low. That move was immediately followed by a strong bullish rejection candle with a deep lower wick — signaling aggressive buyer absorption.
The price also respected a long-term ascending trendline, which has acted as dynamic support since early March. Two demand zones are clearly identified on the chart (based on HTF imbalances and previous accumulation ranges), and price tapped the upper zone near 3,160 before bouncing.
The bullish structure remains intact unless price closes below 3,080 on the weekly. Until then, the trendline and recent liquidity grab favor further upside continuation.
📉 COT Data Insight
Gold Non-Commercials:
Net long remains strong (238k long vs 76k short)
New long contracts: +746 | Shorts: +2,034
However, a large drop in spread positions (-12,424) signals a tactical unwind in hedge fund exposure
USD Index (DXY) Non-Commercials:
Net long positions down significantly (-5,712)
Softening dollar bias adds tailwind for gold in the short term
🧠 COT Takeaway
Speculative interest continues to favor Gold, while USD positioning weakens — supporting the idea of a technical bounce and potential bullish continuation.
🧮 Retail Sentiment (Contrarian View)
Retail traders are currently 54% short on XAU/USD — classic contrarian signal suggesting the path of least resistance remains to the upside.
📆 Seasonal Outlook (May Performance)
Historically, May tends to be a neutral-to-weak month for gold based on 10- to 15-year data.
However, in the last 2 years, May has delivered clear bullish seasonality, which reinforces the case for upward momentum after pullbacks.
✅ Summary
🔸 Directional Bias: Moderately Bullish
🔸 Invalid if: Weekly close < 3,080
🎯 First Target: 3,280 – 3,320
🎯 Extended Target: 3,440 resistance zone
📌 Final Thoughts
The technical reaction from demand, supportive COT structure, soft USD positioning, and contrarian sentiment all point toward potential continuation higher.
As long as Gold holds above the 3,080 zone, the bulls remain in control.
