UPL , 1W , Weekly Bullish As the UPL pattern is looking very Good and Giving Breakout and Enter only after the Close of Weekly time frame .
follow your risk Management , proper Position Sizing
Priceaction

Gold (XAUUSD) – July 4: Structure Shift & Short BiasYesterday’s price action (July 3) delivered a crucial structure break that changes our short-term trading outlook.
We were expecting a bullish continuation with a clean break above the 3365 M15 swing high .
Price reached as high as 3364, but failed to break the high — showing early signs of exhaustion.
Then came the PMI news release, triggering a sharp drop that broke the M15 Higher Low and shifted structure.
🔻 Structure Has Shifted
As of today, July 4, the intraday market structure has flipped from bullish to bearish.
✅ M15 trend: Now in a confirmed downtrend
✅ H4 trend: Entering a pullback phase
❌ Previous bullish continuation setup is invalidated
We now adjust our approach to align with the new structure — not the old expectation.
📉 Updated Bias: Short
With M15 and H4 now aligned in pullback, our active bias is bearish.
This means:
• We are not planning any long trades until structure shifts back
• Focus shifts to short setups only, executed with discipline
🔍 Intraday Short Setup Plan – July 4
We are watching for price to retrace into valid M15 POI zones before resuming the downtrend.
🔸 First zone to watch:
• 3348–3352 → M15 POI with strong probability for rejection
🔹 Execution Rule:
→ If price enters this zone
→ And we see M1 confirmation (ChoCh + micro BoS)
→ We will plan a short entry, with structure-based SL and minimum 1:3 RR
🎯 Downside Levels Ahead:
If bearish momentum continues, the next potential reversal/support zone is:
📍 3280–3285
→ This will be a key area to observe for signs of exhaustion or base formation
→ Until then, trend remains valid to the downside
🧭 Final Thoughts:
This shift from bullish to bearish bias is a textbook example of why we follow structure — not predictions .
The market gave a clean BoS at 3358, but failed to follow through.
Instead of forcing the long, we’ve now flipped bias in line with the chart’s reflection.
📖 Let the chart guide your thinking.
Structure reveals the direction.
Confirmation controls the execution.
The chart is the mirror.
📘 Shared by @ChartIsMirror
Author of The Chart Is the Mirror: Mastering Gold with Structure, Stillness, and Price Action

2025-07-03 - priceactiontds - daily update - daxGood Evening and I hope you are well.
comment: On my weekly chart I think this W4 was too deep to be part of a strong bull trend. 24000 is a decent spot to go sideways rather than up but above 24100 means I’m likely wrong and bears could give up for 24500+. I would not look for shorts until we see better selling pressure again. The Globex spike from 23681 to 23963 was beyond weird. It’s a bull wedge but will likely break out sideways in Globex session. 50/50 for both sides I think.
current market cycle: unclear. bull trend could continue but trading range is most likely
key levels: 23600 - 24500
bull case: Bulls want a retest of 24500+ but they find no buyers around 24000. They tried so many times to print 24000 and today they finally did it again but they would need to stay above 23900 and go sideways until bears give up. Markets can poke at a price long enough until one sides gives up.
Invalidation is below 23860.
bear case: Bears need lower lows again and if they can get below 23860, many bulls could cover in fear of a bigger pullback down to 23700. As of now bears have zero arguments since we only made higher lows since Globex low but we are also barely making higher highs and if we do, they have tails above.
Invalidation is above 24100.
short term: Completely neutral. Can go both way. US markets are overbought and once the profit taking starts, Dax won’t hold up either. Not much interest in guessing which way we go from 24000. Best to sit on hands and wait for a clear and strong signal.
medium-long term from 2025-06-29: Bull surprise last week but my targets for the second half of 2025 remain the same. I still expect at least 21000 to get hit again this year. As of now, bulls are favored until we drop below 23000
trade of the day: Longs since the giant Globex bull spike but had to have wide stops and scale in. Not an easy day.

Dow’s fighting hard for that breakoutDow Jones is moving within a bullish channel
with low selling pressure —
strong legs pushing toward the top.
I’m expecting another solid bullish leg.
BLACKBULL:US30

XAU/USD Potential Head & Shoulders Pattern FormingXAU/USD - Potential Head & Shoulders Pattern Forming 🔍
A possible Head and Shoulders pattern is taking shape on the 2H chart. With the right shoulder now forming and price nearing resistance, this setup could indicate a short opportunity.
🎯 Short Target: 3,304
🛑 Stop Out: 3,370
This setup offers a clean risk-to-reward ratio. Let’s see how price reacts in the coming hours!
💬 Drop your thoughts in the comments – do you agree with this setup? Let's support each other with ideas!
👍 Don’t forget to like and share if you find this helpful – your support means a lot!

PRZ at 0.6600? | Watching for Reversal from Channel Top👆🚀Boost it if you like it... (Thank you) 🚀👆
Pair: AUD/USD Timeframe: 4H Bias: Short-term bearish Custom Term: PRZ (Possible Reversal Zone) = 0.65696
📈 Technical Structure:
AUD/USD is trading within a well-respected ascending channel, with price currently hovering near 0.6570. The upper boundary of the channel aligns closely with the PRP zone at 0.6600, which also coincides with:
A prior supply zone (visible on higher timeframes).
Confluence of the 15 EMA (0.65692) and 60 EMA (0.65534) flattening out.
Psychological round number resistance.
Entry: 0.65700
Stop: Above 0.66064 (channel breakout invalidation)
Target 1: 0.6540
Target 2: 0.6500
Risk/Reward: ~1.8
(Warning: This is an early entry )
🧠 Psychology Insight:
The PRP concept helps frame trades around areas of emotional overextension—where traders may overcommit to a breakout. By identifying these zones in advance, you stay objective and avoid reactive decisions.
PRZ: Possible Reversal Zone
#AUDUSD #PRZ #Forex #TechnicalAnalysis #ChannelTrading #ReversalZone #PriceAction #MJFX #TradingPsychology #ToughButSuccessful

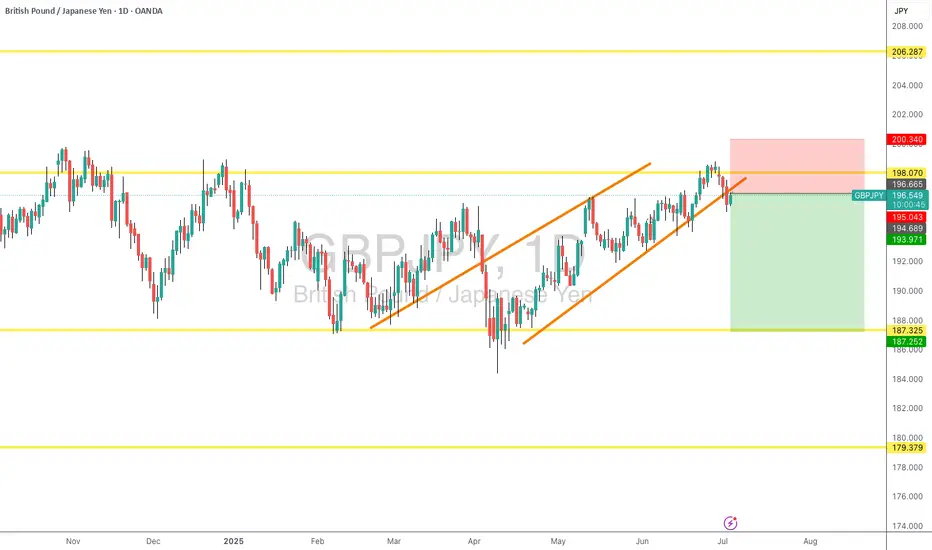
GBP/JPY SELL SETUP - Range Resistance RejectionGBPJPY is showing classic range-bound behavior with a clear rejection setup at key resistance.
📊 Market Analysis
Timeframe: Daily
Bias: Bearish (within established range)
Pattern: Range-bound market with resistance rejection
🎯 Trade Setup
Entry: 196.400 - 196.800 (on rejection candles)
Stop Loss: 199.200 (above range high)
Take Profit 1: 192.500 (mid-range)
Take Profit 2: 189.500 (range support)
📈 Technical Reasons
✅ Multiple rejections at 198.480 resistance level
✅ Range-bound market structure intact
✅ Bearish rejection candle formation
✅ Risk-reward ratio 1:2 to 1:3
🔍 Key Levels
Resistance: 198.480 (range top)
Support: 189.365 (range bottom)
Invalidation: Break above 199.200
⚠️ Risk Management
Position size: 1-2% of account
Watch for any break above resistance with volume
Weekly bias remains bullish - be ready to exit if range breaks up
💡 Trade Plan
Looking for price to respect the established range and move back toward support levels. This is a counter-trend trade within the range structure.
Remember: Trade your plan, plan your trade. Always manage risk first!
GBPUSD LongLooking to the upside got BoS pull back into FVG with the second retest. Looking for the bullish extension to the upside.

03.07.25 Morning ForecastPairs on Watch -
FX:EURUSD
OANDA:XPTUSD
FX:CADJPY
PEPPERSTONE:HK50
A short overview of the instruments I am looking at for today, multi-timeframe analysis down to what I will be looking at for an entry. Enjoy!

GU-Thu-03/07/25 TDA-UK political turmoil triggers market selloffAnalysis done directly on the chart
Follow for more, possible live trades update!
I often share my live trades in Tradingview public chat in London session, stay tuned!
I don't give signals blindly, people should learn
and understand the skill.
Following blindly signals you won't know how to
manage the trade, lot size and replicate the move
over time.
That's why you need active real time discussions.
Trading is not get rich quick scheme!
Active in London session!
Not financial advice, DYOR.
Market Flow Strategy
Mister Y

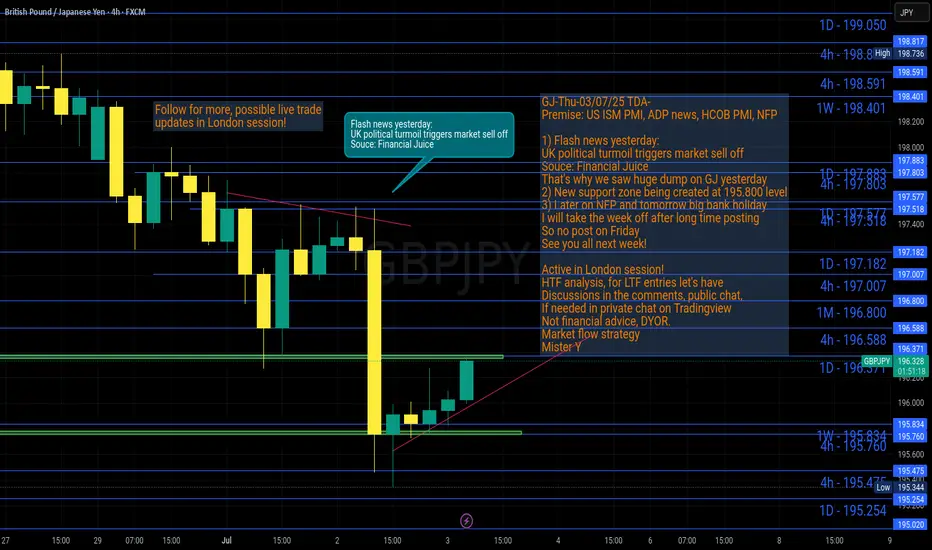
GJ-Thu-03/07/25 TDA-UK political turmoil triggers market selloffAnalysis done directly on the chart
Follow for more, possible live trades update!
I often share my live trades in Tradingview public chat in London session, stay tuned!
I don't give signals blindly, people should learn
and understand the skill.
Following blindly signals you won't know how to
manage the trade, lot size and replicate the move
over time.
That's why you need active real time discussions.
Trading is not get rich quick scheme!
Active in London session!
Not financial advice, DYOR.
Market Flow Strategy
Mister Y
GBPAUD - Trading The Range!Hello TradingView Family / Fellow Traders. This is Richard, also known as theSignalyst.
📈GA has been hovering within a big range.
This week, GA is retesting the upper bound of the range acting as a resistance.
As long as the resistance holds, we will be looking for shorts on lower timeframes, targeting the lower bound of the range.
📚 Always follow your trading plan regarding entry, risk management, and trade management.
Good luck!
All Strategies Are Good; If Managed Properly!
~Rich
Disclosure: I am part of Trade Nation's Influencer program and receive a monthly fee for using their TradingView charts in my analysis.

XAUUSD – July 3 Live Setup | Price at M15 POIGold has been moving in line with our bullish bias over the past few sessions.
Yesterday’s break above the 3358 M15 level gave us a clean Break of Structure (BoS) — confirming short-term bullish momentum within the larger framework.
After this strong push upward, the market is now retracing.
Price is currently entering a high-probability pullback zone: 3340–3342 (M15 POI).
This is a textbook base structure setup — where we wait for price to return to a valid zone after structure shift, and only act after confirmation on the lower timeframe.
🔍 Setup in Play:
Current Bias:
• M15 Trend: Bullish
• H4 Context: Bullish (after recent HTF shift)
• Market State: Pullback phase after BoS
Key Zone in Focus:
• 3340–3342 – M15 POI (zone of interest for continuation)
We are not entering blindly .
We are waiting for confirmation on M1 — specifically:
✅ ChoCh (Change of Character)
✅ Followed by a micro BoS
Only then do we consider a long entry — and even then, risk must be managed through proper R:R and structure anchoring.
🎯 Target:
If M1 confirmation occurs, the expected short-term target is 3365 — the next clean M15 structural high.
⚠️ Risk Conditions:
If price breaks below the POI without M1 confirmation — or aggressively violates the zone — the setup is invalid.
In that case, we simply step aside and reassess.
This is process-driven execution:
No need to predict.
No need to chase.
Just observe, confirm, and execute with structure.
📖 This is how we let the chart do the work.
The process protects us.
Structure invites us.
Stillness refines us.
📘 Shared by @ChartIsMirror
Author of The Chart Is The Mirror — a structure-first, mindset-grounded book for traders

#XAU/USD SELL TRADE SETUP [SHORT]In this analysis we're focusing on 2H timeframe. As we know, Gold is moving in a strong bearish trend. The best selling zone is 3295 - 3305 key levels area. If gold encounters rejection from this zone, we can anticipate a potential decline in price towards its targeted levels.
Target 1:3260
Target 2:3250
Target 3:3240
Wait for a retracement to sell with strong confirmation and proper risk management.
#GOLD 2H Technical Analysis Expected Move.

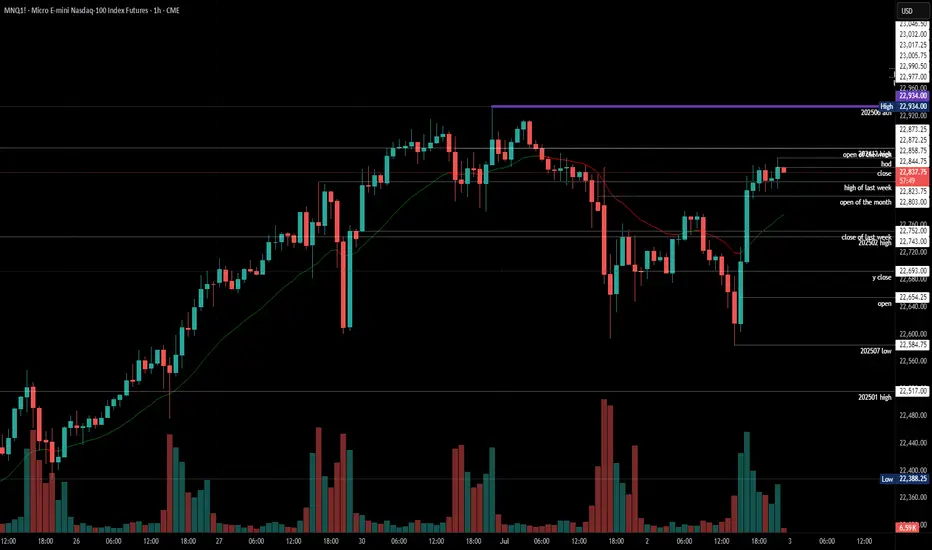
2025-07-02 - priceactiontds - daily update - nasdaqGood Evening and I hope you are well.
comment: Big down, big up. Clear trading range. Play it until broken.
current market cycle: bull trend on higher tf but trading range on the 1h tf
key levels: 22500 - 23000
bull case: Bulls want 23000. Nothing changed. Bulls buy every dip below 22670 and until that stops, we stay at the highs and chances of higher prices are greater than a deeper pullback. I have no targets above 23000 though.
Invalidation is below 22500.
bear case: Bears not doing enough and have to scalp out or their profits disappear. They need a strong 1h close below 22500 for more downside but for now markets are continuing to ignore every bad news and the structure is as bullish as it gets on the daily tf. Bears are barely making money, so try to look for easy longs.
Invalidation is above 23200.
short term: Neutral but I still expect 23000 to get hit and maybe some more squeeze above. Zero interest in shorts and longs only for scalps and small. It’s still overbought and a deeper pullback is expected over the next days.
medium-long term - Update from 2024-06-29: No change in plans. I expect 20000 to get hit over the next 3 months and maybe 19000 again.
trade of the day: Longs below 22670 have been amazing since Friday.
Swing Pick +92% in 2 days $1.06 to $2.04Buy message on Friday before market close at $1.06 reaching $2.04 just 2 days later for +92% upside.
Trade had tight stop loss at $0.90 while going for at least +50% gain
NASDAQ:VOR
DESTINI - MARK UP PHASE STARTS ?DESTINI - CURRENT PRICE : RM0.400
DESTINI broke above resistance on 12 JUNE 2025 with burst in trading activity. It was the BREAKOUT of ACCUMULATION PHASE and 52 Week High. Today (19 June 2025) the stock touched RM0.380 and reversed back to close higher at RM0.400 - indicating a lot of buying interest near the support level RM0.375 (previously resistance and now become strong support). This is an early stage of an uptrend and is a good opportunity to buy near support level.
ENTRY PRICE : RM0.380 - RM0.400
TARGET : RM0.450 and RM0.490
SUPPORT : RM0.375

US30 Pullback then LongLooking for the pullback then on on bullish PA look for the entry. Wait for breach below then push back up and bullish PA close then plan entries.

EURAUD -0.7% Short and AUDUSD MistakeA short position taken on EURAUD for a small loss after manually closing before swaps. I have also included a breakdown of a +4% AUDUSD long I was looking at taking but a small error on my behalf that caused me to stay out of the trade. Full explanation as to why I executed on this position and made the decision to manually close at the level I did.
Any questions you have just drop them below 👇

Top-Down Analysis in Action – Live Trade: Where I Enter and WhyIn this video, I walk you through my full trading process – starting with a clean top-down analysis.
I begin on the daily chart to spot key market structure and levels, then zoom in to the 1-hour chart for confirmation, and finally execute my trade on the 5-minute chart.
You’ll see:
✔️ How I define my zones and structure
✔️ Why I wait for confluence across timeframes
✔️ Exactly where and why I enter the trade
Just real analysis and real trades.
If you’re looking to improve your entries and learn how to align multiple timeframes, this one’s for you.
🔔 Don’t forget to like, comment & subscribe for more real-time trading content!
NASDAQ:AMZN
NYSE:ANET
NASDAQ:CSCO
NASDAQ:CZR
NASDAQ:GOOG
NYSE:IONQ
NASDAQ:MRVL
NASDAQ:MSFT
NASDAQ:MU
NYSE:NKE
NASDAQ:NVDA
NASDAQ:ON
NASDAQ:SBUX
NASDAQ:SHOP
NASDAQ:SMCI
NYSE:TSM
NYSE:XOM

GJ-Wed-02/07/25 TDA-Daily support 196.371 tapped and rejectedAnalysis done directly on the chart
Follow for more, possible live trades update!
I often share my live trades in Tradingview public chat in London session, stay tuned!
Patience.
There are periods where price move smoothly
and some others less smoothly. The trader's
job is to adapting to market changing conditions.
Active in London session!
Not financial advice, DYOR.
Market Flow Strategy
Mister Y

02.07.25 Morning ForecastPairs on Watch -
FX:EURNZD (Live)
FX:EURJPY
FX:GBPJPY
FX:AUDCAD
A short overview of the instruments I am looking at for today, multi-timeframe analysis down to what I will be looking at for an entry. Enjoy!

GU-Wed-02/07/25 TDA-Market positioning not the best atmAnalysis done directly on the chart
Follow for more, possible live trades update!
I often share my live trades in Tradingview public chat in London session, stay tuned!
Another factor that plays huge your trade setups, ideas is
market positioning. Your ideas might be good, but with
bad market positioning there's high chance price might
stop you out before going to your direction.
Active in London session!
Not financial advice, DYOR.
Market Flow Strategy
Mister Y
