NeoWave Alert: BTC G-Wave Sets Up a Brutal Drop After $116K PumpAs anticipated in our previous NeoWave analysis, the market appears to be deep within Wave G of a Contracting Diametric structure (A–G), originating from the March 2025 high.
⸻
🔻 Key Developments:
• After rejecting from $119,000–119,500 (Wave F resistance), price dipped to $112,000, breaking below the previous channel’s lower bound, and now appears to be forming a steeper descending channel.
• This new channel’s resistance has shifted lower to $116,000, becoming a potential bull trap zone.
• The bounce from $112K is likely a liquidity sweep, preparing for one final upside to $116K, followed by aggressive distribution.
⸻
💡 Trading Thesis:
We’re likely seeing a trap-style rally within Wave G, aiming to:
• Attract liquidity up to $116K
• Induce late longs before initiating a more violent selloff toward $105K or lower
⸻
🔍 Smart Money Confluence (SMC / ICT)
• 🟥 Confirmed bearish structure on 1H (Lower Highs + BOS)
• 🟨 Liquidity above $120K already swept during Wave F
• 📉 Order blocks around 119.5K rejected
• 🔻 Price currently trades above $114K, but trapped inside a sharper descending range
• 🧲 Unfilled FVGs between $113K–$110K may serve as magnets
⸻
🧠 Wave G Structure (Diametric)
• Possibly unfolding as a Zigzag or Complex Combination
• Channel boundary now capped at $116K
• Wave G likely targets a breakdown below Wave E ($113K) and toward $105K
⸻
📌 Primary Scenario:
• Final push to $116K → strong rejection expected
• Bearish continuation targeting $110K → $105K
🧯 Invalidations:
• Clean breakout & daily close above $120.5K invalidates this diametric structure
• Watch for triangle or flat morphing if structure shifts
⸻
⚠️ Risk Management:
• $116K = key distribution zone
• Watch closely for rejection and breakdown confirmation
• Shorts valid below $114K with tight invalidation above $117K
⸻
📌 Conclusion:
Bitcoin is nearing the climax of a multi-month complex correction. The current setup favors a liquidity trap toward $116K, followed by continuation of Wave G toward major demand zones. Smart money bias remains bearish below $117K.
⸻
💬 Drop your alternate wave counts or SMC confirmations in the comments!
Priceactionanalysis

EURAUD - Bearish H*S Retesting Double Tops LevelEURAUD is approaching a strong reversal area which we could see a retest before the next leg down. Wait for bearish confirmation on LTF before entry.
Good Luck

NZDJPY Bearish Setup Unfolding: Key Shorting Zones & TargetsThe NZDJPY pair is showing a significant shift in structure on the daily timeframe, indicating a potential bearish reversal. This blog post provides a comprehensive breakdown of the setup using multi-timeframe confluence, including psychological levels, structure breaks, and key areas of interest (AOIs) for short entries and targets.
Key Zones to Watch
1. AOI Resistance - Weekly Zone (Supply Area)
Range: ~88.50 to 89.50
This red zone represents heavy resistance based on past supply and is aligned with the 200 EMA and a psychological round number level at 88.000.
A close above this zone invalidates the short setup.
2. Structure Break & Retest Zone
The chart shows a clean structure shift near the 88.00 level on the 4HR timeframe.
Price is expected to retest this zone. If rejected with bearish confirmation, it presents an ideal short entry.
This level is key for traders waiting for a pullback before confirmation.
3. AOI Support - Daily & Weekly
Target 1 (Phase 1): Daily AOI Support near 85.000
Target 2 (Phase 2): Weekly AOI Support near 81.000
Potential Short Entry Conditions:
Wait for a retest of the structure shift zone (around 88.00).
Look for bearish candlestick confirmation on lower timeframes (4H or 1H).
Avoid premature entry until structure confirmation and rejection is visible.
Psychological & Technical Confluence
The Psychological level at 88.00 is a strong confluence zone.
Aligned with the 200 EMA – often used as dynamic resistance.
Multiple failed breakout attempts near the upper resistance band show seller dominance.
The bearish momentum from the last few sessions adds further confidence.
Bearish Scenario Breakdown
Phase 1: A move from the current structure retest toward the daily AOI (~85.00).
Phase 2: If momentum continues, a deeper drop toward the weekly AOI (~81.00) could unfold.
Rejection or consolidation near the green AOI zones could mark a potential end or reversal point.
The NZDJPY pair is presenting a technically sound short setup supported by multi-timeframe confluence. The structure shift near 88.00 is the key area to monitor. With proper confirmation and execution, this trade offers an excellent risk-to-reward opportunity targeting the 85.00 and 81.00 levels.
=================================================================
Disclosure: I am part of Trade Nation's Influencer program and receive a monthly fee for using their TradingView charts in my analysis.
=================================================================

Gold price analysis week 32The recently released Nonfarm data has become an important catalyst, officially breaking the previous bearish wave structure and shaping a completely new uptrend for gold prices. Breaking above the wave 1 peak at the 3315 area is a clear confirmation signal that the downtrend has ended.
In that context, the trading strategy for next week should prioritize buying orders. This rally has the potential to push gold prices to historical peaks if the bullish momentum is maintained with stable trading volume.
Specific trading strategy:
Important support zone: 3333 – 3315
Short-term resistance zone: 3373 – 3416

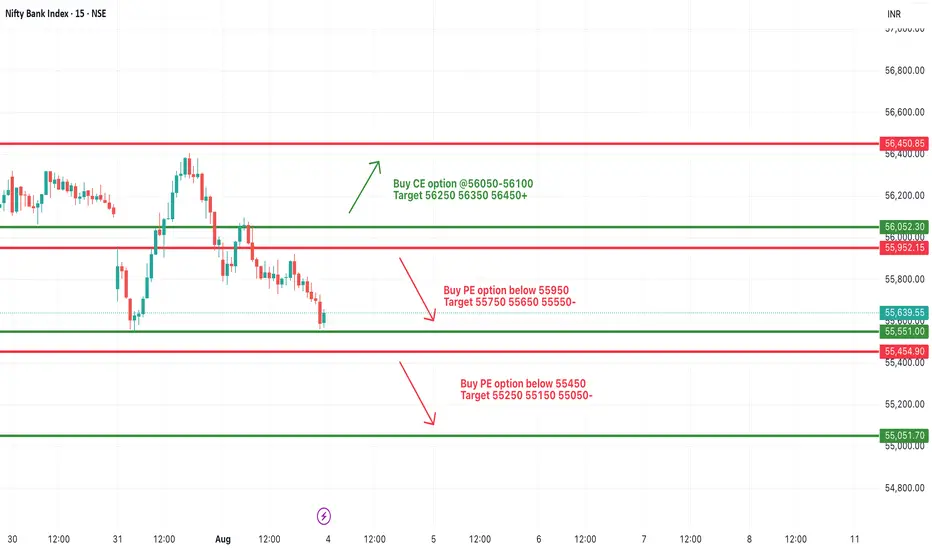
[INTRADAY] #BANKNIFTY PE & CE Levels(04/08/2025)Bank Nifty is expected to open flat or slightly gap up near the 55,600–55,650 zone. This zone could act as a critical decision point for today’s session, and price action around it will likely determine the trend for the day.
If Bank Nifty sustains above 55,950, a bullish reversal move may be triggered with potential upside targets at 56,250, 56,350, and 56,450+. A breakout above 56,050–56,100 will be essential to confirm bullish momentum.
On the downside, if Bank Nifty fails to hold above 55,950 and breaks below the 55,950–55,900 zone, a bearish continuation could unfold. Breakdown below 55,950 opens downside targets of 55,750, 55,650, and 55,550. A deeper fall can be expected if 55,450 is broken, with targets at 55,250, 55,150, and 55,050-.
Intraday traders should closely monitor price behavior around the 55,950–56,050 resistance zone.
CADJPY - Downside to continueSellers has taken control with a massive push down, wait for bearish continuation to form to confirm another sell opportunity.
Good Luck

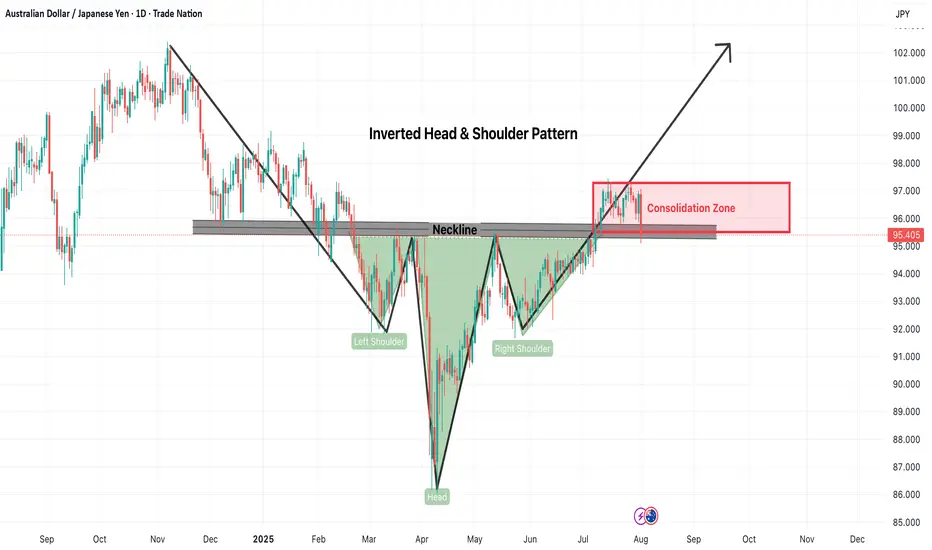
AUDJPY-Inverted Head & Shoulders Pattern at Reversal levelThe AUDJPY pair has formed a classic Inverted Head and Shoulders pattern, typically a strong bullish reversal signal. As seen on the daily chart, the left shoulder, head, and right shoulder have all developed with a clearly defined neckline near the 95.80–96.00 zone. Price action recently broke above this neckline but has since entered a consolidation phase between 95.00–97.00.
Bullish Scenario (Breakout Confirmation)
If AUDJPY decisively breaks above the 97.00 resistance with strong bullish momentum and volume, the inverted head and shoulders pattern will be fully confirmed. In this case, traders can expect an upward continuation toward:
Short-term Target: 99.00
Medium-term Target: 101.00
Measured Move Target: ~102.00 based on pattern height
Risk:
False breakout followed by quick pullback under neckline
Sudden JPY strength due to geopolitical or fundamental news
AUD weakness due to interest rate decisions or economic data
Sideways/Neutral Scenario (Extended Consolidation)
Another possibility is that AUDJPY continues to range between 95.00–97.00 for an extended period without a decisive breakout. This may happen if the market awaits more macroeconomic cues or central bank guidance.
Risk:
Whipsaws and fakeouts within the range
Frustration due to lack of clear direction
Risk Management Tips:
Wait for confirmation: Only trade post breakout or breakdown with candle close above 97.00 or below 95.00
Use tight stop-loss: Keep stops just below support or above resistance zones
Position sizing: Avoid overleveraging in rangebound conditions
Diversify exposure: Don’t put all capital into one trade setup
Conclusion:
AUDJPY is at a critical decision point. The inverted head and shoulders structure is bullish in nature, but the current consolidation adds uncertainty. Traders should stay alert for either a breakout for trend continuation or a breakdown invalidating the setup. Use proper risk management in all cases.
=================================================================
Disclosure: I am part of Trade Nation's Influencer program and receive a monthly fee for using their TradingView charts in my analysis.
=================================================================
XAUUSD Weekly Outlook – August 4–8, 2025New Month. New Week. New Questions.
Will the market reward hesitation — or bold reaction?
Will POTUS pump price with policy noise, or will smart money fade the manipulation?
August is historically a quieter month for hedge funds — but don’t mistake silence for safety. It's also the time when the Fed retreats to Jackson Hole, reflecting and recalibrating. Will September bring another rate cut… or another twist?
Stay sharp. This isn’t a month to sleep on.
"Last week's game plan played out nearly to perfection — well, almost! Let’s dive in and break down where gold could be headed next week."
Gold kicks off August with a strong breakout above $3360, powered by a weakening U.S. dollar, rising global risk appetite, and persistent institutional demand. With Jackson Hole on the horizon and shifting Fed expectations, volatility is set to spike. The big question: will gold extend above premium, or retrace to rebalance?
After the last rejection near 3440, price broke cleanly below its ascending channel. Now, gold appears to be forming a potential lower high around the broken trendline — a rejection here could trigger a drop toward the key $3250 support zone.
🟡 XAUUSD – August Macro Outlook
💰 Price: $3362
📅 Date: August 3, 2025
📈 Bias: Bullish but extended — high in premium
🔸 Monthly Overview
📊 Trend: Bullish continuation (CHoCH April 2023)
🧱 Supply Zone: 3350–3439 → monthly wick trap
⚠️ RSI 80+, price nearing 100% Fib extension
🔮 Breakout above 3439 → 3505 / 3610 next
🔻 Rejection → pullback to 3270 / 3180
🔸 Weekly Outlook
💥 Structure: Strong bullish, EMA stack intact
🟥 Final HTF Supply: 3350–3439 (currently testing)
🟦 Demand Below: 3270 → 3215 → 3070
🎯 Targets if breakout: 3505 → 3560 → 3610
🔸 Daily Structure
⚔️ Now testing: 3355–3375 → last valid supply
🎭 Above that → internal trap at 3398–3412
🧨 Final ceiling at 3430–3439 — breakout or reversal?
🔸 H4 / H1 Key Zones
🟥 Supply: 3360–3375 / 3385–3398 / 3430–3439
🟫 Flip Long Zone: 3322–3310
🟦 Bullish Demand: 3285–3260 → 3222–3205
⚠️ RSI elevated, watch for reaction not breakout
🔹 Execution Plan
✅ Above 3439 → Expansion to 3505 / 3610
🔁 Pullback to 3325 / 3285 → Sniper long zones
🔻 Rejection from 3375 → Short scalp → Target 3320
📌 3439 = Key Monthly Pivot
🟢 Hold above → New expansion wave
🔴 Fail below → Retrace toward value
Extended:
🔸 Scenario 1: Breakout and Expansion
If bulls push through 3375 with conviction and break above 3439, gold enters a fresh leg of macro price discovery. This would activate a clean expansion path toward:
3405 (short-term extension)
3505 → 3560 → 3610 (Fibonacci projections)
3740 (full trend extension if momentum persists)
This scenario requires solid bullish confirmation, especially on H4 or D1 structure. Traders should look for LTF OB re-entries or bullish flags above 3350 to join the trend safely.
🔸 Scenario 2: Rejection and Retrace
If gold rejects from the 3360–3375 zone and fails to hold above it, a controlled retracement is likely. Key downside targets include:
3325 → first flip zone for re-entry
3285 → origin of the latest rally (strong buy zone)
3215–3180 → high-timeframe demand and imbalance fill
Only a breakdown below 3260 would threaten the bullish structure and shift bias toward neutral or bearish.
🔸 Conclusion
Gold is approaching its inflection point. The macro trend is intact, but momentum is stretched, and the market now demands clear validation.
📌 3439 remains the weekly pivot:
Above → Expansion toward 3500+
Below → Retracement to reclaim value
For next week, the most probable path is early consolidation inside 3360–3375, followed by a decisive reaction — either continuation toward 3405+, or a corrective drop toward 3325/3285 to reset structure.
Disclaimer: For educational context only.
#XAUUSD #Gold #SmartMoney #TradingAnalysis #SMC #USD #GoldOutlook

Follow master candle for today's SELL strategy✏️ OANDA:XAUUSD has continued a strong downtrend. Yesterday's D1 candle closed with a 60-price decrease, forming a master candle that determines the market trend. With the market having a master candle, pay attention to the 25% or 50% candle zones to trade in the direction of the trend. Today's main trading strategy will be to SELL according to the master candle. The BUY strategy will only be implemented when the 3313 zone is broken.
📉 Key Levels
Support: 3285-3270-3250
Resistance: 3301-3312-3333
SELL Trigger. Rejection 3301, 3312
Target 3250
Leave your comments on the idea. I am happy to read your views.

Nonfarm Pay Attention Zone✏️ OANDA:XAUUSD is recovering and increasing towards the resistance zone of yesterday's US session. The 3315 zone is considered a strategic zone for Nonfarm today. A sweep up and then collapse to the liquidity zone of 3250 will be scenario 1 for Nonfarm today. If this important price zone is broken, we will not implement SELL strategies but wait for retests to BUY. It is very possible that when breaking 3315, it will create a DOW wave with the continuation of wave 3 when breaking the peak of wave 1.
📉 Key Levels
SELL trigger: Reject resistance 3315.
Target 3250
BUY Trigger: Break out and retest resistance 3315
Leave your comments on the idea. I am happy to read your views.

EUR/USD DROP UPCOMING - Short Setup AnalysisEUR/USD - Bearish Setup Analysis
Analysis Overview:
Current Trend: The chart shows a clear downtrend with lower highs and lower lows forming.
Fibonacci Retracement: A Fibonacci tool has been applied from a recent swing high to swing low. The price appears to be in a retracement phase, approaching key Fibonacci levels (possibly 61.8% or 50% zone), where resistance is anticipated.
Bearish Order Block: A bearish zone (highlighted in red/pink) suggests a potential supply zone or resistance area, where sellers may step in.
Projected Move: A blue projection arrow indicates a potential bearish move after hitting resistance. Target levels are marked near previous lows and Fibonacci extensions.
Key Levels:
Resistance (entry zone): Around 1.0785–1.0800
TP1: 1.0720
TP2: 1.0680
Final TP: 1.0640
SL: Above 1.0800, beyond the supply zone
Volume Analysis:
Volume is decreasing during the retracement, which supports the idea that buying pressure is weakening as the price retraces up into resistance.
📌 Conclusion:
This setup indicates a potential short trade opportunity around the supply zone, aiming to ride the continuation of the downtrend after a retracement to resistance. Risk management should be applied accordingly.

BUY EURCAD 4.8.2025Confluence order: BUY at M15
Type of order: Limit order
Reason:
- The current top is not touching anything, expected to rise to the sub-key of H1 above.
Note:
- Management of money carefully at the last bottom (1,59310)
Set up entry:
- Entry buy at 1,59090
- SL at 1,58910
- TP1: 1,59310 (~1R)
- TP2: 1,59824 (~4R)
- TP3: 1,60200 (~6R)
Trading Method: Price action (No indicator, only trend and candles)

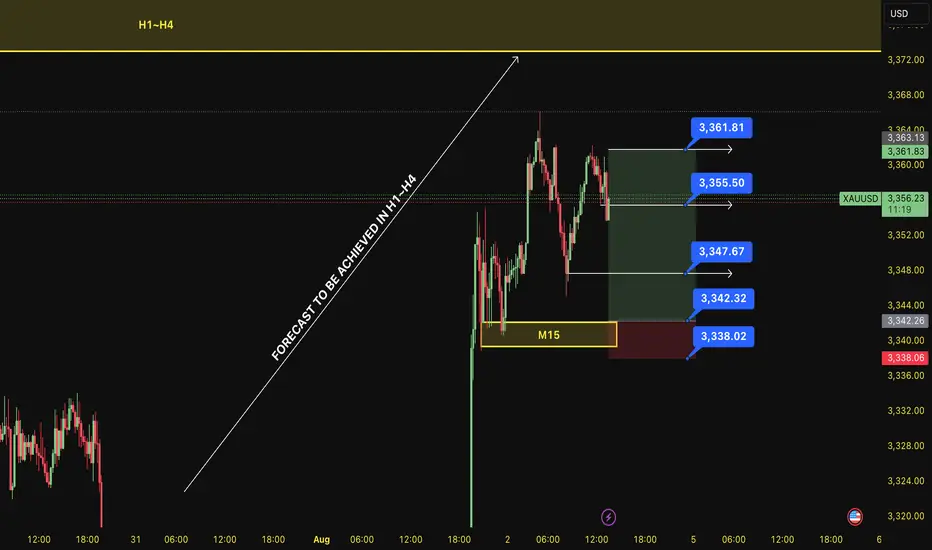
BUY XAU 4.8.2025Confluence order: BUY at M15
Type of order: Limit order
Reason:
- The current top is not touching anything, expected to rise to the H4~H1 above.
Note:
- Management of money carefully at the last bottom (3,347)
Set up entry:
- Entry buy at 3,342
- SL at 3,338
- TP1: 3,347 (~1R)
- TP2: 3,355 (~3R)
- TP3: 3,361 (~4,5R)
Trading Method: Price action (No indicator, only trend and candles)
XAUUSD Technical Analysis – Bullish Continuation SetupXAUUSD Technical Analysis – Bullish Continuation Setup
📊 Market Structure Overview:
The chart shows a clear bullish structure shift, marked by multiple Break of Structure (BOS) events that validate strength from buyers. After forming equal lows and a liquidity sweep at the strong support zone, price has aggressively moved higher, breaking through minor resistance levels and showing clear bullish intent.
🧱 Key Technical Elements:
🔹 1. Strong Support Zone (Demand Rejection)
Price respected the strong demand zone between $3,260 – $3,280, where aggressive buying was seen after forming a bullish engulfing breakout. This zone aligns with previous demand and a major BOS, confirming institutional buying interest.
🔹 2. Bullish Order Flow & Break of Structure (BOS)
Multiple BOS levels across July and early August highlight a sequence of higher highs and higher lows, indicating trend continuation.
The most recent BOS after July 30 shows an impulsive break, confirming bullish dominance and clean order flow.
🔹 3. Fair Value Gaps (FVGs)
Bullish FVG (Mid-July): Price respected and bounced from this zone, showing previous imbalance was filled and used as a base for continuation.
New FVG (Above $3,420): The current upside target lies within this area, acting as a magnet for price due to unfilled orders.
🔹 4. Buy-Side Liquidity & Target Zone
The market is approaching a buy-side liquidity zone around $3,385, a key short-term target where previous highs and stop orders are likely pooled.
If liquidity above $3,385 is taken efficiently, price may expand into the FVG zone between $3,420 – $3,460.
🔹 5. Bullish Confirmation & Momentum
The candle structure shows a clean bullish impulsive move, followed by minor consolidation—likely a bullish flag/pennant indicating potential for further continuation.
Momentum is favoring buyers, and short-term consolidation above $3,340 is healthy for continuation.
🔐 Liquidity & Institutional Narrative
Equal Lows (EQL) and FVG fills suggest prior liquidity was swept and used to fuel institutional long positions.
The recent BOS confirmed that smart money has shifted bias toward longs, and price is now targeting remaining inefficiencies to the upside.
The clear alignment of BOS, liquidity sweep, and bullish FVGs reinforces a strong institutional footprint on this move.
🔍 Key Levels to Watch:
Level Type Price Zone (USD)
🔺 Resistance / FVG 3,420 – 3,460
🎯 Immediate Target 3,385
📉 Short-Term Support 3,340 – 3,320
🛡️ Major Demand Zone 3,260 – 3,280
📌 Conclusion & Outlook:
XAUUSD has initiated a strong bullish leg from the demand zone, confirming accumulation and structural reversal. Price is now moving toward the buy-side liquidity target of $3,385, with potential continuation toward the FVG resistance zone of $3,420–$3,460.
As long as price remains above the $3,320 structure support, the bullish bias remains intact. Any pullbacks should be seen as buying opportunities, especially on lower timeframe confirmations.

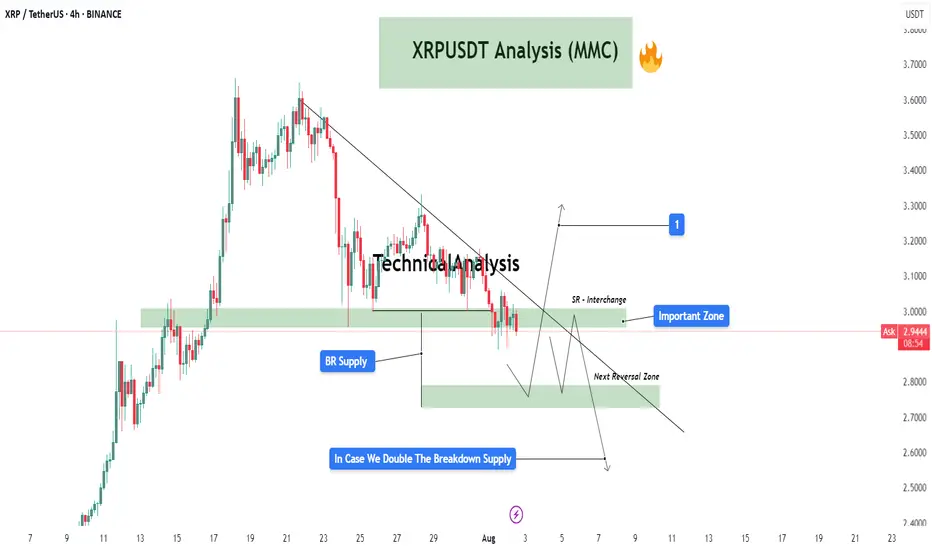
XRPUSDT Analysis (MMC) : Decision Point + Next Move Loading In this 4-hour chart of XRP/USDT, we're observing a critical structure forming under the Mirror Market Concepts (MMC) framework. Price action is compressing near an important descending trendline, suggesting that a breakout or breakdown is imminent. Let’s break it down zone by zone:
🔍 Key Zones & Price Structure:
Important Zone (SR Interchange Zone – $2.95 - $3.05)
This is a major supply-to-demand flip zone. It has served as both resistance and support in the past and is now acting as a potential interchange level. The price is hovering just below this area, retesting it after a significant bearish structure.
BR Supply Zone (Breakdown Retest Supply – $2.93 - $2.98)
After price broke down from this zone, it created a base for a retest. This level has since acted as a cap to further upside movement. It also coincides with the descending trendline, adding confluence to its strength as resistance.
Next Reversal Zone ($2.75 - $2.85)
In case the price fails to reclaim the Important Zone, we could see a bearish continuation move into the next zone of interest. This is a likely reversal or reaction area based on previous demand imprints and price imbalance.
SR Flip Watch
If price breaks above the trendline and sustains above the SR Interchange Zone, this could trigger a potential bullish breakout toward the $3.20+ region (labeled as target “1”). This move would be backed by trapped sellers and liquidity above the descending structure.
📈 Potential Scenarios:
✅ Bullish Case:
Break and close above the descending trendline.
Successful retest of the Important Zone as demand.
Push toward $3.20 - $3.30 where the next supply awaits (target 1).
❌ Bearish Case:
Rejection at the Important Zone and trendline resistance.
Breakdown below $2.90 confirms bearish pressure.
Possible liquidity sweep and reaction from the Next Reversal Zone ($2.75-$2.85).
If this zone fails to hold, continuation toward lower zones becomes likely.
🧠 MMC Perspective:
From a Mirror Market Concepts (MMC) standpoint, the market is currently at a reflection point where a decision between bulls and bears is about to play out. The clean diagonal structure plus clear horizontal liquidity pockets makes this setup ideal for anticipating manipulation traps and smart money moves.
AUDCAD / GBPAUD Trade Recaps 01.08.25A tester trade on AUDCAD with the reasons explained as to why this was a test position, and a short position executed on GBPAUD. Solid setup that this time around just didn't commit.
Full explanation as to why I executed on these positions and the management plan with both.
Any questions you have just drop them below 👇

01.08.25 Morning ForecastPairs on Watch -
FX:EURJPY
FX:EURGBP
A short overview of the instruments I am looking at for today, multi-timeframe analysis down to what I will be looking at for an entry. Enjoy!

BTCUSD Technical Analysis – Bearish Momentum Towards Fair Value BTCUSD Technical Analysis – Bearish Momentum Towards Fair Value Gap
Bitcoin is showing clear bearish pressure after rejecting from the previous resistance zone around 118,800 – 120,000. The market structure and smart money concepts indicate potential for further downside.
🔍 Key Observations:
Previous Resistance Respected: Price failed to break through the strong resistance zone marked near the 119,200–120,000 level, showing strong institutional selling interest.
Market Structure Breaks:
BOS (Break of Structure) and CHoCH (Change of Character) confirmed bearish shift.
Price has maintained lower highs and lower lows, signaling a bearish trend.
Liquidity/Fair Value Gap Zone: The market is currently targeting the liquidity/FVG zone between 116,400 – 116,100, which aligns with price inefficiency and unfilled orders.
Support Zone Ahead: A strong support zone is visible near 115,600 – 115,200. Expect a potential reaction or consolidation here.
📌 Strategy & Bias:
Short Bias Active until price reaches 116,116 (target).
Watch for possible bullish reversal signs in the support/FVG zone.
Ideal for scalp-to-swing short trades, with tight SL above recent EQH.
📚 Educational Notes:
Fair Value Gaps (FVG) indicate institutional imbalances and are often revisited by price.
CHoCH and BOS are early signals of smart money moves – always monitor them in confluence with volume and zones.

Trend Exhaustion Detected – Bearish Structure AheadUS100 (NASDAQ) 30-minute chart as of July 26, 2025, with technical insights based on the visible elements.
🔍 1. Trend Analysis
Primary Trend: Uptrend (bullish structure)
The price has been respecting a rising parallel channel, marked by:
Ascending support (lower boundary)
Ascending resistance (upper boundary)
Market structure shows:
Higher Highs (HH)
Higher Lows (HL)
✅ This indicates continuation of bullish momentum until structure breaks.
📐 2. Market Structure Elements
Structure Type Label on Chart Price Zone (approx.)
Break of Structure (BOS) BOS (center-left) ~22,950
Higher Low (HL) HL (2x) ~22,700 (1st), ~23,050 (2nd)
Higher High (HH) HH (2x) ~23,150 and ~23,300
Resistance Labelled ~23,300–23,320
Demand Zones Labelled ~22,450–22,700
🔁 Break of Structure (BOS)
The BOS occurred after a prior swing low was broken, followed by a new higher high, confirming a bullish shift.
🧱 3. Support / Resistance Analysis
🔼 Resistance Zone
The price is testing strong resistance around 23,300–23,320
Multiple rejections in this area
Trendline resistance also aligns here
A rejection arrow is drawn, indicating potential bearish reaction
🔽 Support Zone (Immediate)
23,180–23,220: highlighted green box is a local support block
If broken, likely to revisit 23,000–23,050, or even down to 22,900 range
🟩 4. Demand Zones
Zone 1:
22,450–22,600: Strong bullish reaction historically — likely to act as a key demand if a deeper pullback occurs
Zone 2:
22,850–22,950: Validated with prior accumulation & BOS event
🧠 5. Key Observations
Price is at a critical inflection zone:
Testing a resistance zone
At the upper trendline of an ascending channel
A bearish reaction is projected (black arrow)
Possibly targeting the green support zone around 23,180–23,220
If that fails, demand at ~23,000 will likely be tested
Ichimoku Cloud:
Currently price is above the cloud → still bullish
Cloud is thin → potential weakness or upcoming consolidation
⚠️ 6. Trading Bias & Setup Ideas
✅ Bullish Bias (if price holds above ~23,180)
Long entries can be considered on bullish reaction from support
Target: retest of 23,300–23,350 or even breakout continuation
❌ Bearish Bias (if breakdown below support)
Short entry valid below 23,180 with:
TP1: 23,050
TP2: 22,900
A breakdown from the ascending channel would signal trend exhaustion
🔚 Conclusion
Current Price: 23,298.4
Trend: Bullish, but at resistance
Next move: Watch for reaction at resistance and support box below
Bias: Neutral-to-bullish unless the structure breaks below ~23,180

AUDCAD - Buyers ready to step in AUDCAD is in moving in LTF consolidation before next impulsive phase. Couple highs to target a good R ratio.
Good Luck

31.07.25 Morning ForecastPairs on Watch -
FX:GBPAUD
FX:AUDCAD
FX:AUDCHF
A short overview of the instruments I am looking at for today, multi-timeframe analysis down to what I will be looking at for an entry. Enjoy!

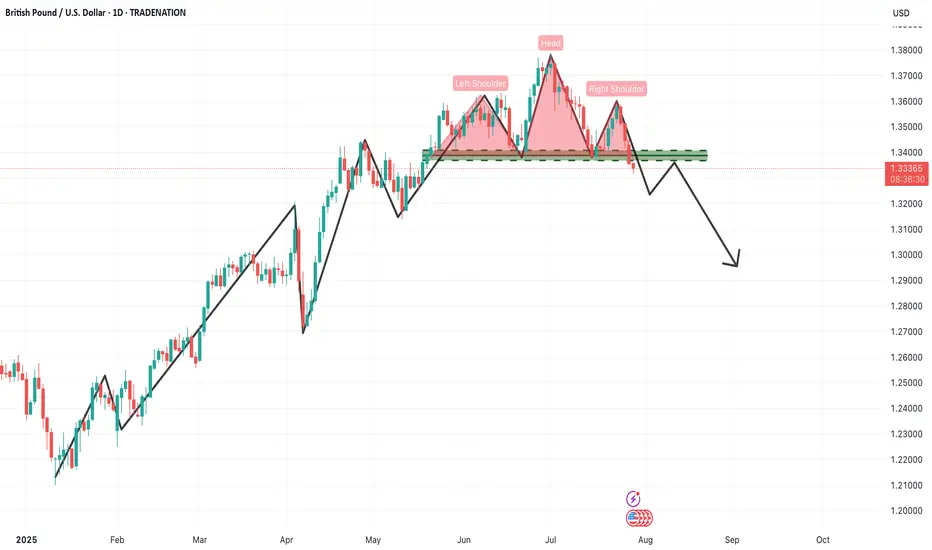
GBPUSD – Daily Timeframe Analysis: Head & Shoulders PatternThe GBPUSD daily chart is currently presenting a textbook Head & Shoulders reversal pattern, a powerful bearish signal that often marks the end of an uptrend and the beginning of a new downward cycle. This setup demands attention from swing and positional traders alike, especially considering the size and clarity of the structure.
🔍 Pattern Breakdown
Left Shoulder: Formed in late May, establishing a significant high before a corrective move.
Head: A higher peak was made in early June, which now stands as the pattern's highest point.
Right Shoulder: A lower high formed in mid-July, indicating weakening bullish momentum.
Neckline: The crucial horizontal support zone around 1.3330–1.3340 was tested multiple times and has now been decisively broken, triggering a confirmed bearish setup.
📊 Technical Significance
This Head & Shoulders pattern becomes especially meaningful due to:
Multiple rejections at the neckline, confirming its strength as support-turned-resistance.
Bearish volume expansion on the breakdown, adding weight to the selling pressure.
Formation on a daily timeframe, suggesting a long-term trend reversal rather than a short-term pullback.
📌 Trading Strategy for Traders
✅ Sell Setup (Short Position)
Entry: Around the neckline zone on retest (1.3320–1.3340)
Stop Loss: Above the right shoulder (~1.3550)
Targets:
🎯 Target 1: 1.3100 (psychological and horizontal support)
🎯 Target 2: 1.2900 (measured move from head to neckline)
🎯 Target 3: 1.2650–1.2600 (extended downside zone based on structure)
⚠️ Risk Management Tips:
Don’t chase the breakdown — wait for a pullback/retest of the neckline to get a better risk/reward entry.
Ensure position sizing is appropriate based on the stop loss distance.
If price reclaims the neckline with strong bullish momentum and closes above 1.3350, exit short and reevaluate.
🧠 What Traders Should Keep in Mind
Macro Fundamentals: Watch upcoming economic events like BoE rate decisions, US NFP, and inflation data, which can cause volatility and impact the technical scenario.
Dollar Index (DXY) trend should also be monitored closely. If DXY rallies, GBPUSD breakdown can accelerate.
Trendline Confirmation: Align this with any break of rising trendlines drawn from previous lows.
📌 Final Thought
This pattern marks a crucial turning point in GBPUSD. The momentum has clearly shifted from buyers to sellers, and the breakdown opens up significant downside room. As a swing or position trader, this is a high-probability setup with a clear invalidation point (above the right shoulder) and a favorable risk-reward ratio.
📉 Patience and precision are key here. Let price come to you at the neckline, confirm rejection, and then take the trade with confidence.
=================================================================
Disclosure: I am part of Trade Nation's Influencer program and receive a monthly fee for using their TradingView charts in my analysis.
=================================================================
Is the gold correction over?✏️Yesterday's D1 candle closed above the Breakout 3363 zone. This shows that the buyers in the US session are still strong. There is a possibility of a liquidity sweep in the Tokyo and London sessions, then in the New York session, Gold will recover and increase again. The uptrend is really broken when Gold confirms a close below 3345. In this case, we have to wait for 3320 to confirm the BUY point. The gold uptrend at this time also needs new momentum to be able to move towards ATH 3500.
📉 Key Levels
Support: 3345-3320
Resistance: 3373-3418
Buy zone: 3345 (bullish wave structure maintained); BUY DCA break 3373
Buy zone: 3320 (Strong support zone)
Target: 3417
Leave your comments on the idea. I am happy to read your views.
