GBP/AUD Range-Bound Structure – Support Retest in ProgressThe GBP/AUD pair is currently trading inside a well-defined horizontal range channel, bounded by resistance around 2.1050–2.1100 and support near 2.0600–2.0650. Price has been moving in a sideways rhythm since late April, oscillating between the two levels with several clean swings.
As of now, the market is heading toward the ascending support trendline, indicating a possible short-term bounce or a larger directional move depending on how price reacts there.
🔄 Scenario 1: Bullish Rebound from Support
If the price finds buying interest near the 2.0650–2.0700 zone and bounces with strong bullish candles, it may signal the beginning of another swing toward the resistance zone at 2.1100. This would maintain the current range-trading behavior, offering traders a buy-low, sell-high opportunity.
Buy Entry: Near 2.0650–2.0700 (after confirmation)
SL: Below 2.0580
TP: 2.0950 / 2.1100
⛔ Scenario 2: Bearish Breakdown from Support
However, if price decisively breaks below the support zone with momentum, it would invalidate the current range and may trigger a larger corrective leg to the downside. This could lead to levels around 2.0400 or even 2.0200, aligned with previous demand zones.
Sell Entry: On breakdown below 2.0600 with retest
SL: Above 2.0700
TP: 2.0400 / 2.0200
🧭 Technical Outlook Summary
Pattern: Horizontal range with slight ascending base
Bias: Neutral – Watch for bounce or breakdown
Support to watch: 2.0650–2.0600
Resistance to watch: 2.1050–2.1100
Next Action: Wait for reaction at support before taking directionally biased trades
=================================================================
Disclosure: I am part of Trade Nation's Influencer program and receive a monthly fee for using their TradingView charts in my analysis.
=================================================================
Priceactionanalysis

“Accumulation, Breakout, Repeat: SBSW’s Time Again?” SBSW | Weekly Chart Analysis
4-Year Cycle | Smart Money Levels | Precious Metals Macro Tailwind
This chart paints a clear picture — Sibanye-Stillwater (SBSW) has followed a reliable 4-year accumulation-to-expansion cycle:
🔹 2015–2016
🔹 2019–2021
🔹 Now shaping up for 2025–2026
Each rally kicked off after institutional accumulation around the $3 level, and once again, we’re seeing the same behavior. History doesn’t just rhyme — it repeats.
🧠 Smart Money Moves
Every major cycle began after price based out near the $3 level. That’s exactly what we’ve just seen — accumulation, basing, and now lift-off. We’ve entered a familiar pattern — the same smart money footprints showing up again.
📊 Technical Breakdown
This is the weekly chart, and we’re now testing the 0.236 Fibonacci retracement level (7.39) drawn from the 2020 high to the recent low.
✅ A weekly close above this level + structure building could confirm the beginning of a long-term leg higher.
📈 Volume Flow Indicator has crossed above the midline for the first time in years, suggesting that real buying pressure is back. That’s a shift in momentum worth noting.
🎯 Key Areas of Interest:
• $10.00 – Volume node + prior S/R
• $12.00 – Fib midpoint + prior pivot
• $14.90 – Confluence zone
These are zones where I’ll be watching for continuation, reaction, or reversal.
🌎 Macro Tailwind: Precious Metals Demand
Platinum and palladium are gaining renewed attention as demand increases in EVs, clean energy, and industrial sectors. SBSW — with its deep exposure to both metals — is positioned as a long-term beneficiary if this trend continues.
Add to that the recent global instability and de-dollarization chatter, and you’ve got a macro backdrop favoring real assets over paper. Precious metals are catching a bid — and SBSW could ride that wave.
🧠 My Position
Started buying $4.00 calls and recently rolled to $5.50s. I’m letting this one develop over time — watching for confirmation and continuation.
(Not financial advice — just sharing my perspective as always.)
🕰️ Cycles matter.
📚 History teaches.
💰 Smart money accumulates before the breakout.
This setup has all the hallmarks of a repeat cycle in progress. I’m locked in.
—
📍 Long-term chartwork, weekly timeframe. Zoom out to see the rhythm.
SBSW | Weekly Chart Analysis
4-Year Cycle | Smart Money Levels | Precious Metals Macro Tailwind
This chart paints a clear picture — Sibanye-Stillwater (SBSW) has followed a reliable 4-year accumulation-to-expansion cycle:
🔹 2015–2016
🔹 2019–2021
🔹 Now shaping up for 2025–2026
Each rally kicked off after institutional accumulation around the $3 level, and once again, we’re seeing the same behavior. History doesn’t just rhyme — it repeats.
🧠 Smart Money Moves
Every major cycle began after price based out near the $3 level. That’s exactly what we’ve just seen — accumulation, basing, and now lift-off. We’ve entered a familiar pattern — the same smart money footprints showing up again.
📊 Technical Breakdown
This is the weekly chart, and we’re now testing the 0.236 Fibonacci retracement level (7.39) drawn from the 2020 high to the recent low.
✅ A weekly close above this level + structure building could confirm the beginning of a long-term leg higher.
📈 Volume Flow Indicator has crossed above the midline for the first time in years, suggesting that real buying pressure is back. That’s a shift in momentum worth noting.
🎯 Key Areas of Interest:
• $10.00 – Volume node + prior S/R
• $12.00 – Fib midpoint + prior pivot
• $14.90 – Confluence zone
These are zones where I’ll be watching for continuation, reaction, or reversal.
🌎 Macro Tailwind: Precious Metals Demand
Platinum and palladium are gaining renewed attention as demand increases in EVs, clean energy, and industrial sectors. SBSW — with its deep exposure to both metals — is positioned as a long-term beneficiary if this trend continues.
Add to that the recent global instability and de-dollarization chatter, and you’ve got a macro backdrop favoring real assets over paper. Precious metals are catching a bid — and SBSW could ride that wave.
🧠 My Position
Started buying $4.00 calls and recently rolled to $5.50s. I’m letting this one develop over time — watching for confirmation and continuation.
(Not financial advice — just sharing my perspective as always.)
🕰️ Cycles matter.
📚 History teaches.
💰 Smart money accumulates before the breakout.
This setup has all the hallmarks of a repeat cycle in progress. I’m locked in.
📍 Long-term chartwork, weekly timeframe. Zoom out to see the rhythm.
🛑 Invalidation below $5.50 — no structure, no conviction, I’m out.
If SBSW breaks back below the $5.50 level with high volume and fails to reclaim it quickly, that would invalidate the current breakout structure and suggest this move was a false start. I'd reassess the cycle thesis if we revisit the $4 range with no buyer defense.
Please feel free to comment and let me your opinion

DESTINI - MARK UP PHASE STARTS ?DESTINI - CURRENT PRICE : RM0.400
DESTINI broke above resistance on 12 JUNE 2025 with burst in trading activity. It was the BREAKOUT of ACCUMULATION PHASE and 52 Week High. Today (19 June 2025) the stock touched RM0.380 and reversed back to close higher at RM0.400 - indicating a lot of buying interest near the support level RM0.375 (previously resistance and now become strong support). This is an early stage of an uptrend and is a good opportunity to buy near support level.
ENTRY PRICE : RM0.380 - RM0.400
TARGET : RM0.450 and RM0.490
SUPPORT : RM0.375

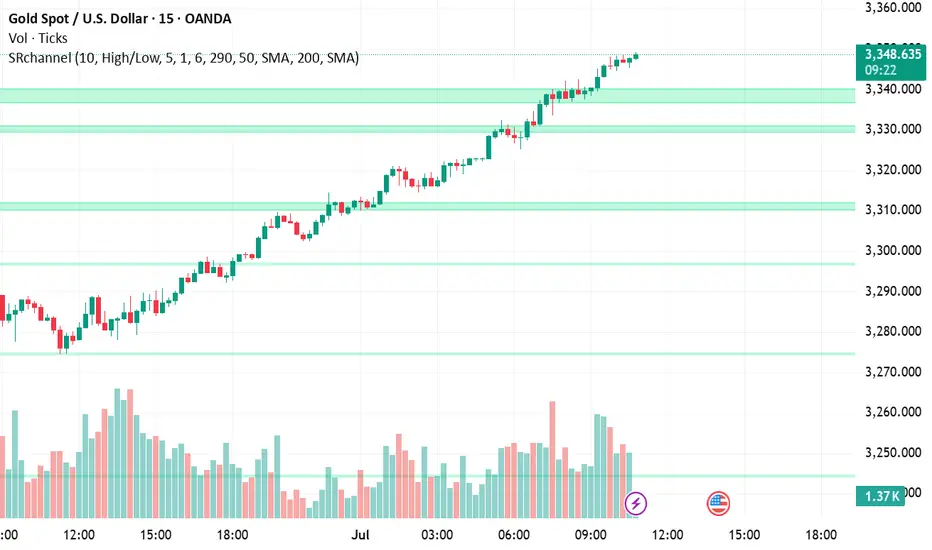
Gold Trading Strategy February 7✏️As expected from the analysis, after the D1 candle showed buying pressure again, the price continued its uptrend yesterday and reached 3357.
Currently, the price is consolidating within a relatively wide sideways range, extending from 3328 to 3344.
A trend-following trading strategy will be set up when the price breaks out of this range.
The BUY signal is expected to bring good profits if the price retests the support.
The SELL signal at resistance is considered to look for rebound points in an uptrend.
📈 Key Levels
Breakout Range: 3344-3328
Support: 3310-3298
Resistance: 3368-3386
📊 Recommended Trade Setups
BUY: 3310-3308 | SL: 3305
SELL: 3368-3370 | SL: 3373

Gold price analysis July 2As expected, after the D1 candle showed the return of buying power, yesterday's trading session saw the price continue its upward trend and reach 3357.
Currently, the market is in an accumulation phase with a fairly wide range, fluctuating from 3328 to 3344. This is an important price zone, acting as a "sideway box" waiting for a breakout.
The priority strategy at this time is still trend trading - activated when the price breaks out of the above accumulation zone.
BUY orders will have a high probability of success if the price adjusts and retests the Support or Resistance zones that have just been broken, then forms a confirmation signal.
Meanwhile, SELL orders around resistance should only be considered a recovery strategy in an uptrend - requiring strict risk management and short-term profit expectations.
Breakout Range: 3328 – 3344
Support: 3310 – 3298
Resistance: 3368 – 3386

02.07.25 Morning ForecastPairs on Watch -
FX:EURNZD (Live)
FX:EURJPY
FX:GBPJPY
FX:AUDCAD
A short overview of the instruments I am looking at for today, multi-timeframe analysis down to what I will be looking at for an entry. Enjoy!

Gold Trading Strategy June 27✏️The price reaction at 3348 forms a sustainable bearish structure. 3296 is an important zone when broken, it will continue to fall deeply without any recovery on Friday.
Today the downtrend will encounter less resistance than the uptrend. Therefore, it is not difficult to touch the support zones of 3278 and 3255.
Any recovery in the price in the European session is considered a good opportunity for a Sell signal towards the target of 3278 and 3255.
As analyzed, the SELL zone today is noted at many resistance zones and consider the price reaction for the SELL signals.
📈 Key Levels
Break out: 3296
Support: 3278-3255
Resistance: 3300-3312-3325-3336-3348-3363
📊 Recommended Trade Setups
BUY 3278-3276 SL 3272
SELL 3325-3327 SL 3330

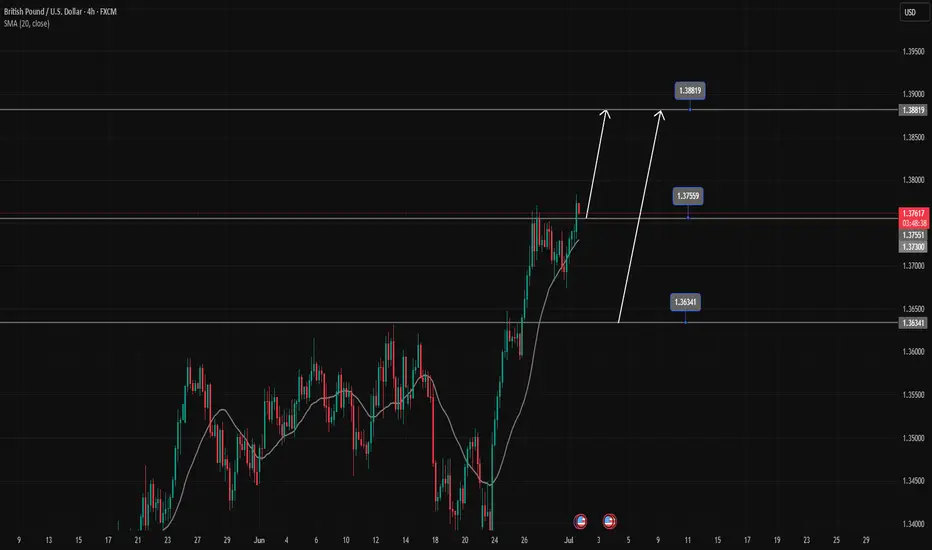
GBPUSD's strong uptrend continuesGBPUSD is in a strong uptrend, Price has just broken the resistance zone of 1.37500.
All the bullish momentum is heading towards the resistance zone of 1.388.
If there is a close of the h4 candle below the resistance zone of 1.375, there will likely be a Pullback to 1.363 to find more buying momentum towards the target at the resistance zone of 1.388
📈 Key Levels
Support: 1.375-1.363
Resistance: 1.388
📊 Recommended Trade Setups
BUY GBPUSD 1.375-1.373 Stoploss 1.37000
BUY GBPUSD 1.363-1.361 Stoploss 1.35800
SELL GBPUSD 1.388-1.390 Stoploss 1.39300
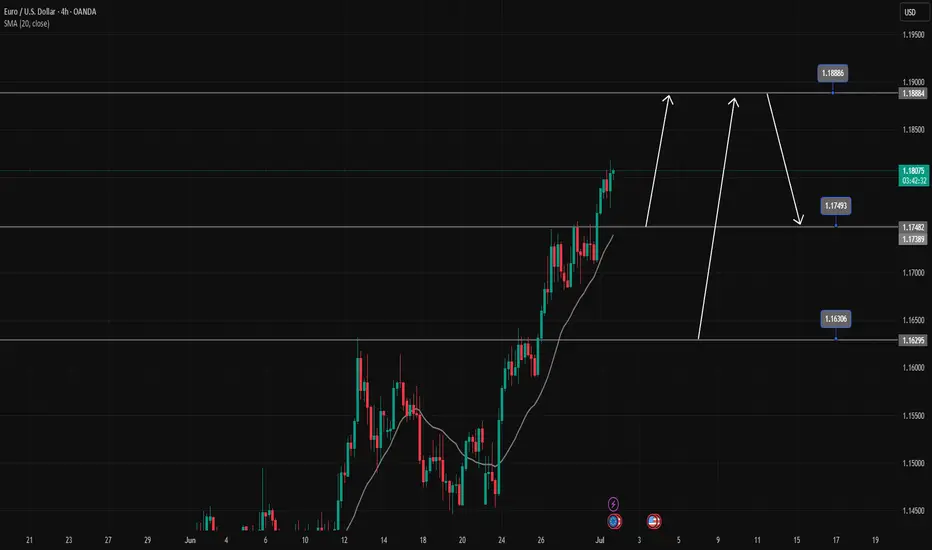
EURUSD is in a strong uptrendEURUSD is in a strong uptrend, Price just broke the resistance zone of 1.175.
All the bullish momentum is heading towards the resistance zone of 1.188.
If there is a close of the h4 candle below the resistance zone of 1.175, there will likely be a Pullback to 1.163 to find more buying momentum towards the target at the resistance zone of 1.188
📈 Key Levels
Support: 1.175-1.163
Resistance: 1.188
📊 Recommended Trade Setups
BUY EURUSD 1.175-1.173 Stoploss 1.170
BUY EURUSD 1.163-1.161 Stoploss 1.158
SELL EURUSD 1.188-1.190 Stoploss 1.1930
GBPAUD waiting for conditions to break out of the wide rangeGBPAUD found some buying momentum at the 2.085 support in today's trading session. In the long term, the pair's trading range is wide, extending from 2.102 to 2.067. A breakout of this range will form a new trend.
A BUY trading signal is confirmed when the pair breaks the resistance at 2.10200.
A SELL signal is confirmed when the pair breaks the support at 2.085.
📈 Key Levels
Support: 2.085 - 2.067
Resistance: 2.102 - 2.138

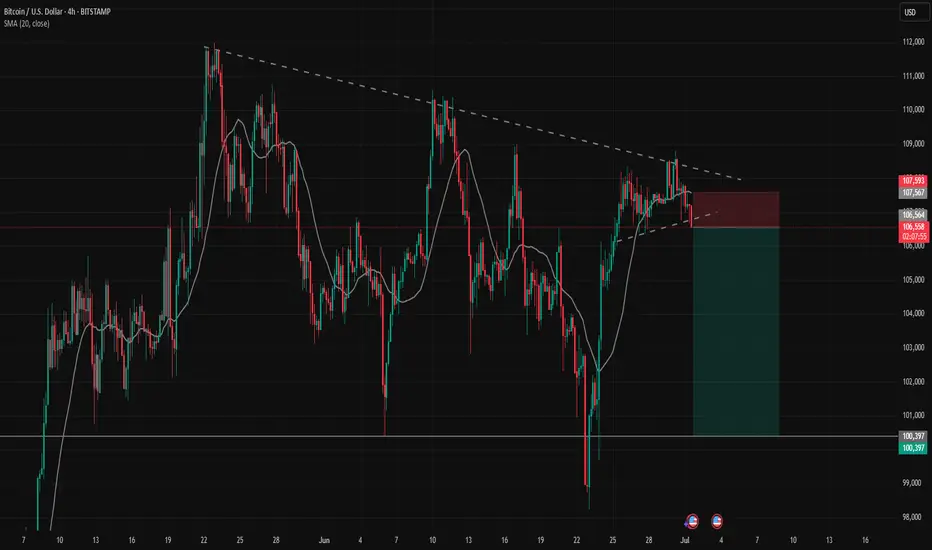
SELL BTCUSD trading signalBTCUSD confirmed the weakness at the trendline resistance zone on the h4 time frame.
The h1 time frame price confirmed that the sellers won when the candle closed below the nearest trendline support zone.
In terms of wave structure, there is no strong support zone that is strong enough to keep the BTC price uptrend in the short term. Therefore, the target of the SELL signal can reach 100,400. That is the wick area of the past liquidity candle where the buyers won over the sellers and pushed the price up sharply.
Gold Trading Strategy July 1✏️ D1 candle has a bullish recovery when closing above 50% of last Friday's decline.The bullish wave of Gold is forming, heading back to the GAP 3363 zone.Today's main strategy is to wait for BUY if there is a retest of 3300. Reaction sell strategy is focused on resistance zones with not too long expectations.
📈 Key Levels
Support 3300- 3379- 3360
Resistance 3334-3348-3363
📊 Recommended Trade Setups
BUY GOLD 3300-3298 Stoploss 3295
SELL GOLD 3348-3350 Stoploss 3353

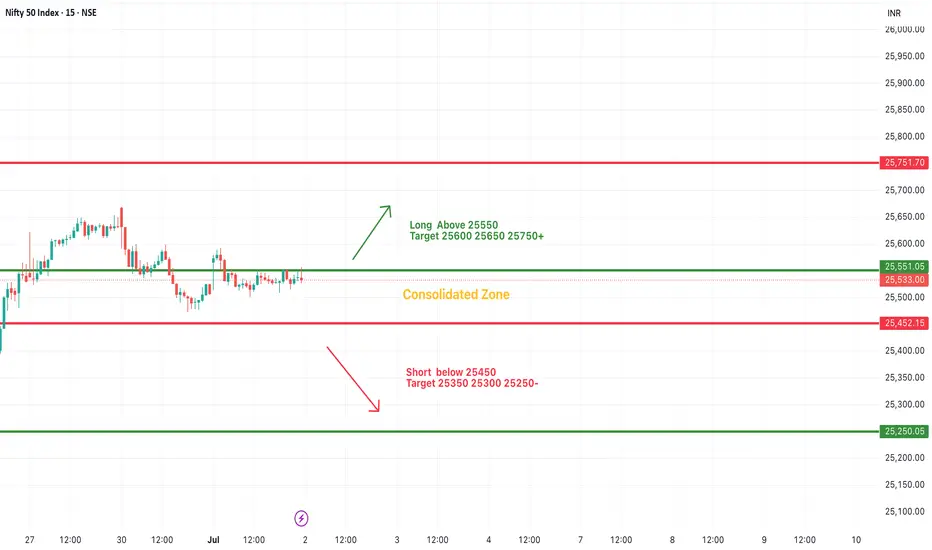
#NIFTY Intraday Support and Resistance Levels - 02/07/2025Nifty is expected to open flat near the 25,530 level, right in the middle of the consolidation zone between 25,450 and 25,550. This range has acted as a tight resistance and support band in recent sessions, indicating indecision in the market. A breakout above 25,550 can trigger bullish momentum toward 25,600, 25,650, and even 25,750+ levels, while staying within this zone may continue the sideways trend.
On the downside, if Nifty breaks below the 25,450 level, we may see selling pressure taking it toward 25,350, 25,300, or even 25,250. Traders are advised to wait for a clear breakout from this consolidation band before entering directional trades, and maintain proper risk management given the tight range and potential volatility
[INTRADAY] #BANKNIFTY PE & CE Levels(02/07/2025)Bank Nifty is expected to open flat near the 57,440 level, just below the immediate resistance at 57,450. This zone will play a crucial role in today’s session. Sustaining above 57,450 can lead to bullish momentum with potential upside targets of 57,550, 57,850, and 57,950. Traders may look for a breakout confirmation before entering long trades.
On the downside, if the index fails to sustain above the 57,450 level and reverses, support around the 57,100–57,050 zone could be tested. A move below this range might lead to a short-term decline toward 57,000 and 56,950. The market remains in a consolidation phase, and breakout from this tight zone can lead to a directional move.

Gold (XAUUSD) – Bias for July 2Yesterday, price broke above the key H4 Lower High zone (3348–3350) with strong bullish momentum.
This breakout suggests a possible shift in the higher timeframe structure — indicating that the market may now be building toward a larger uptrend.
But we don’t chase breakouts — we prepare for the pullback phase .
🔍 What to Watch:
At present, M15 remains in a clean uptrend , fully in sync with the new H4 structure.
This multi-timeframe alignment gives us a clear bullish bias — but not an entry by itself.
We now need to see how price develops the pullback.
The best trades come when structure retraces with clarity — and confirms before continuation.
📍 Key M15 Level to Track:
• 3302 – Current M15 Higher Low
→ If this level holds, we may see a continuation of the uptrend from here.
→ If it breaks, the next potential reversal zone is around 3290 , where demand may reappear.
🎯 Execution Plan:
The trend is now clearly bullish across HTF and LTF.
We will only look for long setups , and only where structure confirms — either at the current HL or at deeper demand zones.
No confirmation = No trade.
No alignment = No edge.
Let price come to you. Our job is not to anticipate, but to align.
📖 From the Mirror Philosophy:
“In trend-following, the edge lies in waiting — not in chasing.
The market will reflect your patience back at you.”
📘 Shared by @ChartIsMirror
Author of The Chart Is The Mirror — a structure-first, mindset-grounded book for traders

XAU/USD – Bullish Trend Faces Resistance at $3,350 XAU/USD – Bullish Trend Faces Resistance at $3,350 | Watch for Breakout or Pullback!
📅 Published on: Jul 01, 2025
✍️ By: MR_MARK0
🧠 Market Context:
Gold (XAU/USD) has been riding a strong bullish wave, pushing through multiple resistance levels. Currently, price is hovering just below the $3,350 resistance, which marks a critical level for either trend continuation or a potential pullback. Momentum remains in favor of buyers, but signs of exhaustion are beginning to surface.
🔍 Key Zones:
🔴 Resistance Zone: $3,350.0 – $3,352.5
🟢 Support Zone: $3,338.0 – $3,340.0
🟢 Demand Block: $3,310.0 – $3,315.0 (bullish base before recent breakout)
📌 Strategy in Play:
The chart reflects a Trend Continuation Strategy with key support/resistance zones identified. Price has shown strength, but we are now at a make-or-break level. Patience is crucial here.
🧭 Trade Idea:
🔁 Buy the Dip:
Entry Zone: $3,340 – $3,342
SL: Below $3,338
TP1: $3,352
TP2: $3,360
🔁 Breakout Play (Aggressive):
Entry: On breakout above $3,352 with bullish volume
SL: Below breakout candle low
TP: $3,360 and $3,372
⚠️ Risk Note:
Price is extended; a fake breakout above $3,350 may trigger a bull trap. If price fails and drops below $3,338, expect a corrective move toward $3,330 – $3,310. Watch volume divergence and candle rejection patterns.
01.07.25 Morning ForecastPairs on Watch -
FX:EURNZD
FX:GBPCAD
FX:EURUSD
FX:GBPJPY
A short overview of the instruments I am looking at for today, multi-timeframe analysis down to what I will be looking at for an entry. Enjoy!

Gold price analysis July 1On the D1 chart, the price has recovered positively when the candle closed above 50% of the decrease range of last Friday's session. This shows that buying power is returning and a new uptrend is forming, with the target heading towards the GAP zone around 3363.
Today's trading strategy:
Prioritize buying (BUY) if the price has a correction to the support zone of 3300.
Sell strategy should only be implemented at important resistance zones, with short-term profit expectations because the main trend is leaning towards the uptrend.
Important technical levels:
Support: 3300 - 3337 - 3360
Resistance: 3334 - 3348 - 3363

#NIFTY Intraday Support and Resistance Levels - 01/07/2025Nifty is expected to open with a slight gap up near the 25,550 level, which lies close to a minor resistance zone. If the index manages to sustain above this region, we may see a continuation of bullish momentum with potential upside levels at 25,600, 25,650, and 25,700. Holding above 25,550 would signal strength, supported by recent recovery attempts from lower levels.
However, if the index fails to hold above 25,550 and starts slipping below 25,450, weakness may creep in. A fall below 25,450 could open the door for downside targets of 25,350, 25,300, and possibly 25,250. Traders should stay cautious around the 25,550–25,600 zone for a clear directional move, with strict stop losses on both sides.

[INTRADAY] #BANKNIFTY PE & CE Levels(01/07/2025)Bank Nifty is expected to open slightly gap up near the 57,450 level, which lies close to an important resistance zone. If the index manages to sustain above this level, a further upside movement may be seen toward 57,750, 57,850, and 57,950. Strength above 57,500 could indicate bullish momentum continuation and may attract fresh buying interest.
On the flip side, if Bank Nifty fails to hold above the 57,450–57,400 zone and shows signs of reversal, a decline toward 57,250, 57,150, and 57,050 is possible. A breakdown below 56,950 will likely trigger further downside levels toward 56,750, 56,650, and 56,550. It is advised to observe price action around the 57,450–57,500 level for directional clarity in today’s session.

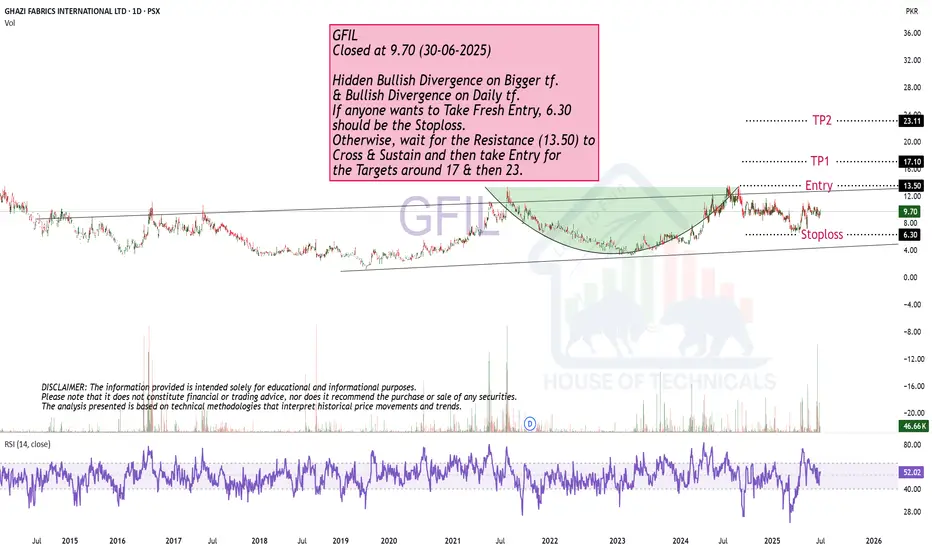
Cup & Handle Formation.GFIL
Closed at 9.70 (30-06-2025)
Hidden Bullish Divergence on Bigger tf.
& Bullish Divergence on Daily tf.
If anyone wants to Take Fresh Entry, 6.30
should be the Stoploss.
Otherwise, wait for the Resistance (13.50) to
Cross & Sustain and then take Entry for
the Targets around 17 & then 23.
EUR/AUD Falling Channel Reversal SetupThe EUR/AUD pair is currently trading inside a well-respected falling channel structure on the 15-minute timeframe. Price action has been bouncing between a descending resistance trendline and a sloping support zone, confirming the integrity of the pattern. The pair recently rebounded from the lower boundary of the channel, indicating potential short-term bullish momentum ahead.
This setup highlights a typical channel reversal bounce, offering a high-probability trading opportunity if the pair maintains upward pressure.
📈 Bullish Scenario – Intraday Channel Rebound
The price has touched the support line near 1.7885 and is now climbing higher.
Based on previous cycles, price tends to move from support to resistance within this channel.
A bounce from this level may lead to a move toward the upper channel resistance zone around 1.7960–1.7970.
The blue arrows illustrate the expected zig-zag movement within the channel.
📉 Bearish Scenario – If Support Fails
If the price breaks below 1.7880, it would indicate a channel breakdown, invalidating the bullish setup.
Such a move could lead to fresh downside targets near 1.7850 or lower, continuing the micro downtrend.
🎯 Intraday Trade Plan
Buy Setup (Reversal Play):
Entry: 1.7895–1.7905 (after candle confirmation on support)
SL: Below 1.7875
TP: 1.7950–1.7970 (channel top)
Sell Setup (on rejection or breakdown):
Entry: Near 1.7960 resistance or breakdown below 1.7880
SL: Above 1.7980
TP: 1.7850 and below
🧭 Technical Outlook Summary
Pattern: Falling Channel
Bias: Short-term bullish (reversal from support)
Key Zones: 1.7885 support | 1.7960 resistance
Watch for breakout beyond channel for directional confirmation
=================================================================
Disclosure: I am part of Trade Nation's Influencer program and receive a monthly fee for using their TradingView charts in my analysis.
=================================================================

Failed to break higher — now it’s time to crash.After a sharp rally, the market has hit its previous all-time high.
📌 A double top is now forming — signaling a potential short-term pullback.
Get ready for a possible dip — let’s go! 🚨
OANDA:GBPCAD
