Gold price analysis June 18Yesterday's D1 candle was a Doji candle. It shows the hesitation of buyers and sellers at the price near ATH.
The h4 structure is a sustainable bullish wave structure and is heading towards higher hooks.
The 3400 zone is the immediate resistance zone that Gold is heading towards. This zone will be the breakout zone for the confirmation of the candle closing above 3400.
The profit-taking reaction zone of sellers at 3415 acts as a price reaction when the price uptrend returns and creates momentum towards 3443.
On the other hand, the breakout point of 3472, if broken, will push the price to the support zone of 3343
Priceactionanalysis

#NIFTY Intraday Support and Resistance Levels - 18/06/2025Today, Nifty is expected to open with a slight gap down near the 24,850 zone, indicating caution among participants at higher levels.
🔼 If Nifty sustains above the 24,750–24,800 zone, a positive move may unfold with upside targets at 24,850 → 24,900 → 24,950+. Sustained strength above 24,950 could lead to a further rally.
🔁 On the other hand, if Nifty approaches the 24,950–24,900 zone and shows signs of rejection, it could lead to a reversal. In that case, the downside targets may be 24,850 → 24,800 → 24,750-.
🔽 A decisive move below the 24,700 level would indicate bearish control, opening further downside towards 24,650 → 24,600 → 24,550-.

[INTRADAY] #BANKNIFTY PE & CE Levels(18/06/2025)Today, Bank Nifty is expected to open with a slight gap down near the 55,650–55,700 zone, indicating early signs of consolidation within a tight range.
🔼 If Bank Nifty sustains above the 55,550–55,600 levels after opening, it could trigger a bullish move towards the targets of 55,750 → 55,850 → 55,950+.
🔽 However, if Bank Nifty approaches the 55,950–55,990 zone and shows signs of reversal, a corrective fall may follow with potential downside targets at 55,750 → 55,650 → 55,550.
🔻 A clear breakdown below the 55,450 level would indicate bearish strength, and the next downside levels to watch are 55,250 → 55,150 → 55,050-.
🚀 On the upside, if Bank Nifty manages to break out above the key resistance of 56,050, we can expect a strong rally with targets at 56,250 → 56,350 → 56,450+.

17.06.25 Morning ForecastPairs on Watch -
FX:EURUSD
FX:CADCHF
OANDA:XAUUSD
A short overview of the instruments I am looking at for today, multi-timeframe analysis down to what I will be looking at for an entry. Enjoy!

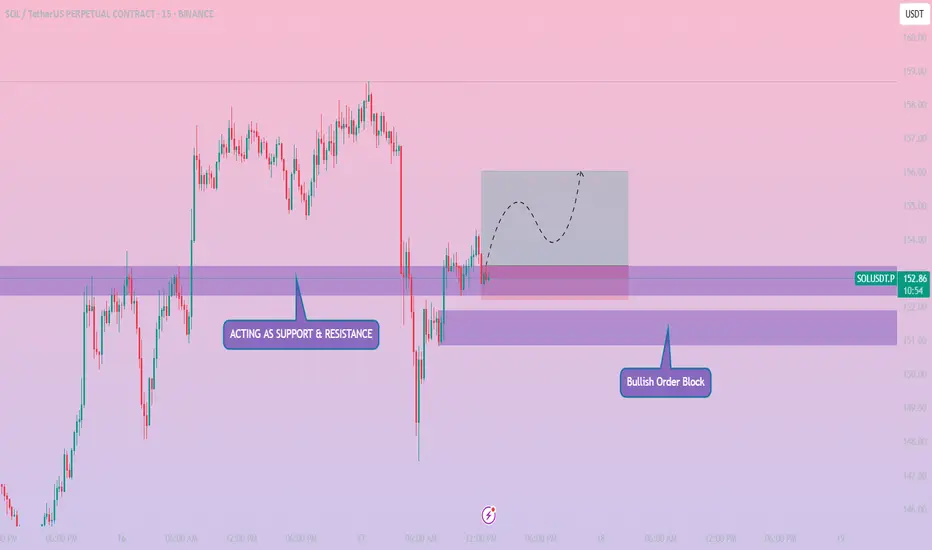
SOLUSDT // 15M // LONGPrice tapped into a previous support zone which is now acting as support & resistance flip, showing early signs of a bullish structure shift.
Just below, a clearly defined Bullish Order Block between ~151.00 and 152.20 is providing institutional demand, which strengthens this zone further.
The current entry sits slightly above this confluence, giving a high-probability long setup.
📈 Expected Price Path: Anticipating a possible liquidity grab, internal pullback inside the grey box, followed by continuation toward target liquidity around 156.00+.
🔹 Entry: 153.23 (Market Execution)
🎯 Take Profit (TP): 156.02
🛑 Stop Loss (SL): 152.22
📊 Risk-Reward Ratio (RRR): ~1:2.53
#NIFTY Intraday Support and Resistance Levels - 17/06/2025Today, a flat opening is expected in Nifty near the 24,950 level. The index has been moving in a narrow consolidation zone and currently trades just below an important resistance. If Nifty manages to sustain above the 25,050–25,100 zone after the opening, we may witness bullish momentum building up. This could lead to an upward move toward 25,150, 25,200, and possibly 25,250+ levels during the day.
However, if Nifty fails to hold above the 24,950 mark and slips into weakness, it may invite intraday profit booking. A drop below the 24,900–24,950 level could open the downside toward 24,850, 24,800, and 24,750 levels. This zone has previously acted as a support range, and any break here could intensify selling pressure.

[INTRADAY] #BANKNIFTY PE & CE Levels(17/06/2025)Today, Bank Nifty is expected to open flat near the 55,970 zone. The market has shown a steady recovery over the past few sessions, and now it stands near a crucial resistance level. If Bank Nifty manages to sustain above the 56,000–56,050 level after the opening, we may see bullish momentum picking up. This could lead to a move toward the higher levels of 56,250, 56,350, and even 56,450+ in the intraday session. A breakout above 56,050 with volume confirmation can act as a trigger for continued upside.
On the flip side, if Bank Nifty struggles to hold above 55,950 and slips below this level, it may face intraday selling pressure. A breakdown can drag the index back down toward 55,750 initially, followed by 55,650 and 55,550 if weakness persists. These levels will act as immediate support zones where short covering or fresh buying may be seen.
Overall, the index remains in a narrow range with critical levels on both ends. A directional move can emerge if either side breaks with strength. Traders should remain cautious and avoid aggressive positions near the opening. Trade with a strict stop loss and consider trailing profits once levels are achieved, as the market may remain choppy around key zones.

Gold Price Analysis June 16There is not much surprise when the price gap up appeared on Monday morning
there is no barrier that can stop the price of gold from increasing towards ATH.
Gold has a slight correction in Tokyo session after the price gap up touched the round resistance zone 3450.
The correction may extend to 3413 in European session. This is a BUY zone with the expectation that Gold will regain the ATH hook. If broken, there will be some Scalping buy zones but the risk is quite high so to be safe, wait for 3398.
3463 acts as temporary resistance for a reaction period before Gold returns to the all-time high. Maybe before 3490 there will be another price reaction before reaching the top.

Gold Trading Strategy June 16There is not much surprise when the price gap up appeared on Monday morning there is no barrier that can stop the price of gold from increasing towards ATH. Gold has a slight adjustment in Tokyo session after the price gap up touched the round resistance zone 3450.
The adjustment may extend to 3413 in European session. This is a BUY zone with the expectation that Gold will regain the ATH hook. If broken, there will be some Scalping buy zones but the risk is quite high so to be safe, wait for 3398.
In the long term, 3463 acts as temporary resistance for a reaction phase before Gold returns to its all-time high. Maybe before that, 3490 will have another price reaction before reaching the peak.
Resistance: 3428 (Scalping) - 3444 - 3463 - 3490
Support: 3413- 3298

16.06.25 Morning ForecastPairs on Watch -
FX:NZDUSD
FX:CADJPY
OANDA:XAUUSD
FX:EURCAD
A short overview of the instruments I am looking at for today, multi-timeframe analysis down to what I will be looking at for an entry. Enjoy!

#NIFTY Intraday Support and Resistance Levels - 16/06/2025Today, a slightly gap-up opening is expected in Nifty near the 24,735 level. If Nifty sustains above the 24,750–24,800 zone after the opening, it may lead to a continuation of the upside move toward 24,850, 24,900, and potentially 24,950+ during the day. This zone can attract intraday buying interest, especially if supported by volume and momentum.
However, any rally approaching the 24,950 level should be watched cautiously, as it may act as a reversal zone, triggering profit booking or intraday resistance.
On the other hand, if Nifty fails to hold 24,700 levels and starts drifting lower, fresh selling pressure could emerge, pushing the index toward 24,650, 24,600, and even 24,550 during the session.

[INTRADAY] #BANKNIFTY PE & CE Levels(16/06/2025)Today, a slightly gap-up opening is expected in Bank Nifty near the 55,550–55,600 zone. If Bank Nifty sustains above this zone, it may attempt an upside move toward 55,750, 55,850, and potentially 55,950+ levels during the session.
If Bank Nifty starts trading above 56,050, a further bullish rally can be seen, taking it higher toward the 56,250, 56,350, and 56,450+ zones.
On the downside, if Bank Nifty slips below the 55,450–55,400 zone, it may face further selling pressure, leading to a possible move toward 55,250, 55,150, and 55,050 levels.

GBPJPY Short then Long to 198.000Looking to take an intraday short depending on PA and opening of market then looking for the long setup to 198.00.

GBPNZD Important Resistance and SupportThe pair is heading towards the resistance at 2.363, which has not been tested by the sellers, so there are still many sellers waiting in this area. The uptrend could extend to 2.276, the highest peak of last month.
If the resistance at 2.263 cannot be broken, then 2.238 is the sideway border of the pair, which helps support the price increase. When it breaks out, it confirms a reversal to the downtrend.
The price reaction zone can be noted around 2.229 before touching the strong support zone at 2.220.
Support: 2.238, 2.229, 2.220
Resistance: 2.263, 2.276

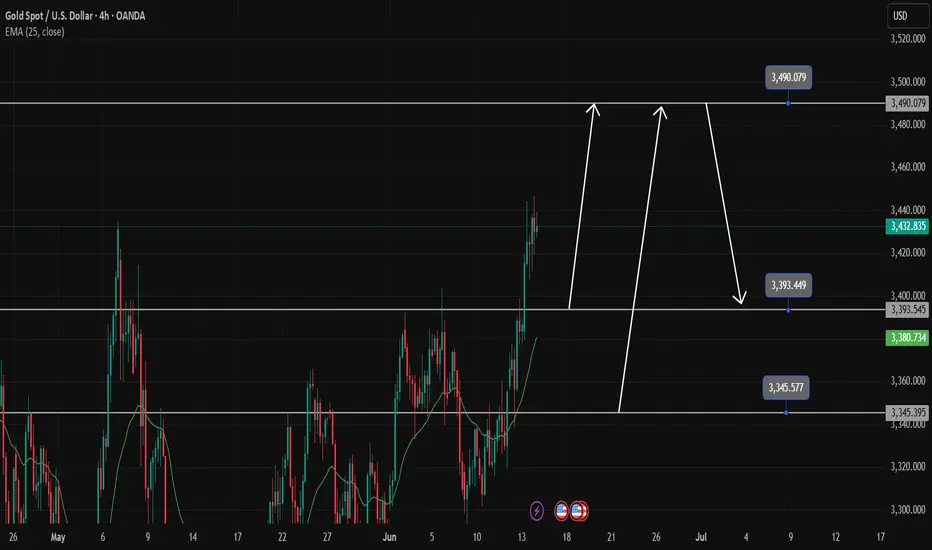
Gold price is sure to make ATH in the new weekGold confirms a long-term uptrend. The ATH 3500 zone is likely to have a reaction before 3490.
Any pullback in Gold next week is still considered a good opportunity to Buy Gold. And the bullish price gap is likely to continue on Monday.
3495 and 3345 are accumulated with many people waiting to Buy there, setting up a Buy signal with SL 10 price at the weekly support and resistance zones.
The possibility of breaking ATH next week is very high
Support 3393-3345
Resistance 3490
EURUSD is continuing its uptrendEURUSD is still in a strong uptrend. There was a drop in the Asian and European sessions on Friday but that was not enough to reverse the pair. The end of the US session saw the price being pushed up by the bulls from the 1.155 price zone and is stuck in this resistance zone.
The price continues to increase when breaking 1.155 will head towards the resistance of 1.161, the highest peak of last week. If there is a retest of 1.155, the price will head towards 1.166 next week to be able to use short-term SELL strategies
The BUY strategy is still prioritized as the EU is still in an uptrend. The main BUY zone of the pair is still waiting for 1.150 and lower is the breakout zone of 1.145
Resistance: 1.161, 1.166
Support: 1.150, 1.145

Gold trading strategy june 13Yesterday's D1 candle was bullish, confirming the continuation of the uptrend. Following that uptrend, the Asian session saw a strong price increase to a high of 3443. If there is still confirmation from the h4 candle above 3397, today will still be a bullish candle with a large amplitude at the end of the day.
After reaching a monthly high, Gold is in a bearish correction at the end of the Asian session. This correction will last until it touches the support level of 3397, which is a good BUY signal.
The target for BUY signals will be 3364 and this area will have a profit-taking reaction from Buyers, causing the price to fall. Gold may touch the pre-ATH level of 3394 and there will be a reaction.
On the other hand, there is a sweep to 3376, which is considered a daily support zone and you can buy in this area.
Support: 3398- 3376
Resistance 3464-3495

Gold Price Analysis June 13Yesterday's D1 candlestick increased, confirming the continuation of the uptrend. Following that uptrend, the Asian session saw a strong increase in price to the highest peak of 3443. If there is still confirmation from the h4 candlestick above 3395, today will still be a bullish candlestick with a large amplitude at the end of the day.
After reaching the highest peak of the month, Gold is having a downward correction at the end of the Asian session. This correction lasts until the support of 3397 to have a good BUY signal. In case you want to SELL, you must wait for a 50% test of the previous full-force downtrend H1 candle (around 3434) and the continuation of the Selling side.
If the 50% test does not appear, you must reverse to find a BUY Breakout point. Note that the False break at the peak of 3343 should wait for confirmation of the small-frame DOW wave to enter the order, which will be safer for this morning's break.
If you get a BUY order, the target will be 3364 and this area will have a profit-taking reaction from the Buyers, causing the price to decrease. Gold may touch the threshold before ATH 3394 and there will be a reaction.
In the opposite direction, there is a sweep to 3376, which is considered the daily support zone and you can buy in this area.
All SELL signals are considered obstacles, so set a short target and a new BUY signal sets a long expectation.

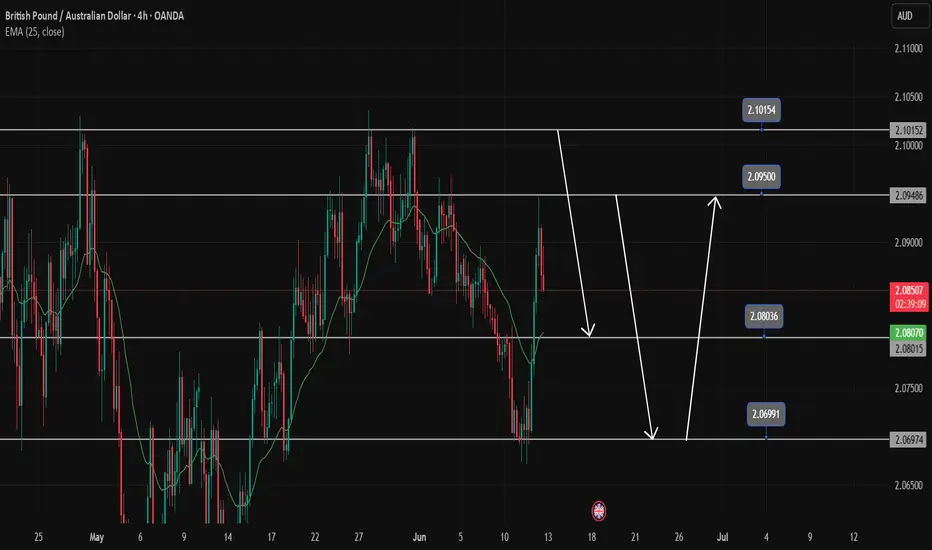
GBPAUD Trading SignalsGBPAUD is reacting at the resistance zone with this force, the downtrend will continue at 2.08000. If you want to BUY at 2.0800, you have to wait for the price reaction of the candle. If you break 2.080, you have to wait at 2.06900 for BUY strategies. In the opposite direction, the peak of 2.101 is still an important peak where you can execute the SELL strategy with the GBPAUD currency pair.
13.06.25 Morning ForecastPairs on Watch -
FX:GBPUSD
FX:EURUSD
A short overview of the instruments I am looking at for today, multi-timeframe analysis down to what I will be looking at for an entry. Enjoy!

Gold Price Analysis June 12Yesterday's D1 daily frame bounced and closed above 3348. That led to a price gap today.
3375 is a resistance zone that is showing price reaction in the Asian session. If it cannot be broken at the end of the session, it is possible to set up a sell at 3355 for BUY strategies in the GAP zone.
Any price decrease today is considered a good opportunity for buying Gold to aim for 3411.
Pay attention to the 3355-3347-3338 zone for BUY signals today. Target is still 3411 but there is still 3386 which may have a reaction.

Nvidia - The breakout will eventually follow!Nvidia - NASDAQ:NVDA - will break out soon:
(click chart above to see the in depth analysis👆🏻)
Over the course of the past couple of days, we saw a quite strong rally of +50% on Nvidia. Considering the market cap of this company, such a move is quite impressive. Following this overall very strong bullish momentum, an all time high breakout is quite likely to happen soon.
Levels to watch: $150
Keep your long term vision!
Philip (BasicTrading)

BUYCurrently Watching Price respecting BULLISH structure clean HH and HL pushing back above EMA a break and close above minor resistance could fuel momentum toward the HH target zone.
