NASDAQ 100 Long 21,900Target to the upside 21,900. We initially highlighted NASDAQ will reach 22,000 then see a bearish turn. Refer to linked Idea.
Priceactionanalysis

EUR/USD: Weekly PAT + VPA 5/11/2025Trading Analysis EUR/USD - Price Action and Volume Price Analysis
Weekly Structure Analysis: At present, we find ourselves within a bullish weekly range. The lower boundary of this range is 1.07330, established during the week of March 24, 2025, while the upper boundary is at 1.15734, reached the week of April 21, 2025. The price movement from 1.073 to 1.157 has surpassed a swing high, which we will identify as our initial resistance point as we aim to return to 1.15734.
Weekly Price Action Analysis: Analyzing structure and price action reveals similarities. Our confidence in a bullish trend is the anchored weekly bar. The weekly candle from the week of April 7, 2025 serves as this anchor. Following the inside bar, we observed a bearish pin bar, which acts as a Bullish Reacher since its wick exceeded the high of the anchor bar's wick (Wick on Wick). The market shows signs of wanting to rise, but it must first hit a demand zone that weekly traders are keen to engage with.
Volume Price Analysis: The last four weekly candles have demonstrated limited strength in driving the market lower, with support holding at 1.11927 (1.12). As the price declines, trading volume is decreasing, following a sharp upward movement, likely due to profit-taking or repositioning. Volume analysis indicated we should retest 1.15734.
Good luck and happy trading!
OANDA:EURUSD TVC:DXY

BTC is reviving for a new bull runBTCUSD is correcting to 108000 as it hits the sell zone at 101200. At 108000 it is quite clear to set up BUY signals. Another area to watch for BUY is 106500. BUY SL points are not above 700 price for BTC. Currently the uptrend is still going to continue so any pullback to support is considered a buying opportunity.

12.06.25 Morning ForecastPairs on Watch -
OANDA:JP225USD
FX:AUDJPY
FX:USDJPY
FX:GBPJPY
A short overview of the instruments I am looking at for today, multi-timeframe analysis down to what I will be looking at for an entry. Enjoy!

#NIFTY Intraday Support and Resistance Levels - 12/06/2025Today, a gap-up opening is expected in Nifty near the 25250 level. If Nifty sustains above this zone, we may see bullish momentum extending toward the targets of 25350, 25400, and potentially 25450+ during the session.
However, if Nifty fails to hold above 25250 and begins reversing below 25200, it could trigger a pullback move. A reversal short opportunity may arise in the 25250–25200 range with potential downside targets of 25150, 25100, and 25050.
Overall sentiment remains bullish above 25250, but volatility is likely near resistance levels. Traders are advised to keep tight stop-losses and trail profits cautiously, as the market may remain range-bound with occasional spikes.

[INTRADAY] #BANKNIFTY PE & CE Levels(12/06/2025)Today, a gap-up opening is expected in Bank Nifty near the 56550–56600 zone. If the index manages to sustain above this range, it may trigger an upside move toward 56750, 56850, and 56950 levels. A further breakout above 57050 could extend the bullish rally toward 57250, 57350, and possibly 57450+ during the session.
However, if Bank Nifty fails to hold above 56550 and begins to trade below 56450, a downward move could unfold toward 56250, 56150, and 56050 levels. Any sustained weakness may increase selling pressure, dragging the index further down intraday.

Microsoft - This might be the ultimate breakout!Microsoft - NASDAQ:MSFT - will break the all time high:
(click chart above to see the in depth analysis👆🏻)
If you wonder why Microsoft has been rallying +15% this month, market structure will give you an answer. In fact, the recent bullish break and retest was totally expected, and if we take into account the recent quite strong bullish behaviour, an all time high breakout will follow soon.
Levels to watch: $450
Keep your long term vision!
Philip (BasicTrading)

11.06.25 Morning ForecastPairs on Watch -
PEPPERSTONE:COCOA
FX:GBPAUD
FX:CHFJPY
A short overview of the instruments I am looking at for today, multi-timeframe analysis down to what I will be looking at for an entry. Enjoy!

Gold Price Analysis June 11Yesterday's D1 candle was still a balance candle closing below the important breakout zone 3347.
Today's Asian session saw strong buying pressure pushing the price back close to the important resistance zone in shaping the trend. At the end of the Asian session, it failed to break 3342, giving a SELL signal to 3327
The breakout zone 3310 is also very important to wait for price reaction for BUY scalping points. 3295 is an important daily support zone. If there is a price slide from 3295, do not BUY until it touches the support zone 3275.
In the opposite direction of today's Break 3345, wait for 3363-3365 to SELL. The 3345 zone is considered a Breakout zone when broken to trade BUY.

#NIFTY Intraday Support and Resistance Levels - 11/06/2025Nifty opened with a slight gap-up near the 25100 level, continuing its recent pattern of consolidation. Despite the positive opening, the index remains well within its established range, suggesting that market participants are still awaiting a decisive breakout. There are no major changes observed in key support or resistance levels compared to the previous sessions, reinforcing the view that the market is currently lacking strong directional momentum.
On the upside, if Nifty sustains above the 25100–25250 zone, it could attempt a move toward 25350, followed by 25400 and potentially 25450+. However, this upward move will require strong follow-through buying to break the current consolidation zone. Until then, any intraday rallies may face resistance near the 25250 mark, making it a crucial level to watch for bulls.
Conversely, failure to hold above the 25200–25250 region could lead to a reversal toward 25150, and if selling pressure intensifies, a further decline toward 25100 and 25050 may unfold. These levels are important short-term supports and have previously acted as buying zones. A break below 25050 may open the gates for deeper cuts, though that remains unlikely unless broader market sentiment weakens.

[INTRADAY] #BANKNIFTY PE & CE Levels(11/06/2025)Bank Nifty is opening with a slight gap-up around the 56650–56700 zone, continuing its consolidation phase from the previous sessions. The index has been oscillating within a narrow range, reflecting indecision among market participants. Today’s early movement suggests that unless there is a clear breakout or breakdown, the sideways momentum may persist. If Bank Nifty manages to sustain above the 56650 level, it could attempt an upside toward 56750, 56850, and possibly 56950+.
A stronger bullish breakout would be confirmed only if the index crosses and holds above 57050. On the other hand, failure to hold above 56600 and a breakdown below 56450 may trigger a short-term correction toward 56250, 56150, and 56050.
Given the tight structure, traders should remain cautious, avoid aggressive entries, and focus on quick trades with defined stop-losses and targets.

Bitcoin - Here we have the all time high!Bitcoin - CRYPTO:BTCUSD - is just getting started:
(click chart above to see the in depth analysis👆🏻)
It was really just a matter of time until we see a new all time high on Bitcoin. Consindering that over the past two months alone, Bitcoin rose another +50%, this was a clear indication that bulls are taking over. But this all time high is clearly not the end of the bullrun.
Levels to watch: $300.000
Keep your long term vision!
Philip (BasicTrading)

USDJPY higher bullish for exepct
FX:USDJPY PA based analysis, price is bounce few times on bottom line of PA, last we have bullish push with short revers till zone 144.000, which taking here for sup zone from which expecting higher bullish continuation.
Technicalls are here same strong bullish for expect
SUP zone: 144.000
RES zone: 146.900

Gold Trading Strategy June 10Gold price in D1 frame reacted at EMA and Trend zone yesterday and bounced back but at the end of the day still closed below the 3335 breakout zone. The downtrend can still continue as long as 3335 remains stable today.
Looking at H1, it is still in a fairly clear downtrend. 3327 is the area that is currently in dispute. 3310 is the resistance zone that Gold broke through in the Asian session. To BUY this area, you must wait for price reaction and confirmation from the candle. Breaking 3309, Gold will head towards today's important support 3295. This is a good zone for BUY signal. The daily support zone around 3275 will prevent any excessive price slide of Gold.
On the other hand, when the buyers push the price strongly through 3327, you must wait for the US session resistance around 3338 yesterday for a SELL signal. (H1 does not break through 3328, we can set up SELL with the confirmation of selling force) Breaking 3338, the bearish structure will no longer exist, the market will switch to a short-term uptrend towards 3364.
Resistance 3337-3364-3374
Support 3310-3295-3275
Wish you successful trading. If you do not understand the strategy clearly, you can contact me for support.

Gold Price Late LonDon Session Trading StrategyGold is looking for support at 3314 in the late European session. If Gold breaks 3314, it will look for a daily trading plan around 3295. Note that 3314 will give a BUY signal if there is a reaction from the buyers. Target for BUY signals 3335 today

10.06.25 Morning ForecastPairs on Watch -
FX:GBPJPY
FX:EURJPY
FX:USDCHF
A short overview of the instruments I am looking at for today, multi-timeframe analysis down to what I will be looking at for an entry. Enjoy!

Gold Price Analysis June 10Gold price reacted at the Trenline and EMA 34 yesterday and bounced back but still closed below the breakout zone of 3335.
The downtrend can still continue as long as 3335 remains strong today.
H4 shows the provincial port area at 3295 and 3275 in the opposite direction of the provincial port at 3339 and 3365.
H1 is still forming a clear downtrend. 3309 is the immediate resistance zone. is the price zone that can scalp breakout if it closes above this zone. break 3309 Gold will head to 3327 in this zone, if you want to SELL, you have to wait for confirmation from the selling candle. When the buyers push the price strongly through 3327, you have to wait for the US session resistance around 3338 yesterday. Resistance and support during the day are noted around 3275 and 3365

Gold price analysis on June 9The D1 candle on Friday broke the sideways structure and confirmed the downtrend for Gold prices.
Gold prices pushed up quite high in today's Tokyo trading session after touching the Gap zone around 3395.
With this upward force, 3319 will be available at the end of the Asian session. This zone can wait for a reaction and SELL can return because this is the zone where the Sellers pushed the price down at the beginning of the session. The European session will pay more attention to the 3334 zone with a break out point that is also quite important. The upward force will be stopped by the Sellers at the daily resistance level around 3345.
SELL is following the trend and can sustain the profit far away, while the BUY points are considered to find the reaction wave to increase and correct. The first zone is 3295, the second zone is around 3275.
Wishing you a successful trading day

#NIFTY Intraday Support and Resistance Levels - 10/06/2025Nifty is opening with a gap-up near the 25250 level, approaching a crucial resistance zone. This area has previously acted as a turning point, and today's opening could define whether bulls retain control or face exhaustion.
If Nifty sustains above 25250, we can expect further upside momentum toward 25350, 25400, and 25450+. A clean breakout above this level could open the path to short-term bullish continuation.
However, if the index struggles to hold above 25250 and reverses, profit booking may kick in, pulling the index back toward 25150, 25100, and even 25050.
Holding above 25050–25100 will be key for maintaining a positive structure. A breakdown below this zone may shift sentiment in favor of bears.

[INTRADAY] #BANKNIFTY PE & CE Levels(10/06/2025)Bank Nifty is expected to open with a gap-up around the 57000 level, placing it directly at a critical resistance zone. This area has previously acted as a rejection point, making today's price action especially significant.
If the index sustains above 57050, it may trigger a fresh bullish leg with potential upside targets at 57250, 57350, and 57450+. Strong momentum above this range could lead to continued buying pressure through the session.
However, if Bank Nifty fails to hold above 57000 and starts rejecting the zone, a reversal may play out. In that case, downside movement toward 56750, 56650, and 56550 can be expected.
Holding above 56550–56600 is essential to maintain bullish structure. If the price dips below that, short-term weakness may extend.

Gold Trading Strategy June 9The D1 candle cluster on Friday broke the sideway structure near the AHT peak and confirmed the downtrend for Gold price by breaking through 50% of the main bullish candle on June 2.
After touching the Gap zone around 3395. Gold price pushed up quite high in Tokyo trading session today and headed towards the first resistance levels around 3319. This area can wait for reaction and SELL to return because this is the area where the Sellers accumulated quite strongly at the beginning of the session.
The European session will pay more attention to the 3334 area with a breakout point also quite important on Friday. If from 3334 the gold price falls, it will form a strong fall according to the downtrend structure and head towards 3275 soon.
SELL is following the trend and can sustain profits far away, while BUY points are considered to find a corrective reaction wave, so narrow expectations.
Support: 3295, 3275
Resistance: 3319, 3334, 3345, 3359
Wish you a successful trading day

GBPUSD [Possible longsHere' how I'm watching GBPUSD for a potential buy trade. I reckon the buy would hold, although I'd be risking 0.5% of my equity because we didn't see the market take out previous high with deliberate candle closes, and that could mean that there are sellers lurking somewhere around.
However, until the sell is confirmed, the trend is our friend.
DYOR

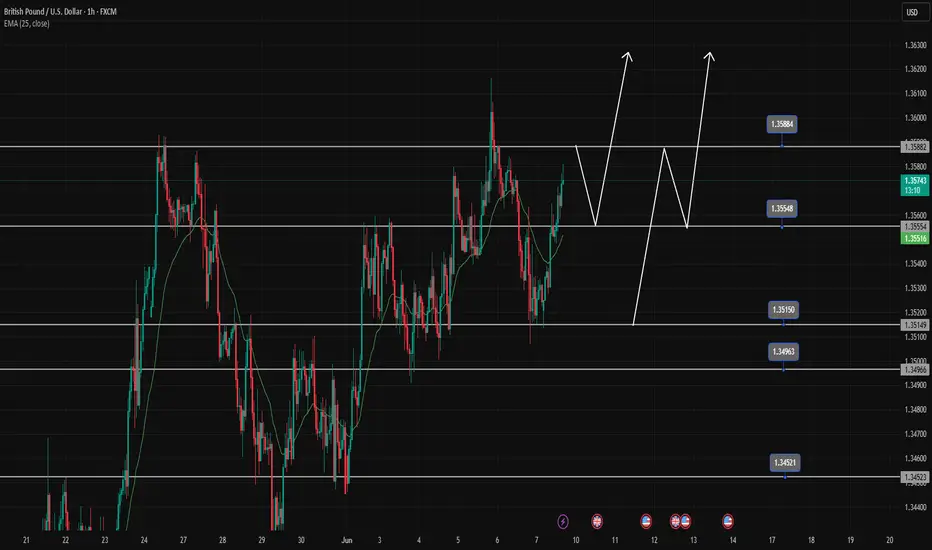
Buy opportunity when price retraces to break the topGBPUSD encounters resistance at 1.358, there is a high possibility that there will be a price reaction to 1.35500 to create a Dow break 1.358 towards higher levels.
GBPUSD is increasing very strongly again in the main trend, we wait for a retracement to the support zones, which is a strong buying opportunity.
1.358-1.355-1.351-1.345 are BUY zones when the price has a reaction of buying force at these price zones.