#NIFTY Intraday Support and Resistance Levels - 09/06/2025Nifty is opening with a gap-up above the 25050 level, continuing the recent bullish momentum. The index has broken out of its previous range and is now hovering near a key breakout zone.
If Nifty sustains above 25050–25100, we could see further upside toward 25150, 25200, and 25250+. A clean breakout above 25250 may unlock extended targets at 25350, 25400, and 25450+.
However, if the index fails to hold above 25000 and slips back below 24950, it could lead to a short-term pullback. In that case, expect downside toward 24850, 24800, and 24750.
Priceactionanalysis

[INTRADAY] #BANKNIFTY PE & CE Levels(09/06/2025)Bank Nifty is opening with a gap-up near the 56900 level, right into a critical resistance zone. While momentum is strong, the index is now approaching a potential reversal area.
If Bank Nifty sustains above 57050, we could see a continuation of the bullish trend with upside targets at 57250, 57350, and 57450+. A strong breakout above this zone could trigger fresh buying.
However, if the index fails to hold above 56900–57000 and starts to reverse, it may signal short-term exhaustion. In that case, a pullback toward 56750, 56650, and 56550 is possible.
A breakdown below 56450 would suggest weakness, exposing downside targets at 56250, 56150, and 56050.

AJA's Gold view. The Bear is in charge for now.Just the start of the Bearish move.
Like I analysed. For now, we're selling till 3315.
Check my last analysis. What do you think?

06.06.25 Morning ForecastPairs on Watch -
FX:EURUSD
FX:AUDUSD
FX:USDJPY
FX:AUDCAD
A short overview of the instruments I am looking at for today, multi-timeframe analysis down to what I will be looking at for an entry. Enjoy!

Gold Price Analysis June 63 D1 candles closed without breaking through 50% of the previous bullish main candle. Today's main view will be BUY up to 34xx
Today's resistance is around 3413 for the SELL strategy of the US Session. The Asian and European Session is looking for a BUY point. There was just a nice BUY beat around 3363 where the price swept liquidity to 3369.
3382 is the target for the BUY order and this area can SELL Scalp in today's Asian and European session because today's target is up to 3413.
In the direction of Gold Down, contrary to the analysis, the support zone 3341 and support 3324 will support the upward force of gold prices.
Breakout boundary zone 3382 and 3341. Note that the break out does not block the train

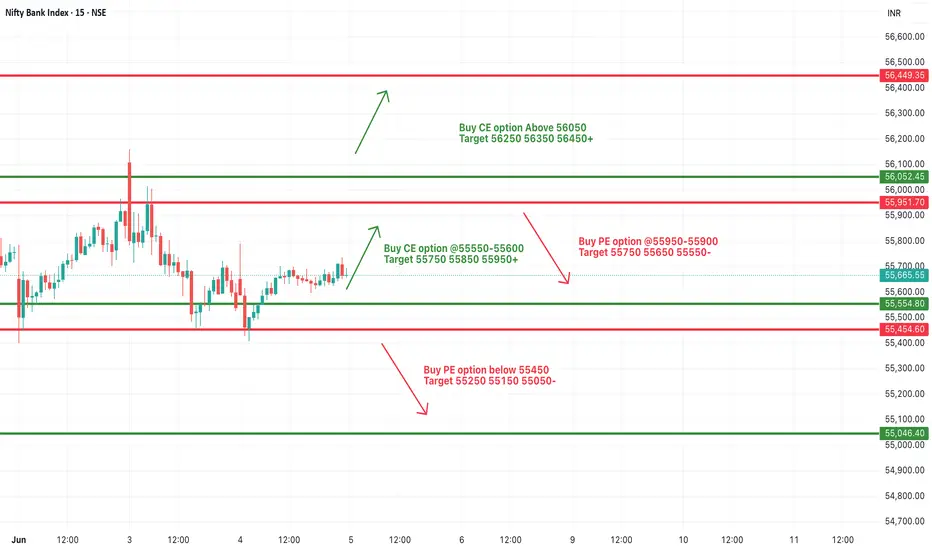
[INTRADAY] #BANKNIFTY PE & CE Levels(06/06/2025)Bank Nifty is opening with a slight gap-up around 55800, but continues to consolidate in the same range that has held for the past few sessions. Despite attempts, no significant breakout or breakdown has occurred, indicating indecision and a potential buildup for a larger move.
Upside continuation will only be confirmed if the index sustains above 56050, opening room for a move toward 56250, 56350, and 56450+.
On the other hand, if price starts slipping back below 55900–55850, the index may retrace toward 55750, 55650, and 55550. Breakdown below 55450 will be a clear sign of weakness, targeting 55250, 55150, and 55050.

#NIFTY Intraday Support and Resistance Levels - 06/06/2025Nifty is opening with a slight gap-up around 24750–24760, placing it just above a key resistance-turned-support level. This setup suggests early optimism, but follow-through momentum is crucial for confirmation.
If Nifty sustains above 24800, it may pave the way for a smooth upside toward 24850, 24900, and 24950+. This range could act as a momentum zone for intraday buyers if volume supports the move.
On the flip side, a slip back below 24700 may signal weakness and open downside targets at 24650, 24600, and 24550, pulling Nifty back into a broader consolidation range.

Gold Price Analysis May 6D1 Frame
It is not surprising that the price has increased again. If this momentum continues, the 3408 level can be reached today.
H1 Frame
The uptrend is clear, heading towards the area above 3400.
3363 is a good support zone, suitable for BUY orders in the Asia - Europe session.
3344 is an important level. If broken, the short-term uptrend will be broken and we need to wait for a new wave.
Resistance to watch
3382 is the nearest resistance zone in today's session.
3397 is an area prone to false breaks (old peaks). The price may react slightly here before reaching the 3408 level.

Trading strategy in US sessionGold price in the short term of the US session. The pulling of the h1 candle's wick creates an important liquidity zone of 3373. When h1 closes above this zone, it confirms that the US session will be a bullish session and can reach 3398 at the end of the session. If it closes below 3373, the BUY zone will be noticed at the support reaction in the European session around 3362.

Gold Trading Strategy Overview June 5There is not much surprise with the D candlestick having increased again. The increase can completely reach 3408 today.
The H1 wave structure also shows that the trend is increasing strongly and heading towards above 3400. 3363 is considered the first BUY support zone in the Asian and European sessions today.
3344 is the most important boundary zone of the trend, breaking this zone will cause the uptrend to break to 3400 in the short term and must wait for new uptrend waves.
In the opposite direction, 3382 is the resistance zone of the Asian and European sessions today and is also the breakout zone, this zone will reach above 3400 but before that there will be a reaction around 3397, which is a very likely flash break zone of the previous peak.
Resistance: 3382-3397-3410
Support: 3363-3344-3325-3317
Pay attention to trading at support and resistance zones when there is confirmation

05.06.25 Morning ForecastPairs on Watch -
FX:AUDUSD
OANDA:XPTUSD
A short overview of the instruments I am looking at for today, multi-timeframe analysis down to what I will be looking at for an entry. Enjoy!

EURUSD Analysis | Potential Breakdown AheadHello Traders
The pair has been respecting a rising parallel channel after breaking out from a consolidation zone earlier this month.
🔹 Current Price: 1.1409
🔹 Trend: Uptrend within a rising channel
🔹 Key Observation: Price is testing the upper range but showing signs of weakness.
🔍 Technical Breakdown:
Price recently failed to make a new high, showing signs of exhaustion.
A break below the channel support could trigger a sharp move downward.
Two strong support levels are in focus:
1.12308 (short-term target)
1.10812 (major target)
📉 Bearish Scenario:
If we get a confirmed break below the channel, I’ll be looking for short opportunities with the first target at 1.1230, and if momentum continues, down to 1.1080.
⚠ Watch for rejection candles or a strong bearish close below the channel support to confirm the move.
💬 What’s your bias on EUR/USD? Are you trading this potential setup?
#EURUSD #Forex #TechnicalAnalysis #PriceAction #TradingView #ChartAnalysis

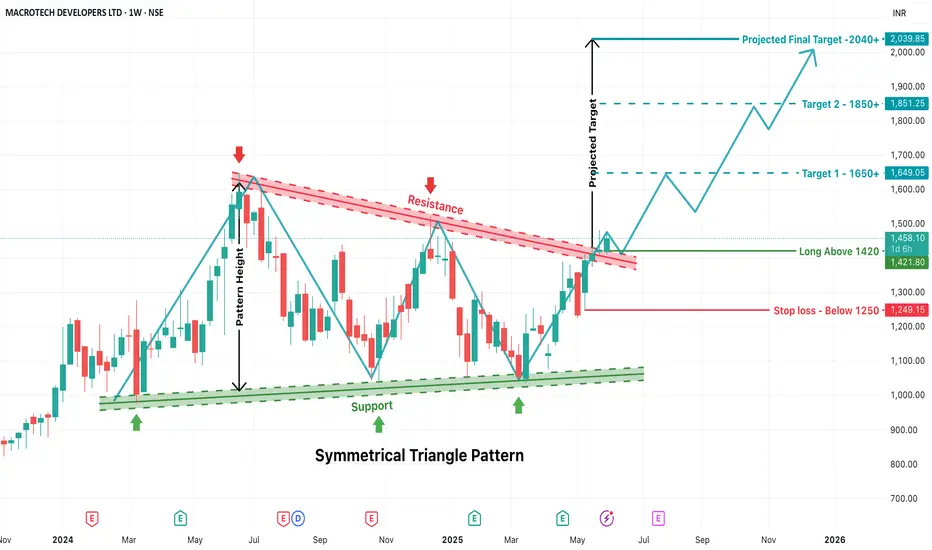
LODHA - Symmetrical Triangle Breakout Trade SetupAbout Pattern:
A Symmetrical Triangle Pattern is a continuation chart pattern formed when price action creates lower highs and higher lows, converging toward a point. It reflects indecision and compression in price before a breakout occurs. The breakout can be on either side, but here, a bullish breakout has occurred.
Support Line: Formed by connecting the swing lows (green arrows), which are gradually increasing.
Resistance Line: Formed by connecting the swing highs (red arrows), which are gradually decreasing.
This convergence of support and resistance forms the triangle.
Breakout Confirmation
Breakout Level: ₹1420
The stock has clearly broken out above the resistance trendline, indicating a strong bullish signal on the weekly timeframe.
Entry and Stop Loss Strategy
Entry Point: Enter the trade only above ₹1420 after confirmation of breakout. This acts as a psychological and technical barrier.
Stop Loss (SL): Set below ₹1250, which is well below the previous swing lows and triangle support. This acts as a safety net in case of a false breakout or reversal.
Target Calculation – Based on Pattern Height
Pattern Height:
Calculated from the highest swing high inside the triangle to the lowest swing low.
This vertical distance is then added to the breakout point (₹1420) to estimate the price targets.
Target 1: ₹1650+
This is the first resistance zone post-breakout and a psychologically important round number.
Target 2: ₹1850+
Based on the full extension of the pattern height and intermediate resistance zone.
Final Projected Target: ₹2040+
This is the complete projection of the triangle pattern height.
This setup is suitable for:
Swing traders looking for positional opportunities
Investors seeking breakout confirmation for fresh entries
Trend followers waiting for consolidation breakouts
Once price sustains above ₹1420, the stock is expected to follow a bullish trajectory toward ₹1650–2040+ over the coming weeks/months.
USD/JPY Triangle Squeeze – Watch for Breakout or BreakdownThe USD/JPY pair is currently trading within a symmetrical triangle pattern, with a descending resistance line (red) and a rising support line (green), clearly defining a consolidation phase. This type of price structure indicates growing indecision in the market, where buyers are stepping in at higher lows, while sellers are capping gains at lower highs. Such formations usually precede a strong breakout or breakdown move, as pressure builds up toward the apex of the triangle.
🔼 Bullish Breakout Scenario
If the price breaks above the descending resistance trendline, it will confirm a bullish breakout from the triangle. This would signal that buyers are regaining control and could trigger an impulsive rally toward the 145.50–146.50 area. The upside potential is supported by the structure of higher lows forming from May 27th onward, suggesting building bullish pressure. A successful breakout above 143.30–143.50, ideally with a retest and bullish candle confirmation, could offer a high-probability long setup with targets extending toward the previous swing highs.
🔽 Bearish Breakdown Scenario
On the flip side, if the price breaks below the rising support line, a bearish continuation could unfold, targeting levels as low as 140.00–139.50. This would indicate that sellers have overcome the ascending demand and could lead to a retest of prior support levels. A breakdown below 142.30 with strong bearish volume would be a key signal to short, especially if the market rejects further attempts to climb back into the triangle zone.
🧠 Strategy Outlook
This is a neutral setup until either side is broken. Traders should wait for confirmation of breakout or breakdown before entering. Once confirmed, a simple breakout trading strategy can be applied:
For longs: buy after breakout and retest above resistance
For shorts: sell after breakdown and retest below support
Stop losses can be placed just below the support for bullish trades and just above the resistance for bearish ones, ensuring clean invalidation levels.
=================================================================
Disclosure: I am part of Trade Nation's Influencer program and receive a monthly fee for using their TradingView charts in my analysis.

[INTRADAY] #BANKNIFTY PE & CE Levels(05/06/2025)Bank Nifty is opening slightly gap-up around the 55650–55700 zone, hinting at a cautious positive bias. However, the index remains within a well-defined range, and today’s session could act as a trigger for the next directional move.
If Bank Nifty sustains above 55600, bullish momentum may build toward 55750, 55850, and 55950+. A breakout above 56050 could further accelerate the upside, potentially targeting 56250 and beyond.
However, if the index fails to hold above 55700 and starts reversing, a pullback toward 55600 and 55500 is possible.
A breakdown below 55450 would signal weakness and open up downside levels toward 55250, 55150, and 55050, where stronger support is expected.
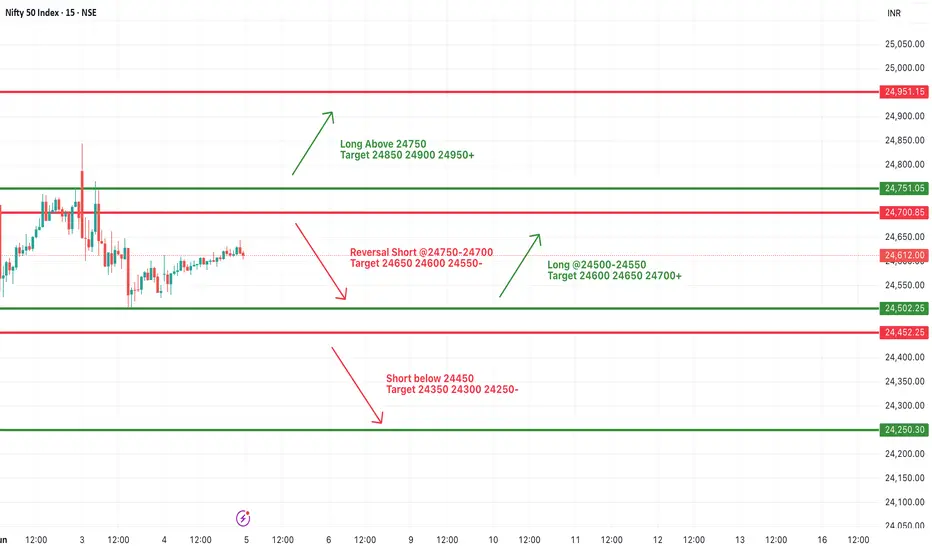
#NIFTY Intraday Support and Resistance Levels - 05/06/2025Nifty is opening with a gap-up near the 24750 level, placing it right at the breakout zone. If the index sustains above 24750, a bullish rally may follow with upside targets of 24850, 24900, and 24950+. Sustained momentum above this level can shift market sentiment toward a more positive bias.
However, traders should be cautious of a reversal from the 24750–24700 zone. If the index fails to hold and reverses downward, a short trade setup could be considered with downside targets of 24650, 24600, and 24550.
In case of further weakness below 24450, the trend may extend on the downside with targets at 24350, 24300, and 24250.
This is a critical level to watch. Wait for a decisive breakout above 24750 or a reversal signal before taking directional trades. Use strict stop-loss and manage positions actively, especially in early session volatility.
Making HH HL.
Closed at 40.45 (04-06-2025)
Making HH HL.
Bearish Divergence played well &
dragged the price from 44 - 45 to around 33.
Printed HL & started moving upside.
If 45 is Crossed & Sustained, we may witness
new Highs around 55 - 57.
However this time, Stoploss should be 33.50
on Closing basis.

Inverse H&S pattern.Closed at 16.75 (04-06-2025)
Inverse H&S pattern.
Sustaining 16.45 may lead it
towards 18.70 - 19 initially
& then 20.50 - 21.50
Stoploss is Must!

CADJPY UpdateAs anticipated, price has rejected the horizontal level and is now pulling back into a key demand zone on the H1–H4 timeframe.
I’m watching this area closely for bullish confirmation to take a long position toward the upper target zone. If bullish price action does not appear and bearish momentum continues, we could see an extended move down toward the weekly 100.00 level.
That said, I currently favor the upside scenario, with the expectation that the highlighted upper zone will be met — but only if the market confirms.
This setup is still theoretical. Patience is key — we trade based on confirmation, not assumption. Stay tuned for updates.

Simple yet effective strategy for the American sessionHello everyone. Also a long-time trader who has just joined the tradingview platform. Hope you are interested and interact with me.
Gold is reacting in the candlestick area of the US session. The possibility of a bounce from this 3352 area is quite high.
And in the US session, if it breaks 3361, it can reach 3375. If this 3352 area is broken, the possibility of a corrective downtrend will continue and we will wait for a sell break of 3352, the target can reach 3325.

04.06.25 Morning ForecastPairs on Watch -
FX:EURUSD
FX:USDJPY
FX:GBPCHF
OANDA:XPTUSD
A short overview of the instruments I am looking at for today, multi-timeframe analysis down to what I will be looking at for an entry. Enjoy!

BTCUSD Breakdown Alert | Bearish Momentum Setup in PlayHello traders!
After a strong uptrend, BTCUSD has now broken below the ascending trendline and is retesting from the underside — a classic bearish continuation signal. This could mark a key shift in market structure.
🔍 Key Observations:
Initial consolidation acted as a launchpad for the prior move.
Clean uptrend with higher highs and higher lows.
Recent trendline break suggests weakening bullish momentum.
Price is currently retesting the trendline from below — often a signal of incoming downside if confirmed.
📉 Bearish Scenario:
If this retest holds, BTCUSD may drop toward $105,000, with the next major support around $102,400. A break below that zone could accelerate the downtrend.
Targets / Support levels
Short-term: $105,000
Major support: $102,400
⚠ Risk Management:
Stick to your trading plan — use stop-losses and size positions carefully. No setup is guaranteed. Follow price action, not the hype.
📊 What’s your bias? Bullish or Bearish?
👍 Like & 🔔 Follow for more technical setups!
#CryptoAnalysis #BTCUSD #TrendlineBreak #TechnicalAnalysis #BearishSetup #TradingView #SupportAndResistance #PriceAction

#NIFTY Intraday Support and Resistance Levels - 04/06/2025Nifty is opening with a gap-up near the 24700 level, placing it right at a key decision zone. If the index sustains above the 24750–24800 resistance band, it could trigger a bullish breakout with intraday upside targets of 24850, 24900, and 24950+.
However, if Nifty fails to hold this gap-up and slips back below 24700, it could quickly turn into a false breakout. A breakdown below 24700 may invite selling pressure with targets at 24650, 24600, and 24550.
Since the gap-up is near a resistance threshold, early volatility is expected. Wait for confirmation of direction with price-action and volume before taking any directional trade. Use strict stop-loss and consider partial booking around each target zone.
