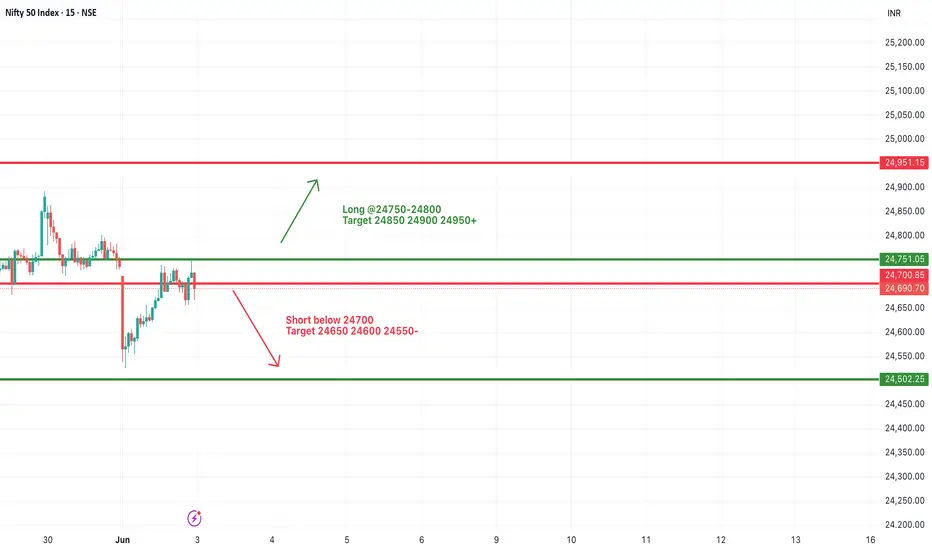
#NIFTY Intraday Support and Resistance Levels - 04/06/2025Nifty is opening with a gap-up near the 24700 level, placing it right at a key decision zone. If the index sustains above the 24750–24800 resistance band, it could trigger a bullish breakout with intraday upside targets of 24850, 24900, and 24950+.
However, if Nifty fails to hold this gap-up and slips back below 24700, it could quickly turn into a false breakout. A breakdown below 24700 may invite selling pressure with targets at 24650, 24600, and 24550.
Since the gap-up is near a resistance threshold, early volatility is expected. Wait for confirmation of direction with price-action and volume before taking any directional trade. Use strict stop-loss and consider partial booking around each target zone.
Priceactionanalysis

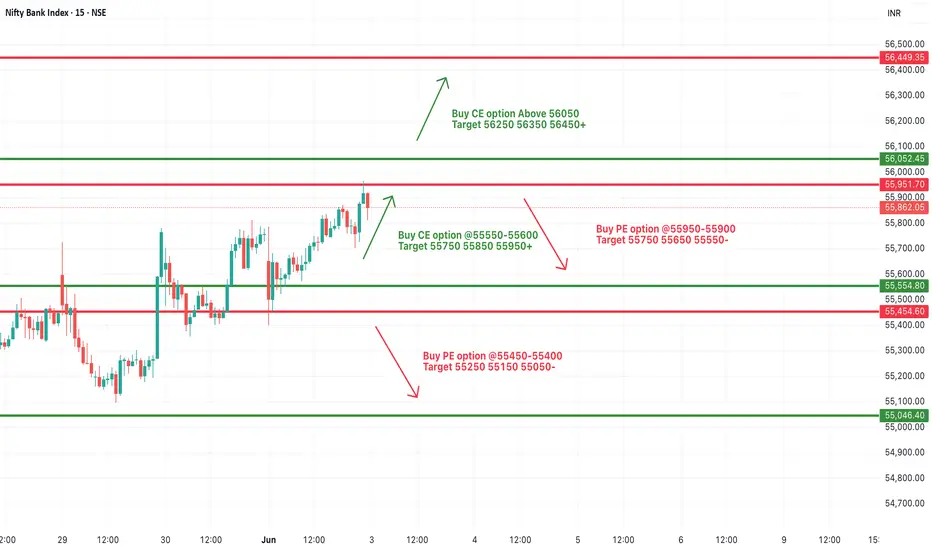
[INTRADAY] #BANKNIFTY PE & CE Levels(04/06/2025)Bank Nifty is expected to open with a gap-up near the 55950 level, which places it at a critical resistance zone. If it sustains above this level, it may extend the bullish momentum toward 55750, 55850, and 55950+, but more importantly, a breakout above 56050 would trigger a fresh upside rally with targets at 56250, 56350, and 56450+.
However, if Bank Nifty fails to hold above 55900–55950 and reverses below this zone, a short trade setup may activate, with potential downside targets of 55750, 55650, and 55550.
Further weakness can be confirmed only if the index slips below the 55550–55600 support zone, exposing it to 55250, 55150, and 55050 levels.

CADJPY LongPrice recently broke structure to the upside (BoS), confirming a bullish shift in momentum after forming a double bottom around the 101.50–102.00 region.
Currently, price is consolidating beneath the 104.90–105.00 resistance area, with a clear lower timeframe supply zone just above. If bulls sustain pressure, we could see a short-term rally toward the 106.00 zone, where the next supply awaits.
However, the key level to watch is 107.600, aligning with a major Daily Timeframe Supply Zone. This zone may act as a strong reversal point or profit-taking area for swing traders.

EURUSD is looking for price reactionEURUSD is facing the support zone of 1.138. The price reaction of the buyers is jumping into the market, you think this is a nice BUY signal.
You can set up a BUY signal for the pair towards the target of 1.141 in the short term.
In case the h1 candle closes below 1.138, you have to wait for the next BUY zone around 1.134 to be able to BUY and aim for the original target

03.06.25 AUDUSD Trade Recap (Breakeven Manual Close)A long position taken on AUDUSD for a breakeven manual close, full explanation as to why I made this decision in the recap and my current thoughts on this pairs next move

Gold Price Analysis June 3D1 candle confirms strong price increase by breaking the previous selling zone around 3365 and breaking the trendline structure
On the h4 time frame, it shows quite nice price increase waves. On h1, it shows that this morning's Asian session has profit-taking waves from sellers, leading to gold prices worth retesting important support zones.
3353 has reacted once, many zones are considered buying opportunities today. 3332, 3325, 3315 are considered price reactions for long-term BUY signals today, which can push up to 34xx
If 3353 remains stable, Gold will push up to 3390 to react once before touching the daily resistance zone around 3408

03.06.25 Morning ForecastPairs on Watch -
FX:EURUSD
FX:GBPAUD
FX:AUDUSD
FX:AUDCAD
A short overview of the instruments I am looking at for today, multi-timeframe analysis down to what I will be looking at for an entry. Enjoy!

#NIFTY Intraday Support and Resistance Levels - 03/06/2025Nifty is expected to open flat near the 24700 mark, continuing its sideways trend from previous sessions. The index is currently hovering just below the key resistance zone of 24750–24800. A breakout above this level can trigger bullish momentum with upside targets of 24850, 24900, and 24950+. Sustained strength may push the index further toward the 25000–25050 area.
However, if Nifty fails to hold and breaks below 24700, it could lead to bearish pressure. A confirmed breakdown may open downside targets of 24650, 24600, and 24550. Further decline could test the next major support at 24500–24450 levels.
As the market remains range-bound, traders are advised to wait for breakout confirmation with strict stop-loss. Watch for volume and momentum near breakout zones to avoid false signals.
[INTRADAY] #BANKNIFTY PE & CE Levels(03/06/2025)Bank Nifty is expected to open flat around the 55850–55900 zone, continuing near the same levels as the previous session. The index is currently trading in a tight range, indicating potential breakout or reversal zones are nearing.
If Bank Nifty sustains above the 55550–55600 zone, bullish momentum could continue toward 55750, 55850, and 55950+. A clear breakout above 56050 would confirm a fresh upward leg, with extended targets at 56250, 56350, and 56450+.
On the downside, if Bank Nifty slips below 55900–55950, a minor correction is possible with short targets at 55750, 55650, and 55550. Further weakness would only be confirmed below 55450–55400, exposing the downside to 55250, 55150, and 55050.
02.06.25 Morning ForecastPairs on Watch -
FX:AUDUSD
FX:USDJPY
FX:EURGBP
A short overview of the instruments I am looking at for today, multi-timeframe analysis down to what I will be looking at for an entry. Enjoy!

Gold Price Analysis June 2With the recovery waves of the D1 frame, the position of Gold returns to the wide Sideway near the ATH zone
3360 and 3260 sideway 100 price for the current trend. And today it is still possible to break this zone.
GOLD increased strongly in the European session, touching the upper border of the sideway model
The h1 wave is still a more bullish wave. With the support zone opening the GAP of the Asian session 3296 is still considered a strong support zone today. The breakout zone in the morning also becomes an important support zone
In the opposite direction of the break 3360, there is still a zone 3368 as the immediate resistance before the Gold price is on the way to ATH. Attention daily resistance 3396

NZDUSD SHORTNZDUSD could possible short to complete a C leg of a possible expanded flat or running flat correction before the big buy

#NIFTY Intraday Support and Resistance Levels - 02/06/2025Nifty is expected to open flat near the 24700–24750 zone. The index has been consolidating in a tight range over the past few sessions, indicating indecision and a potential breakout on either side.
If Nifty sustains above the 24750–24800 zone, a bullish breakout may unfold with upside targets of 24850, 24900, and 24950+. A clear move above 25000 will confirm strong buying momentum with extended targets of 25150, 25200, and 25250+.
On the downside, if Nifty breaks below 24700 and fails to recover, fresh selling pressure could drag the index toward 24650, 24600, and 24550.

[INTRADAY] #BANKNIFTY PE & CE Levels(02/06/2025)Bank Nifty is expected to open flat around the 55700–55800 zone. If it manages to sustain above the 55550–55600 breakout zone, the bullish trend is likely to continue with upside targets at 55750, 55850, and 55950+. A further breakout above 56050 may fuel extended gains toward 56250, 56350, and 56450+.
On the downside, if Bank Nifty shows weakness and falls below 55900–55950, a short opportunity may arise targeting 55750, 55650, and 55550 zones. A deeper breakdown below 55450–55400 could lead to further downside levels of 55250, 55150, and 55050.
The price action currently suggests consolidation within a range, so wait for a decisive breakout or breakdown before entering. Use strict stop-losses and book partial profits at major levels as the session may remain volatile near resistance.

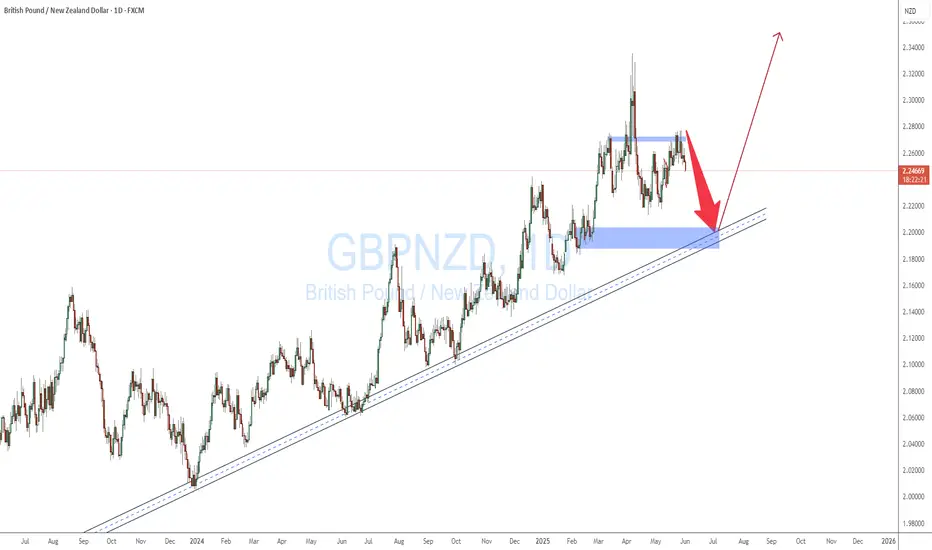
GBPNZD TANK BEFORE THE SURGEGBPNZD is expected to fall o the daily dynamic support before the surgeto break the next high.
the pair keeps tanking from a a dailt TF quasimodo LEVEL
BTCUSD BUY IDEA-EASY CONFLUENCE PLAY??After reaching an all-time high (ATH) last week, Bitcoin is currently positioned at a pivotal $105,484 at the .23 level according to the Fibonacci trend. It has retraced to previous highs around $105,000 to $106,000. Recently, it bounced off the support level of approximately $102,740 on the 4-hour and daily charts and seems to be forming higher lows. I believe we could see a confluence play that aligns with the previous price action that led to the ATH.

Bitcoin (BTC) Market Analysis1. Previous Analysis Validation
Our previous week's analysis played out perfectly, aligning well with the market movement.
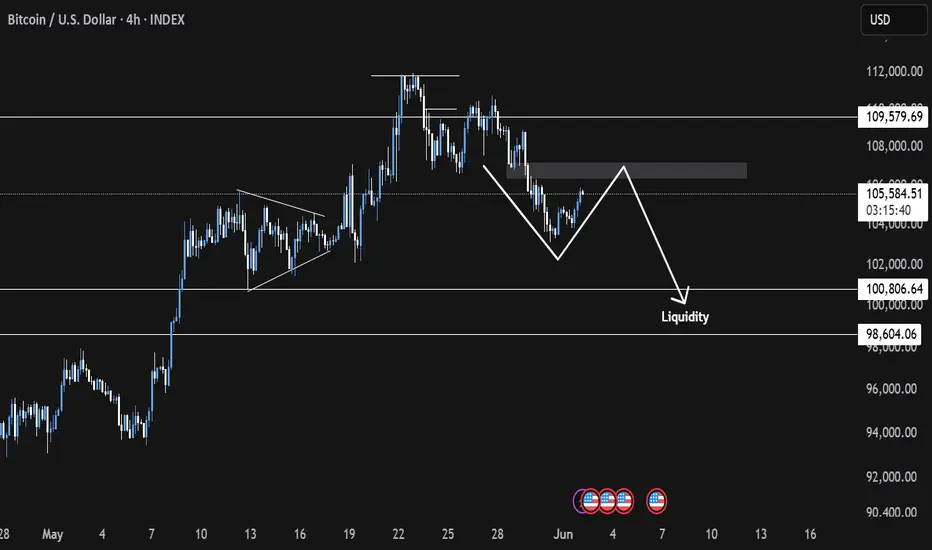
2. Current Market Sentiment
The market remains bearish overall. However, we are seeing a short-term price pump, likely due to late short positions entering the market. This is resulting in a price move to trigger short liquidations. The recent 4H swing highs are acting as key stop-loss zones.
3. Imbalance & Rebalancing
The price is moving upward toward a daily imbalance area (highlighted in orange). We expect the market to rebalance in this zone, potentially leading to a price rejection and continuation of the downward trend.
4. Liquidity Zone
Our primary liquidity zone lies between \$100K and \$98K. We anticipate this area to be a key region for price reaction.
JSL ,1DPattern is looking very very good , enter into trade after upper trendline is fully broken with Good Volume with strong candle .
this Metal Sector is Looking Great and Performing very well
Take Risk According to your Capital
Follow for more Swing Ideas Like this .

SILVER (XAGUSD): Bullish Momentum Continues Silver (XAGUSD) has been showing strong resilience and upward momentum, reinforcing a generally bullish outlook for the near to medium term. Despite recent minor fluctuations, the underlying fundamentals and technical indicators suggest continued potential for price appreciation.
Technical Observations:
Consolidation & Breakout Potential: Silver has been consolidating, forming a base that could lead to a significant breakout.
Support Levels : Monthly Key support around the $28.00 - $29.00 zone has proven robust, suggesting strong buying interest on dips.
One-Month Chart Perspective: On a one-month chart, you would typically observe the broader trend and significant long-term support/resistance zones. Given the bullish outlook, the one-month chart would likely show a series of higher lows and potentially higher highs, indicating sustained upward momentum. Look for strong monthly closing candles above key psychological levels, which would reinforce the bullish sentiment and suggest continued strength into the next month. Any pullbacks on this timeframe would ideally find support at previous resistance levels, which then act as new support.
Key Price Targets and Predictions (as of late May/early June 2025):
Based on various analyst forecasts and market models, here are some notable price targets for silver:
Short-Term (Q2 2025): Expectation around $33.79 - $34.00 per troy ounce.
Mid-Term (Next 12 months / End of 2025):
Analysts generally forecast targets ranging from $36.00 to $40.00 per ounce.
Some more optimistic predictions reach towards $48.00 - $50.00 per ounce.
Longer-Term (2026-2030): Some projections see silver potentially reaching $75.00 - $80.00 per ounce.
Driving Factors:
Industrial Demand: The increasing adoption of green technologies (solar panels, EVs) continues to drive significant industrial demand for silver.
Safe-Haven Appeal: Ongoing global economic uncertainties and geopolitical tensions enhance silver's role as a safe-haven asset.
Supply Deficits: Persistent supply shortfalls in the silver market are expected to provide upward price pressure.
Monetary Policy: Potential interest rate cuts could make non-yielding assets like silver more attractive.
Strategy:
Maintain a bullish bias while closely monitoring key support and resistance levels. A decisive break above current resistance could confirm further upside.
Disclaimer: This is not financial advice. Trading involves risk, and past performance is not indicative of future results. Always do your own research and consult with a financial professional before making any investment decisions.

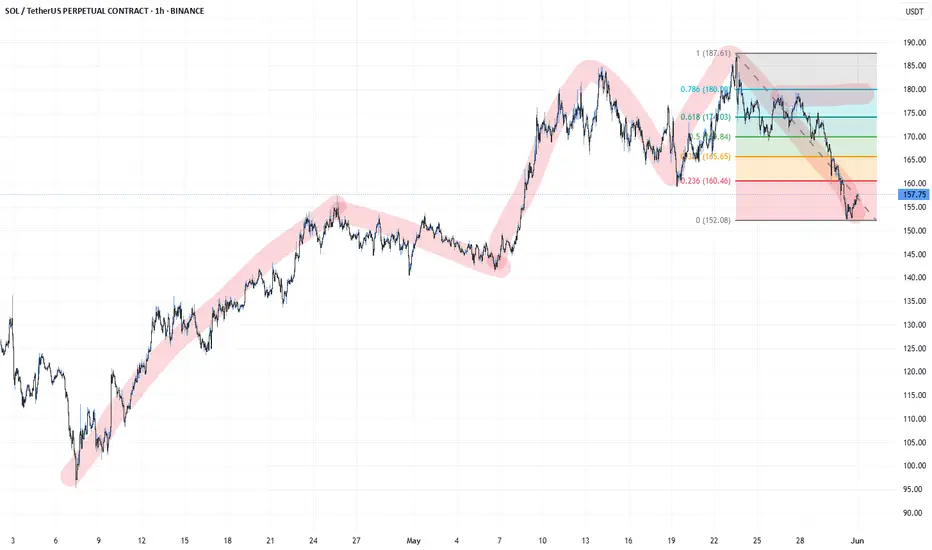
SOL - BOS ExpectationThe rising structure of the market signals deterioration. We will try to catch a short transaction both above fibo 50 and in the region corresponding to the liquidity zone.
BTCUSD HTF cycle analysis
Hi, I’m from Phoenix FX, and today I’ll be sharing my perspective on Bitcoin (BTC) price action based on the higher timeframes.
I’ll also give you my outlook on potential trade setups for today and tomorrow. Please remember that this is not financial advice—use this information as a guide only. If you find it helpful, don’t forget to like and share it with your like-minded communities.
Higher Timeframe Analysis
In my view, BTC tends to follow clear bullish and bearish cycle zones. Typically, we see a pump to new all-time highs (ATH), followed by the formation of resistance and a retracement down to a key support level. Our trading approach focuses on identifying those critical support and resistance levels, with some interim trades based on shorter-term analysis—occasionally even counter-trend, depending on the day’s market bias.
Over the past eight years, BTC has respected a major trend resistance line. The most recent ATH, around $112K, reconfirmed the relevance of this trendline. This makes it a valuable tool for projecting future ATH levels.
Looking ahead, I expect a move towards the $115K level in the coming weeks. This would likely act as a point of resistance, at which stage we might see a reversal and a drop back down to a key support zone.
Trade Setup
The chart I'm referencing highlights what I would consider the first premium buy zone, identified using a 4-hour Fair Value Gap (FVG).
The 50% level of this zone sits at $99,450. If this zone fails to hold, we may drop further to the secondary premium buy zone, which aligns with our higher timeframe (HTF) trend support and a weekly FVG. The 50% level of this deeper zone is around $89,150.
A potential long entry at $92,550, with a stop loss around $88,000, offers an excellent risk-to-reward (RR) ratio, targeting a move up to the $115K level.
Intraday Outlook
For today, I see bearish price action, with potential rejection around the $104,300–$105,000 range. Go short around the $104,750 to $105,000 zone
This could lead to a move down toward the lower key zones highlighted in the HTF analysis.
I recommend taking partial profits (TP) at every $1,000 increment and setting your stop loss to breakeven (BE) after hitting the first target.
Final Thoughts
Price action analysis is always subjective, so I’d love to hear your thoughts and ideas in the comments—each one, teach one.
Thanks for giving me some of your time.
From the Phoenix FX team, have a great weekend!

BTCUSD Price action analysis on HTFHi, I’m from Phoenix FX, and today I’ll be sharing my perspective on Bitcoin (BTC) price action based on the higher timeframes.
I’ll also give you my outlook on potential trade setups for today and tomorrow. Please remember that this is not financial advice—use this information as a guide only. If you find it helpful, don’t forget to like and share it with your like-minded communities.
Higher Timeframe Analysis
In my view, BTC tends to follow clear bullish and bearish cycle zones. Typically, we see a pump to new all-time highs (ATH), followed by the formation of resistance and a retracement down to a key support level. Our trading approach focuses on identifying those critical support and resistance levels, with some interim trades based on shorter-term analysis—occasionally even counter-trend, depending on the day’s market bias.
Over the past eight years, BTC has respected a major trend resistance line. The most recent ATH, around $112K, reconfirmed the relevance of this trendline. This makes it a valuable tool for projecting future ATH levels.
Looking ahead, I expect a move towards the $115K level in the coming weeks. This would likely act as a point of resistance, at which stage we might see a reversal and a drop back down to a key support zone.
Trade Setup
The chart I'm referencing highlights what I would consider the first premium buy zone, identified using a 4-hour Fair Value Gap (FVG).
The 50% level of this zone sits at $99,450. If this zone fails to hold, we may drop further to the secondary premium buy zone, which aligns with our higher timeframe (HTF) trend support and a weekly FVG. The 50% level of this deeper zone is around $89,150.
A potential long entry at $92,550, with a stop loss around $88,000, offers an excellent risk-to-reward (RR) ratio, targeting a move up to the $115K level.
Intraday Outlook
For today, I see bearish price action, with potential rejection around the $104,300–$105,000 range. Go short around the $104,750 to $105,000 zone
This could lead to a move down toward the lower key zones highlighted in the HTF analysis.
I recommend taking partial profits (TP) at every $1,000 increment and setting your stop loss to breakeven (BE) after hitting the first target.
Final Thoughts
Price action analysis is always subjective, so I’d love to hear your thoughts and ideas in the comments—each one, teach one.
Thanks for giving me some of your time.
From the Phoenix FX team, have a great weekend!

GBPUSD Bearish Setup | Trend Reversal Setup in Progress...📉 Technical Outlook _
After a strong bullish rally within a parallel ascending channel, GBP/USD is now showing signs of potential reversal. Price action recently broke out of the channel and is failing to reclaim upward momentum, indicating that buyers may be losing control.
🔍 Key Observations:
🟪 Previous Consolidation led to the breakout
📈 Strong bullish structure inside the parallel channel
❌ Price has now exited the channel, with clear signs of rejection near 1.347x
📉 Bearish pattern projecting a potential drop to the support zone at 1.31521
⚠ Watch for This Bearish Scenario:
1. Liquidity grab or false breakout above short-term highs
2. Strong sell-off as momentum fades
3. Clean bearish continuation pattern toward 1.3150 support
✅ Bearish Confluences:
Breakdown from parallel channel
Series of lower highs forming
Weak recovery attempts
Clear downside target with prior support zone structure
🔷 Note: Keep an eye on macro news and USD strength before executing. This is a technical setup with potential, not a guarantee.
📊 What’s your bias? Bullish or Bearish? 👍 Like & 🔔 Follow for more technical setups!
