Gold Price Analysis May 2D1 frame confirms closing below the disputed zone showing the downtrend continues to extend in the following days
The recovery in the Asian and European sessions can be a stepping stone for a decrease in the US session. Sellers are waiting for high price zones and old breakout zones to sell their goods. The 3271-3273 zone plays an important role in the bearish structure as long as this zone is held by the sellers, the possibility of a price increase is relatively low.
The barrier in the Asian session around 3257 will be where we consider the trading strategy. If the European session breaks this zone, we can buy at the target of 3271-3273. If the US session does not break this zone, SELL breaks it, the downtrend structure is broken and holds the BUY order until 3299. The daily resistance zone will be 3312. When 3371 is not broken, SELL and this is a good Swing signal to 3200. The possibility of a strong sell-off after Nonfarm is also understandable.
Strategy: If it does not break 3257 but falls, wait for the reaction at the border of 3243. When this zone is broken, the trend is broken, then we only SELL. If it increases from 3243, then maintain the above strategy with a better entry.
Priceactionanalysis

02.05.25 Morning ForecastPairs on Watch -
OANDA:XAGUSD
FX:AUDJPY
FX:EURUSD
A short overview of the instruments I am looking at for today, multi-timeframe analysis down to what I will be looking at for an entry. Enjoy!

Gold Price Analysis May 1The D1 candle has broken out in a bearish direction. It is not surprising that the price broke Dow and decreased according to yesterday's Plan.
Gold confirmed the selling side won, so today's strategy is to watch for SELL. The SELL point pays attention to the 2 break zones of 3270 and 3302. The BUY point with the Scalping element pays attention to 3216 and today's main support is 3195.
The current trading strategy is that gold is approaching the 3237 resistance. If it confirms closing above this zone, it will give a BUY signal to 3251 and consider the price reaction of the US session. If it breaks 3241, it will hold until 3270. On the contrary, if it does not break 3237, it can SELL to 3216 and trade according to the noted port zones.

#NIFTY Intraday Support and Resistance Levels - 02/05/2025Gap up opening expected in nifty near 24450 level. Currently nifty consolidating in the range of 24250-24500 level. After opening if nifty gives breakout and start trading above 24500 level then possible strong upside rally towards the 24750+ level in today's session. 24250 level will act as a strong support for today's session. Any major downside only expected if nifty starts trading below 24200 level. Below 24200 level downside can goes upto 24000 level.

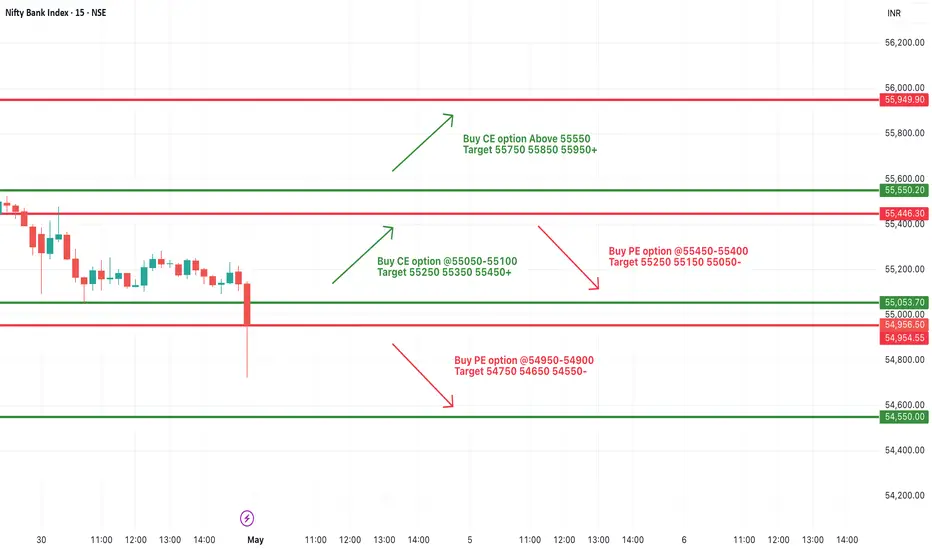
[INTRADAY] #BANKNIFTY PE & CE Levels(02/05/2025)Today will be gap up opening expected in banknifty. 55050-55450 zone will be consolidation for banknifty. 55450-55550 zone will act as a strong resistance for today's session. After opening if banknifty gives breakout and starts trading above 55550 level then expected strong upside rally upto 55950+ level in today's session. Any major downside only expected below 54950 level.
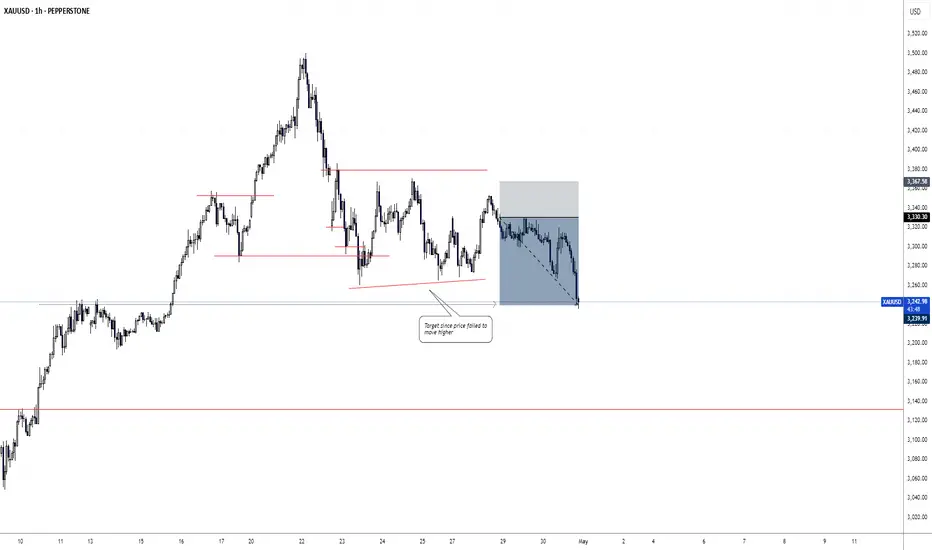
XAUUSD UPDATEHi all
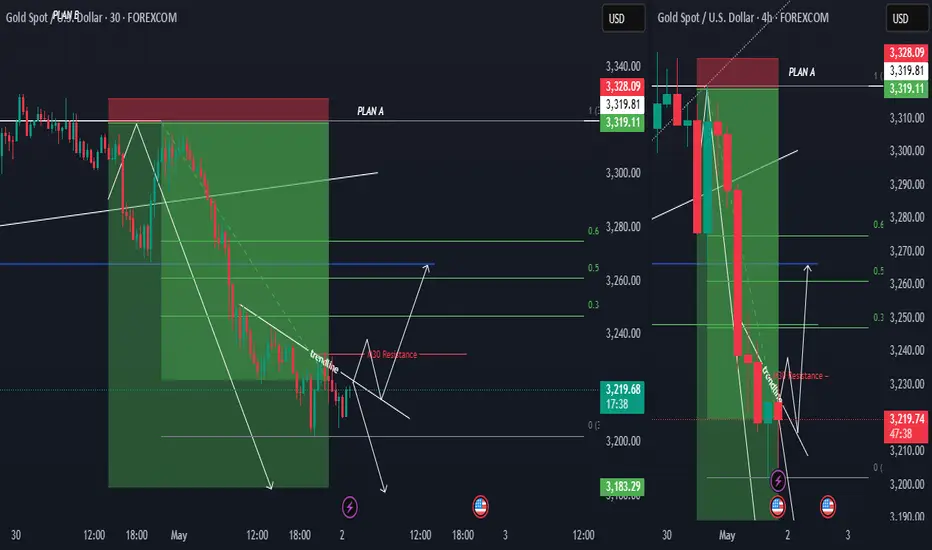
The rejection at the 3202 level, Plan A remains a strong possibility, especially if the trendline also shows signs of resistance. However, if the trendline breaks, then Plan B would be the preferred approach—waiting for a confirmed breakout on the 30-minute timeframe before considering a long position.
Keep a close watch on price action and ensure strong confirmation before making any moves. Feel free to share any updates or additional insights. Wishing you success in trading!
good luck all
**My trading strategy is not intended to be a signal. It's a process of learning about market structure and sharpening my trading my skills also for my trade journal**
Thanks a lot for your support
Gold 1H Breakdown: Top Confirmed, Trend ReversedJust price, structure, and volume — tracked in real time.
🧠 Chart Breakdown:
✅ Trend Start / Structure Reclaim — Price regained key support and moving averages with momentum. Structure flipped bullish and trend began.
⛔ Top Exhaustion — Price reached new highs but began to stall. Volume dropped, and candles began curling — signaling a loss of momentum.
⚠️ Bounce Setup — After the pullback, buyers attempted to step back in — but structure never confirmed. No follow-through = no entry.
🚨 Breakdown Trigger — Sellers regained full control. Price broke below key levels with conviction. Volume confirmed the shift.
👀 Current Move — Price is pushing into new lows. Breakdown structure remains active until proven otherwise.
Always happy to be helpful.

Gold: Breakdown in Motion (15m Chart)Just price, structure, and volume — tracked in real time.
🧠 Chart Breakdown:
✅ Momentum Long — Price broke out from a base with clean volume. MA structure aligned, and bulls had control early.
⛔ Top Reversal — Price peaked and printed a clean rejection. Volume faded. Sellers rotated in.
⛔ Lower High Rejection — Attempt to reclaim highs failed fast. Fib and MA structure stacked against continuation.
⚠️ Temporary Recovery Attempt — Brief bounce off support, but no structure regained. No follow-through = no entry.
🚨 Breakdown Confirmed — Price lost all support levels with conviction. Volume backed the flush. Breakdown held and extended.
👀 Current Pressure Point — Price still pressing lows. Watching to see if momentum continues or if we get exhaustion behavior.
Always happy to be helpful.

SPX Play-by-Play: From Trap to Trend and Back AgainJust price, structure, and volume — tracked in real time.
🧠 Chart Breakdown:
✅ Early Short Trap / Failed Breakdown — Sellers tried to press lower early, but price held key levels and reversed. That shift became the foundation for the entire move that followed.
✅ Breakout Long Trigger — After reclaiming structure, price drove into new highs with strong follow-through. Volume confirmed the breakout.
⛔ Top Rejection — Price pushed into resistance but couldn’t hold. Momentum faded, candles hesitated, and sellers stepped in.
✅ Fib-Based Bounce — After the pullback, price responded cleanly off fib-based support. The bounce was sharp, and volume backed it.
✅ Steady Uptrend Structure — Price moved in an orderly fashion. Small pullbacks held structure, and volume stayed supportive — a textbook controlled climb.
⛔ Range Resistance — Price returned to a previously rejected zone. Wicks and hesitation reappeared.
👀 Current Breakout Watch — Price is testing that resistance again. A reclaim with strength signals continuation. Another fade? Let it go.
Always happy to be helpful.

GBPJPY 4h Long Setup Clear bullish structure with clean higher highs and higher lows intact
Price formed a bull flag after a strong impulse leg showing continuation potential
Breakout of the flag confirms momentum with aggressive bullish candle and volume
Entry : 192.459
SL : 188.167
TP : Trail 195.898
RR 1 : 3.1
Market is flowing with bullish pressure and breakout indicates wave extension
No counter structure in sight, trend continuation expected
Let the market breathe and move

Bullish Rebound in Action: GBP/USD Bounces Off Key Demand Zone!Timeframe: 1-Hour (H1)
Ideal for short to medium-term intraday trades.
Support Zone (Entry):
Price bounced from a strong demand zone around 1.32800, suggesting a potential long entry.
Stop Loss:
Just below the green zone at approx. 1.32700
Target:
Resistance zone marked around 1.34500, offering high upside potential.
Bullish Price Action:
Strong bounce candle at support — indicating demand pressure and a possible reversal.
Favorable Risk-to-Reward:
Wide profit zone relative to stop loss, high RRR setup.

01.05.25 Morning ForecastPairs on Watch -
GBP / JPY
GBP / CHF
XAG / USD
NZD / CAD
A short overview of the instruments I am looking at for today, multi-timeframe analysis down to what I will be looking at for an entry. Enjoy!

AUD/USD Faces Resistance Rejection – Short Setup in Play!Timeframe: 1-Hour Chart
Analyzing intraday to short-term movement in AUD/USD.
Entry Zone (Supply Area):
Price entered the resistance zone near 0.64160 – 0.64200, indicating a potential short entry.
Bearish Rejection:
Strong wick rejection from resistance suggests sellers are active at that level.
Stop-Loss (Red Box Top):
Placed just above the resistance at 0.64296, guarding against false breakouts.
Target Zone (Demand Area):
Marked near 0.63560 – 0.63600, indicating a potential take profit level.
Risk-Reward Ratio:
The green (reward) area is significantly larger than the red (risk), showing a favorable risk-to-reward setup.
Trend Bias:
Overall bearish structure with lower highs and lower lows, supporting short trade bias.
Trigger Confirmation:
Price rejected resistance and started falling, indicating short trade activation.

Gold Price Analysis April 30The market's D frame continues to maintain a fixed price range, with a dispute between buyers and sellers in the range of 3345 and 3275.
With the sideways wave in recent days, the possibility of creating a Dow and decreasing the price of Gold will be higher than increasing to ATH slightly. Gold has just reacted from 3000 candle wick area yesterday, which is also the old breakout area. Gold can push up to 3324 in the European session. If it does not break 3324, it is possible to SELL Gold to 3275. However, the sideways waves may have a relatively strong reaction around 3288 and the reaction area of 3300 is also weak but still need attention. If it breaks through 3324, Gold will find daily resistance around 3340 for the SELL strategy.

Bearish retraction before continuing bullish HTF BiasPrice is still bullish overall but retracing to induce sellers to get into the false bearish bias.
Price is still overall bullish but a retracement is inevitable.
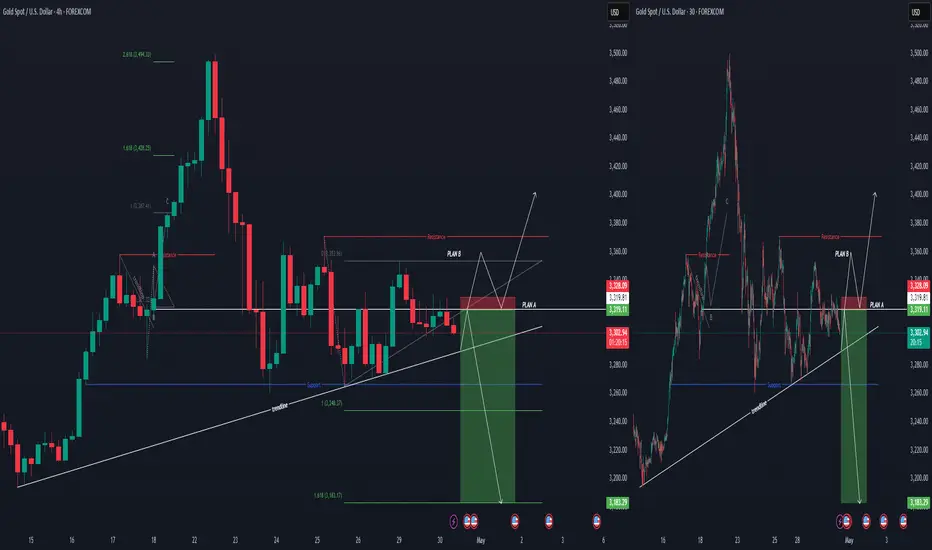
XAUUSD TRADE IDEA
Hi everyone,
here is my gold price movement forecast. My forecast tends to lean towards temporary strength for gold. Therefore, if there is a rejection at the trendline on the H4, I will wait for the price to come back to 3320 before shorting gold... If the price successfully breaks the entry price and makes a new high, I will look for opportunities to long towards 3402.
good luck all
**My trading strategy is not intended to be a signal. It's a process of learning about market structure and sharpening my trading my skills also for my trade journal**
Thanks a lot for your support
TAO/USDT – Long Setup ActivatedA potential bottom might be in place here.
🔍 Key confluences:
– Strong CVD rebound (spot + futures)
– Funding rate turning positive
– Top traders ratio shifting bullish (smart money buying the dip)
– Open Interest stabilizing after a clean flush
– And above all: my Scalp Cloud Signal just fired a bullish confirmation ✅
🎯 Targeting a short-term move to the 365–373 zone.
SL clearly defined below the local sweep.
💡 Tool used: Scalp Cloud Signal by The Degen Company
— Precision tool for scalping and micro trend shifts.

30.04.25 Morning ForecastPairs on Watch -
GBP / AUD
AUD / JPY
GBP / JPY
EUR / USD
A short overview of the instruments I am looking at for today, multi-timeframe analysis down to what I will be looking at for an entry. Enjoy!

US500 TRADE IDEAhi again
The US500 has shown strength by breaking the resistance at 5483.5 and is now at 5535. If the price reaches 5604.6 and a pullback occurs, targeting a temporary decline at the 50% Fibonacci retracement level is a good strategy.
Fibonacci retracement is often used to identify potential support and resistance levels where the price might pause or reverse. The 50% level is one of the commonly watched levels by traders as it often indicates a significant turning point in price movement.
good luck all
**My trading strategy is not intended to be a signal. It's a process of learning about market structure and sharpening my trading my skills also for my trade journal**
Thanks a lot for your support

OIL TRADE IDAHello
Hi everyone. Regarding oil movements, I see a long opportunity at the level of 59.61. If the price closes below 58.56, there is a possibility of a temporary rise before continuing to drop to 55.
good luck all
**My trading strategy is not intended to be a signal. It's a process of learning about market structure and sharpening my trading my skills also for my trade journal**
Thanks a lot for your support

#NIFTY Intraday Support and Resistance Levels - 30/04/2025Gap up opening expected in nifty near 24450 level. Currently nifty consolidating in the range of 24250-24500 level. After opening if nifty starts trading and sustain above 24500 level then possible strong upside rally towards the 24750+ level in today's session. 24250 level will act as a strong support for today's session. Any major downside only expected if nifty starts trading below 24200 level. This downside can goes upto 24000 level.

[INTRADAY] #BANKNIFTY PE & CE Levels(30/04/2025)Today will be slightly gap up opening expected in banknifty. 55050-55450 zone will be consolidation for banknifty. After opening if banknifty starts trading and sustain above 55550 level then expected upside rally upto 55950+ level in today's session. Any major downside only expected below 54950 level.

Gold Price in Key Compression Zone: Awaiting BreakoutThe 1-hour chart of XAU/USD (Gold Spot vs US Dollar) shows a clear symmetrical triangle formation, where the price has been compressing between a descending resistance zone (red) and a horizontal support zone (green). Here's a breakdown of the setup:
Support Zone (~3040–3080 USD):
This area has acted as a strong base multiple times, suggesting buyers are stepping in consistently at this level.
Resistance Trendline (~3310–3320 USD):
The price has repeatedly tested this descending resistance line but has failed to break above it so far.
EMA Indicators:
50 EMA (black line): Currently acting as dynamic resistance.
200 EMA (blue line): Price is hovering around it, indicating indecision.
Projected Breakout Scenarios:
Upside Breakout:
If price breaks above the resistance trendline, a sharp rally is projected towards the 3480–3520 USD zone. This move aligns with previous supply levels.
Downside Breakout:
If support fails, we could see a breakdown toward the 3040 USD region, with extended targets near 3080–3040 USD.
Current Bias:
The market is consolidating, and a breakout is imminent. Watch for volume and candle confirmation at either the resistance or support to determine the next major move.
================================================================
Disclosure:
I am a participant in TradeNation's Influencer Program and receive a monthly fee for utilising their TradingView charts in my market analysis.
=================================================================
