[INTRADAY] #BANKNIFTY PE & CE Levels(28/03/2025)Today will be gap up opening expected in banknifty. After opening if banknifty starts trading above 52050 level then expected strong upside rally upto 52450+ level. any major downside only expected below 51450 level.
Priceactionanalysis

WhiteBIT Coin $WBT: Getting Ready for a New ATHMarkets often react to major events, whether political statements or high-profile initiatives in the crypto industry. For instance, the impact of Donald Trump’s economic policies and regulatory decisions on asset prices and the market capitalization of crypto exchanges has been widely discussed - coinmarketcap.com
In particular, market volatility following such developments has led to a decline in the market value of leading crypto exchanges. However, beyond global factors, internal ecosystem growth drivers also play a crucial role.
One such trigger could be the International Crypto Trading Championship (ICTC)—WhiteBIT’s trading tournament, which will be the first-ever global live-streamed trading competition.
What does this mean for WhiteBIT Coin?
Increased platform activity → higher demand for internal assets.
Greater trader engagement → potential impact on trading volumes and liquidity.
Media exposure of the event → attracting global attention to the WhiteBIT ecosystem.
Currently, WBT is trading at $29.20 (-0.26% over the past 24 hours), down 6.29% from its ATH of $31.16. However, given the growing interest in the platform and the impact of market supply dynamics, this tournament could act as a catalyst for reassessing current price levels. If exchange activity intensifies, it’s reasonable to expect that WBT could retest its ATH zone or even break through it.
Whether this scenario plays out remains to be seen. But one thing is certain—ICTC will be a key indicator of WBT’s momentum and overall market sentiment. 🔥
What are your thoughts? Will this tournament give WBT a new boost?

US100 - Bullish Continuation Inside Ascending ChannelThis TradingView post showcases a technical analysis of the US100 (Nasdaq 100 Index) on the 4-hour timeframe. The chart highlights a well-defined ascending channel, reflecting the current bullish structure. Price action is seen retracing after touching the upper boundary of the channel, moving towards a key region of interest labeled as "IFVG" (Imbalance Fair Value Gap), where potential demand is expected.
The analysis predicts a retracement to the 0.618–0.65 Fibonacci retracement zone, aligning with a confluence of support levels within the channel. A potential bullish reversal is anticipated at this level, aiming for a continuation towards new highs near the upper boundary of the channel. The green projection line illustrates the anticipated path of price action.
This setup combines channel dynamics, Fibonacci levels, and market structure concepts to identify a favorable trade opportunity.

Gold Price Outlook: Key Fair Value Gap (FVG) and Potential PriceThis 4-hour chart of Gold/USD highlights a critical Fair Value Gap (FVG) zone in the $2,960 - $2,980 range. The chart outlines two potential scenarios:
1. A bullish reaction with a price push toward the $3,040 resistance level.
2. A bearish move breaking below the FVG, targeting the $2,880 support zone.
Traders should monitor price action within the FVG for confirmations, with upcoming economic events marked at the bottom as potential catalysts.

27.03.25 Morning ForecastPairs on Watch -
FX:NZDCAD
OANDA:XAGUSD
FX:NZDUSD
A short overview of the instruments I am looking at for today, multi-timeframe analysis down to what I will be looking at for an entry. Enjoy!

FFL THE PERFECT SETUP REVIEW AS DEFINED FFL tested the same key levels which I find through secret price action and institutional order flows. I don't want to repeat you can just look at the chart and its beauty.

Gold Analysis March 26Candle D still shows that the battle between buyers and sellers has not yet been defeated.
3033 Plays an important role in the current downtrend structure. H4 Closes above the 3033 zone, officially breaking the wave and giving priority to the BUY side.
Gold is pushing up and wants to break the dynamic resistance of 3027. Closes above 3027, gold is heading towards 3033-3035. If it does not break this zone, you can SELL to 3005 and if the US breaks 3005, hold to 2983. If the 3033 zone is broken, wait for BUY to break 3033, the daily target is towards 3045.

#NIFTY Intraday Support and Resistance Levels - 27/03/2025Flat opening expected in nifty. After opening if nifty starts trading and sustain above 23550 level then expected upside movement upto 23750+ level in today's session. Major downside expected below 23500 level. This downside rally can goes upto 23250 in today's session.

[INTRADAY] #BANKNIFTY PE & CE Levels(27/03/2025)Today will be slightly gap down opening expected in index. After opening possible banknifty consolidate in between the 51050-51450 level in today's session. Any upside rally only expected if banknifty starts trading and sustain above 51550 level. Major downside expected in index if it's give breakdown of 50950 level. This downside rally can goes upto 50550 level.

AUD/CAD – Potential Bullish Reversal from Key Support📊 Chart Analysis
1️⃣ Accumulation Zone : The price previously traded within a rectangular consolidation range before breaking down.
2️⃣ Bullish Reversal Pattern : A falling wedge has formed, indicating a possible breakout to the upside.
3️⃣ Key Support : The price has tested the 0.8980 - 0.8970 zone multiple times and is showing signs of rejection.
4️⃣ Potential Upside : A breakout above 0.9030 - 0.9050 could confirm further bullish momentum.
🚀 Trading Plan:
📌 Entry : On a breakout above 0.9025
🎯 Targets :
First target : 0.9100
Extended target : 0.9130
🛑 Stop Loss : Below 0.8965 to minimize risk.
🔔 Confirmation Needed: Wait for strong bullish price action before entering long trades. 🚀🔥

NAS100 Price ActionHey traders!
Looking at the current market structure, we can see that the price failed to make a new higher high , which is often the first sign of a potential trend reversal. This was followed by a break of two key structure levels, confirming a shift in momentum from bullish to bearish.
Interestingly, a supply zone was formed during this shift, but price didn’t even retest it — instead, it dropped right after its creation, showing strong bearish pressure. There's also an internal candle (IFC) marking the transition point.
With this kind of price action, it’s likely that the market is heading toward the next demand zone below. This could present a solid short opportunity, but always remember to manage your risk wisely and wait for clean confirmations.

Bitcoin (BTC/USD) Rising Wedge BreakdownMarket Structure & Analysis:
Rising Wedge Formation: Price has been moving within a rising wedge pattern, which is typically a bearish reversal pattern.
Bearish Breakdown Expected: BTC is testing the lower boundary of the wedge, indicating a potential breakdown.
Resistance Zone:
$89,649 – Key resistance level preventing further upside.
$88,336 – Local resistance that price failed to sustain above.
Support Levels:
$86,852 - $85,335 – Intermediate support range.
$80,402 – Main target for a bearish move.
$76,725 – Secondary support in case of further decline.
Trading Plan:
Sell Setup:
Wait for confirmation of a breakdown below the wedge.
Enter short if price closes below $86,852 with volume confirmation.
Stop Loss: Above $88,336 to avoid false breakouts.
Take Profit Targets:
TP1: $84,474 (first support level).
TP2: $80,402 (main target).
TP3: $76,725 (extended bearish target).
Risk Factors:
If BTC finds strong support at $86,852, a bounce could invalidate the bearish setup.
Macro events (ETF approvals, institutional buy-ins, Fed rate decisions) may impact price action.

XAUUSD – Bullish Breakout from Triangle | 3,090+ in SightGold (XAUUSD) has broken out of a symmetrical triangle consolidation on the 1H chart, signaling bullish continuation. With solid technical structure and momentum building, the path toward 3,093+ remains firmly in play.
📊 Technical Breakdown
1. Symmetrical Triangle Formation
Price coiled within a classic symmetrical triangle, forming higher lows and lower highs—typically a continuation pattern in trending markets.
A breakout has now occurred to the upside, confirming bullish bias.
2. Breakout Projection
The measured move from the triangle projects a 2.62% upside, targeting the 3,093 zone.
3. Clean Market Structure
Bullish impulse followed by healthy consolidation reflects market strength.
Expectation: Price will print higher highs and higher lows on its way to upper targets.
🎯 Bullish Targets
TP1: 3,047.652
TP2: 3,058.038
TP3: 3,093.957
These levels are based on recent structure highs and the measured move from the breakout.
📌 Trade Plan
Entry Idea: On triangle breakout retest or momentum continuation above 3,025
Stop Loss: Below triangle support (~3,000)
Risk-to-Reward: Favorable on breakout continuation setups
🔎 Confluences
✅ Symmetrical Triangle Breakout
✅ Strong Bullish Trend
✅ Measured Move & Clear Targets
✅ Consistent Market Structure
Gold bulls are stepping in with strength. As long as price holds above the breakout zone, expect further upside toward 3,090+.
Want a version with SL-to-BE logic or trailing TP adjustments? Just let me know!

26.03.25 Morning ForecastPairs on Watch -
OANDA:XAGUSD
FX:EURUSD
FX:NZDUSD
A short overview of the instruments I am looking at for today, multi-timeframe analysis down to what I will be looking at for an entry. Enjoy!

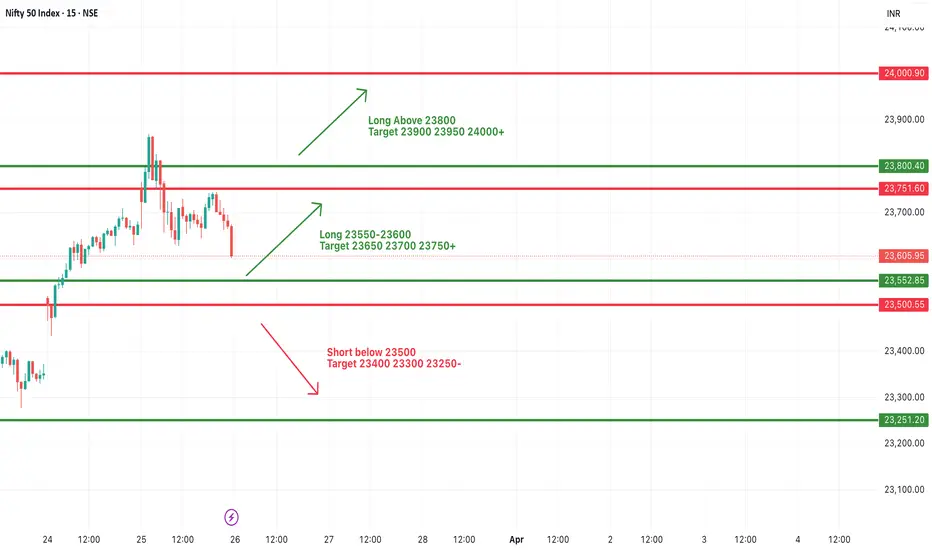
#NIFTY Intraday Support and Resistance Levels - 26/03/2025Gap up opening expected in nifty near 23750 level. After opening 23750 level will act as a resistance for the opening session. In case nifty starts trading and sustain above 23800 level then expected upside rally upto 24000+ level. Major downside expected below 23500 level.
[INTRADAY] #BANKNIFTY PE & CE Levels(26/03/2025)Today will be slightly gap up opening expected in index. After opening if banknifty sustain above 51550 level then expected upside movement upto 51950+ level in opening session and this rally can extend for further 400-500+ points in case banknifty starts trading above 52050 level. Any major downside expected below 51450 level.

Gold Price Analysis March 25The D1 gold candlestick confirmed a clear decline. Some late-day buying pressure around 3000 pushed the gold price a bit.
H4 has formed a bearish wave with an important price of 3028. If H4 cannot break 3028 today, there will likely be a strong sell-off of gold at the end of the day.
Trading scenario. Gold is pushing up from the 3015 price zone. Target in the European session is 3027-3028. If this zone cannot be broken at the end of the session, SELL and hold at 3008. If the US confirms a break of 3008, hold at 2983. In case of a break of 3028, the sellers are weak. Be careful of false break of 3028. If the break is real, wait for 3035 to SELL today.
Gold does not push up to 3027 but closes below 3015, then SELL to 3008. At the end of the session, if it breaks 3008, hold to 2983. If it doesn't break, then BUY again to the 3008 area, target 3028.

No Bearish Divergence so far.No Bearish Divergence so far.
Monthly Closing above 392 would be
a Healthy sign.
It will close as a Morning Star.
On Daily TF, 430 - 435 can be touched easily.
but the real story will start once 465 is
Crossed & Sustained; it may then 500+

+120 pips in profit and still running !!!I sent in this setup before the New York session and told you all the reason for the entry and as always, it's the same strategy i always use even for my previous trade ideas i share on here.
Price is still bearish until the trendline liquidity is taken and that's still quite far which means price is still bearish.

Price approaching OB POI with Trendline LiqPrice is currently bullish, structure turned bullish from last week's CHOCH and Mondays subsequent break of structures to make price bearish for the short=term, how short-term is price bearish for ? i have no idea but price will definitely still go for the ATH maybe inside this week or early next week which will be a new month (April).
Right now, I'm bearish still hence this setup, it's actually a decent setup though (OB+IDM to take out the trendline liq)
Disclaimer: Do your own analysis and please kindly risk what you can, apply proper risk and money management.

25.03.25 Morning ForecastPairs on Watch -
FX:GBPAUD
FX:AUDJPY
FX:EURUSD
A short overview of the instruments I am looking at for today, multi-timeframe analysis down to what I will be looking at for an entry. Enjoy!

[INTRADAY] #BANKNIFTY PE & CE Levels(25/03/2025)Gap up opening expected in today's session. Expected opening above 52000 level. After opening if banknifty sustain above 52050 then expected strong upside rally upto 52450+ level in opening session. Downside 51550 level will act as a strong support for today's session. Any major downside only expected below 51450 level.

#NIFTY Intraday Support and Resistance Levels - 25/03/2025Today will be gap up opening in nifty. Expected opening near 23750 level. After opening if nifty starts trading above 23800 then this bullish rally can extend for further 150-200+ points upto 24000+ level in today's session. Any major downside only expected below 23500 level.
