$BTC FINALLY BULL RALLY ON CHART NOW & 2nd TAKE PROFIT DONEJUST IN NEWS : BTC Bear Market To Last 90 Days, Analyst Predicts, as Trade War Fears and Whale Activity Impact Prices
Bitcoin has entered a bear market, with its price dropping over 20% from its all-time high. Market analyst Timothy Peterson expects the downturn to last 90 days, arguing that this decline is weaker than most past bear markets. He noted that out of the 10 previous downturns, only four—2018, 2021, 2022, and 2024—have been worse in terms of duration. Peterson does not see BTC sinking far below $50,000 but says a slide in the next 30 days could be followed by a 20-40% rally after April 15. He believes this could trigger renewed buying interest and push Bitcoin higher.
Investor sentiment has been affected by global trade war concerns following tariffs imposed by U.S. President Donald Trump and retaliatory measures from multiple trading partners. The uncertainty has led to a decline in speculative investments. The Glassnode Hot Supply metric, which tracks BTC held for a week or less, has fallen from 5.9% in November 2024 to 2.3% by March 20, signaling reduced short-term trading activity. A CryptoQuant report also suggests that most retail investors are already in the market, countering expectations that a surge of new traders would drive prices up.
Ether has also struggled, losing over 51% in three months since peaking above $4,100 on December 16, 2024. Analysts say ETH must reclaim the $2,200 range to gain upward momentum. “If price can generate a strong enough reaction here, then #ETH will be able to reclaim the $2,196-$3,900 Macro Range (black),” wrote crypto analyst Rekt Capital in a March 19 X post. Despite positive regulatory developments, such as the U.S. Securities and Exchange Commission dropping its lawsuit against Ripple, ETH has yet to see significant gains.
Market uncertainty remains high, with some analysts expecting economic pressures to last until at least April 2025. Despite short-term volatility, long-term projections remain optimistic. VanEck has predicted a $6,000 cycle top for ETH and a $180,000 peak for BTC in 2025.
Disclaimer: This article is for informational purposes only and does not constitute financial advice. Always conduct your own research before making any investment decisions.
Priceactionanalysis

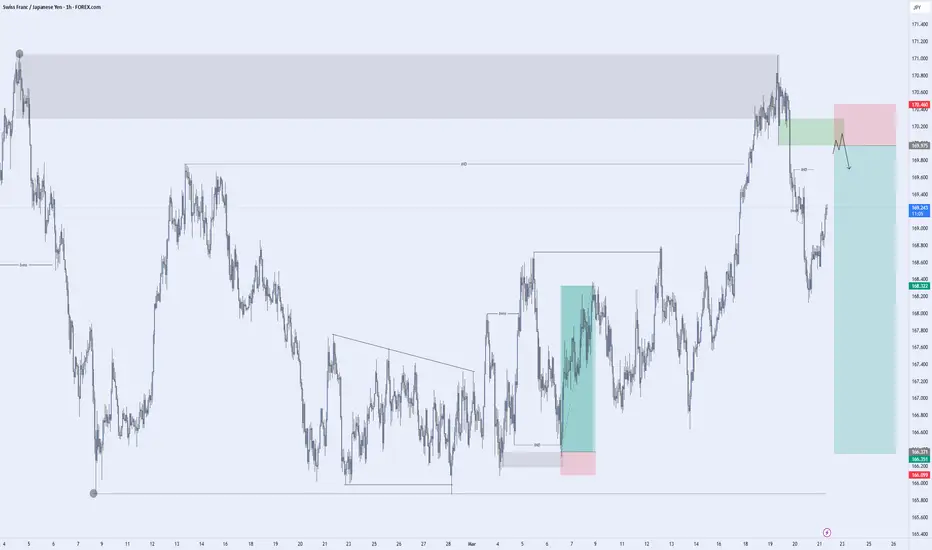
CHFJPY Possible Trend Continuation Hi Traders, here's my breakdown on FOREXCOM:CHFJPY for a potential sell trade .
So we've basically run into structure supply, LTF Flip.
Entry model : Breaker +Inducement + RTBb
Let's hope we get triggered, and most importantly, don't get stopped out lol
#Stay Reactive.
LIKE & FOLLOW
Gold Price Analysis March 24Fundamental Analysis
Meanwhile, the US Dollar (USD) is struggling to capitalize on a three-day rally from multi-month lows amid expectations that a tariff-driven US economic slowdown could force the Federal Reserve (Fed) to resume its rate-cutting cycle soon. This, coupled with geopolitical risks, acted as a non-yielding driver for Gold and helped limit downside momentum. Hence, it would be prudent to wait for a strong follow-through before confirming that XAU/USD has topped out in the near term and positioning for any meaningful corrective slide.
Technical Analysis
Friday's D1 saw strong selling pressure with the sharpest drop from 3046 to 3000. Late in the day, bulls pushed the price back 50% of the D candle. This shows that bears have entered the market but the downtrend will take some time.
The h4 structure is quite nice to see the buy and sell wave structure.
Scenario 1: In the 3026 zone of the European session, selling pressure has appeared. If the price pushes up to break the 3026 zone at the end of the session, it will give a BUY signal, break 3026, target 3037. When the US session breaks 3037, keep the order until 3045. The 3045 zone gives a good SELL signal for today if the price finds it. When the price reaches 3037 and cannot break this zone when the US enters, it can SELL to 3026, further than 3018. Scenario 2: The price does not break 3026 but falls, then wait for support around 3013 and support 3003.

My Technical Analysis for $TSLA (Tesla)📊 Technical Analysis: NASDAQ:TSLA (Tesla)
🗓️ Updated: March 24, 2025
🚨 Critical Zone Being Tested
After breaking out of a multi-year symmetrical triangle, NASDAQ:TSLA is now retesting the upper boundary of the pattern — perfectly aligned with the key ACTION ZONE (liquidity zone + long-term MAs).
🔵 ACTION ZONE ($245–265):
High-probability decision area. Holding this level could trigger a fresh bullish leg.
🟣 SWING BOX ($180–210):
If support fails, this is the next logical area for a potential bullish reaction.
🟡 FVG Daily ($75–115):
Unmitigated Fair Value Gap. Only relevant in case of a major breakdown.
📉 SMI (Stochastic Momentum Index):
Currently in negative territory, but nearing oversold — watch for a potential reversal.
🎯 Scenarios:
Bullish: Strong rejection from the Action Zone → potential move to $350–400 ✅
Bearish: Breakdown below the blue zone → eyes on Swing Box or FVG for reentry ⚠️
📌 Reminder: This is not financial advice. Always manage risk and wait for confirmation before entering a trade.
💬 What do you think? Is Tesla preparing for a bounce or heading lower?
👇 Share your thoughts in the comments!

24.03.25 Morning ForecastPairs on Watch -
FX:AUDJPY
FX:EURUSD
FX:GBPAUD
A short overview of the instruments I am looking at for today, multi-timeframe analysis down to what I will be looking at for an entry. Enjoy!

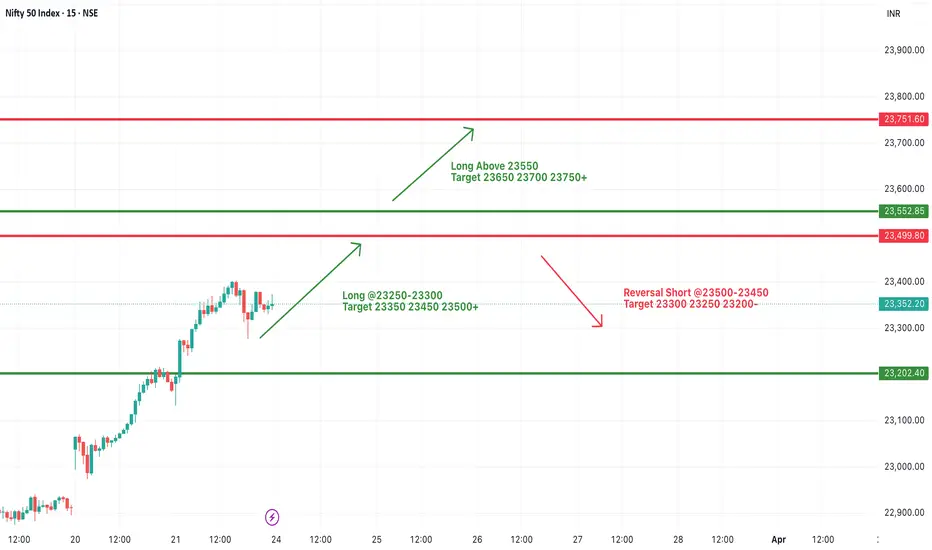
#NIFTY Intraday Support and Resistance Levels - 24/03/2025Today will be gap up opening expected in nifty. Expected opening near 23450 level. After opening if nifty gives breakout and starts trading above 23500 level then expected strong upside rally upto 23750+ level in opening session. 23500-23450 level will act as resistance. Any correction only expected if nifty gives reversal from this level.
[INTRADAY] #BANKNIFTY PE & CE Levels(24/03/2025)Today will be gap up opening in banknifty. After opening expected upside rally upto 50950+ level in today's session. This upside rally can be extend for further 400-500+ points in case banknifty gives breakout and starts trading above 51050 level. Any major downside move only expected below 50450 level.

The Dow Jones Industrial Average (US30) 23 MARCH 2025The Dow Jones Industrial Average (US30) is currently trading within a well-defined ascending channel, maintaining its long-term bullish structure. Price recently tested the lower boundary of the channel, aligning with a strong demand zone around 40,892 - 40,053, and is now showing signs of a potential reversal. The smart money concept (SMC) perspective suggests that institutions may have accumulated positions at this level, preparing for a bullish move toward the 44,500 - 44,800 supply zone. If price sustains above 42,000, buyers could take control, targeting liquidity above previous highs.
From a supply and demand standpoint, the 40,892 - 40,053 level acted as a key demand zone, where buyers aggressively stepped in to defend the trend. The next area of interest is the 44,502 - 44,809 supply zone, which aligns with historical resistance. If price reaches this level, we may see profit-taking or a potential rejection. However, a break above 44,809 would indicate bullish continuation toward new all-time highs.
On the fundamental side, several factors support a potential bullish move. Federal Reserve policy remains a key driver; if the Fed signals rate cuts later in 2025 due to slowing inflation, equities could rally further, benefiting the Dow. Additionally, US economic resilience, strong labor markets, and robust earnings from industrial and financial sectors could provide further upside momentum. On the downside, risks remain from geopolitical tensions, trade wars, and inflation concerns, which could create volatility and potential corrections.
Given these factors, a long trade setup appears favorable. The ideal entry point would be near 42,000, aligning with trendline support and demand. A stop-loss below 40,800 would protect against an unexpected bearish break. Take-profit targets include 44,500 (supply zone) and 44,800 (liquidity sweep level), where price may face resistance. However, if price fails to hold 42,000, a deeper retracement toward 38,473 could be possible before the next bullish impulse.
Would you like me to refine this setup further with risk management and position sizing details? 🚀

Bullish on Monthly TF but..Bullish on Monthly TF.
No Bearish Divergence on Monthly Tf.
But 40 - 40.20 is a Very Strong Resistance
that needs to Cross & Sustain with Good Volumes to
reach 45 - 46 & then 50+
We should not ignore that it has taken Support
from a Very Important Fib level around 32.40
Monthly Closing above 33.60 would be a Very Healthy sign.
So any dip towards 36.50 - 37.50 & then 34.50 - 35.50
can be a Buying Opportunity.
However, it should not break 31.80 otherwise we
may witness further Selling Pressure towards 28.50 - 28.70

BTC/USDT Bearish Setup – Sell Limit & Target ZonesMarket Overview:
Bitcoin (BTC/USDT) is currently trading within a well-defined descending channel after an extended bullish rally. The price action shows signs of a lower high formation, indicating a possible continuation of the downtrend. This setup aligns with a sell limit strategy, anticipating a rejection from a key resistance level before a potential decline toward lower support areas.
Technical Breakdown:
📉 Descending Channel Formation:
BTC has been trading in a downward-sloping parallel channel, with multiple touches on both the upper and lower boundaries.
The price is currently attempting to retest the upper trendline of the channel, which could act as strong resistance.
💰 Sell Limit Placement at Resistance ($88,907):
The chart highlights a key resistance level at $88,907, which aligns with:
The upper boundary of the descending channel.
A previous supply zone, where sellers were active.
A potential area of rejection, leading to further downside.
📌 Fair Value Gap (FVG) & Handle Trendline:
The D1 Fair Value Gap (FVG), marked on the chart, suggests an imbalance in price that may get filled before any reversal.
Additionally, BTC is hovering around the upper trendline of the handle formation, making this a crucial confluence zone for decision-making.
📊 Bearish Target Levels:
Primary downside target: $74,431 – A strong historical support and previous reaction zone.
Secondary target: $73,829 – This level coincides with the mid-level of the fair value gap.
Final bearish target: $68,972 – The lowest target inside the demand zone, potentially acting as a key reversal point.
🚨 Bearish Confirmation:
If BTC gets rejected from the sell limit zone ($88,907) and breaks below support structures, it could trigger a further decline.
Break of trendline support + volume confirmation will strengthen the bearish bias.
Trading Plan:
✅ Sell Limit Entry: $88,907
🎯 Target 1: $74,431
🎯 Target 2: $73,829
🎯 Target 3: $68,972
❌ Invalidation: A strong breakout above $88,907 with volume could invalidate this setup.

EURUSD – Rising Wedge Breakdown | FVG in PlayEURUSD has broken down from a Rising Wedge pattern on the 1H timeframe, suggesting a bearish momentum shift after a strong rally. The current price action indicates a likely continuation lower, targeting the Fair Value Gap (FVG) zone and major support near 1.07047.
📊 Technical Breakdown
1. Rising Wedge Pattern
A clean bearish rising wedge formed during the uptrend, with price contracting upward and volatility drying.
The breakdown from this wedge came with strong bearish momentum, confirming the pattern's bearish bias.
2. Fair Value Gaps (FVGs) as Draws on Liquidity
Two unmitigated FVGs lie below current price:
First zone near 1.0780
Second deeper zone near 1.07047, aligning with the projected measured move of the wedge breakdown.
These zones act as magnetic targets for price to fill inefficiencies and collect liquidity.
3. Bearish Retest Structure
Price is currently forming a potential retest of the broken wedge structure, which could provide an ideal short entry opportunity.
Expected continuation downward upon rejection from this retest zone.
🧠 Trade Idea
Entry Zone: After confirmation of rejection near 1.0850 (retest of wedge)
Target: 1.07047 (FVG & measured move confluence)
Stop Loss: Above 1.0885 (above wedge structure)
Risk-Reward: Solid setup with FVG and structure confluence
⚠️ Key Levels to Watch
Resistance: 1.0850–1.0880 (wedge retest)
Support/Target: 1.07047 (FVG fill + structure)
Break back above 1.0900 invalidates the short setup.

dogeusdt longi think it can go up....
for swing it can be good
its time to start new wave
what do you think?

Bullish Reversal with Inverse Head & Shoulder + QuasimodoEthereum is currently showing strong bullish potential on the 1-hour chart, forming a powerful confluence of reversal patterns—Inverse Head & Shoulders and the Quasimodo Pattern. These patterns often indicate trend exhaustion and signal a shift in momentum.
📊 Pattern Analysis
1. Inverse Head & Shoulders Pattern
This pattern is a classic bullish reversal setup.
The structure is well-defined:
Left Shoulder: Forms after a local downtrend.
Head: Makes a deeper low.
Right Shoulder: Higher low indicating reduced selling pressure.
The neckline has just been breached, suggesting the breakout has begun.
2. Quasimodo Pattern (QM)
Often forms at key reversal points.
Characterized by a head and shoulders structure with a lower low (head) and a higher low (right shoulder).
Acts as additional confirmation of a reversal with tight invalidation zones.
The Quasimodo zone also aligns with strong demand just below $1,970.
🎯 Target Projection
The projected minimum target is measured from the bottom of the head to the neckline, then added to the breakout point.
Target: ~$2,121.41
This implies a 5.38% potential move from the breakout zone.
The yellow highlighted area marks a potential supply zone, where price could face resistance.
🧠 Trade Considerations
Entry: On breakout above neckline (already triggered).
Confirmation : Look for bullish candles + volume spike.
Retest Entry: If price revisits the neckline (~$2,000 zone) and holds as support, it provides a second chance entry.
Invalidation: A break below the right shoulder (~$1,965) would invalidate the pattern setup.
Stop Loss Idea : Below the head or right shoulder depending on risk tolerance.
📌 Confluence Factors
Dual bullish reversal patterns (H&S + QM)
Breakout in progress with bullish momentum
Strong price reaction from the higher low confirms buyer interest
Room to run into previous supply zone around $2,120–2,140

Bitcoin (BTCUSD) - Bullish Breakout from Strong Falling WedgeBitcoin is currently showing signs of a potential breakout from a strong falling wedge pattern on the 4H chart, which is a classic bullish reversal signal.
🔍 Technical Highlights:
The falling wedge has been forming since late January, creating a series of lower highs and lower lows.
Price action is now consolidating near the wedge resistance, indicating an impending breakout.
A previous bullish leg saw a price rally of 25,428.16 (+30.29%), suggesting strong historical momentum.
If BTC breaks out cleanly, we could see a similar or stronger move—projecting a potential rally of 28,086.24 (+31.12%).
📈 Expected Target : ~$118,141, aligning with the measured move from the wedge breakout.
🧠 Trading Insigh t: Watch for a confirmed breakout with strong volume above the wedge resistance zone. Retests of the breakout area can offer ideal entries for continuation trades.

GBP/USD LONGHi !
Based on the current price action and I have prepared 2 trades for next week.
First is a long position from 1.287 where is VAL , price has respected this area, making it a good level for initiating a smaller long position with limited risk.
Forward I am looking at 1.3 area and looking to scaling in after confirmation above 1.302 ensures that I participate in the trend continuation without overexposing prematurely.
Step 1: Small Entry at 1.287
Entry: Long position at 1.287.
Stop Loss: Below 1.2800.
Take Profit: Partial profit near resistance at 1.3000, or hold until breakout confirmation.
Step 2: Scale In After Breakout
Entry Trigger: Wait for price action to break and hold above 1.302 (confirmed by strong candlestick close or volume spike).
Entry Price: Enter larger position at 1.302.
Stop Loss: Below recent breakout level (~1.295).
Take Profit Levels:
First Target: 1.3200.
Second Target: 1.3400.
FX:GBPUSD

Bullish on Bigger Time Frames.Bullish on Bigger Time Frames.
Immediate Resistance is around 126 - 127.
Potential to touch 200 is 127 is Sustain on
Monthly Basis.
On the flip side, 101 - 111 is the Support level
(if it takes pressure now.
Now it should not Break 89.

+20% During The Holidays - Who Said December Was Slow? In this video I break down multiple positions on FX:CADCHF through just the first week of December 2024. I hope this acts as a reminder to never switch off, you cannot afford to. Entering the holiday season early and dropping your guard can cost you a lot of money and potential scale-ups on capital.

Gold price analysis March 21⭐️Fundamental Analysis
The Federal Reserve’s forecast of only two 25 basis point (bps) rate cuts by the end of the year helped the US Dollar (USD) gain positive momentum for the third consecutive day, which, in turn, is seen as undermining the commodity. The decline could also be due to some profit-taking heading into the weekend.
However, bets that the Federal Reserve (Fed) will continue its rate-cutting cycle will limit the USD’s gains and act as a non-yielding driver for Gold prices. Moreover, uncertainty over US President Donald Trump’s aggressive trade policies and their impact on the global economic outlook, coupled with geopolitical risks, deter traders from placing strong bearish bets on the safe-haven bullion.
⭐️Technical analysis
D1 candle has started to show a bearish candle after many consecutive days of increase. However, the buyers have pushed the price from the 3026 area, showing that a strong buying force is still in this area.
The European session, gold traded within the 3025 and 3038 range, the h4 structure shows this. Gold is pushing up to 3038, until the end of the European session, gold cannot break 3038, giving a SELL signal to 3025, the US breaks 3025, then it heads towards support 3008. In the opposite direction, Gold pushes back to 3025 first and does not break this area in the European session, giving a BUY signal to 3038 and heads towards ATH when the US breaks this area. Pay attention to the 2 areas of 3025 and 3038 to trade breakouts.

21.03.25 Morning ForecastPairs on Watch -
FX:NZDJPY
FX:AUDJPY
FX:EURUSD
FX:GBPUSD
A short overview of the instruments I am looking at for today, multi-timeframe analysis down to what I will be looking at for an entry. Enjoy!

#NIFTY Intraday Support and Resistance Levels - 21/03/2025Flat opening expected in nifty. Expected opening near 23200 level. This level will act as an immediate resistance for nifty. Any downside reversal expected from this level. Downside 23000 level will act as a strong support for today's session. Any downside movement can revers from this support level. Strong upside rally expected if nifty starts trading above 23250 level. This rally can be 200-250+ points in today's session.

[INTRADAY] #BANKNIFTY PE & CE Levels(21/03/2025)Today will be flat opening expected in banknifty. After opening if it's sustain above 50050 level then expected upside rally upto 50450+ level in opening session. Any major downside only expected below 49950 level. Downside 49550 level will act as a strong support for today's session.

20.03.25 Morning ForecastPairs on Watch -
FX:EURUSD
FX:GBPUSD
FX:AUDJPY
FX:NZDJPY
A short overview of the instruments I am looking at for today, multi-timeframe analysis down to what I will be looking at for an entry. Enjoy!

#NIFTY Intraday Support and Resistance Levels - 20/03/2025Gap up opening expected in nifty above 23000 level. After opening if nifty sustain above this level then expected strong upside rally upto 23250+ level in today's session. Any downside movement only expected below 22950 level. Downside 22750 level will act as a strong support for today's session. Any major downside only expected below this support level.
