Gold Price Analysis March 4⭐️Fundamental Analysis
The market is concerned about the risk of a global tariff war that seems inevitable. US President Donald Trump affirmed to impose 25% tariffs on Canada, Mexico and increase tariffs on China to 20%, leading to retaliatory measures from China and Canada, which could escalate into a full-blown trade war.
In addition, Trump suspended military aid to Ukraine, causing tensions with European allies. The market continues to monitor the upcoming US employment data, which could impact the Fed's interest rate policy, affecting the USD and gold prices.
⭐️Technical Analysis
Today's price range is focused on 2905 and 2877. The Dow trend will still be prioritized when Gold finds it difficult to close above important resistance zones. The Sell zones of 2905 and 2918 are heavily concentrated by sellers today. The furthest target of the week for gold will be to touch the bottom of last week around 283x. Pay attention to important price levels to have a reasonable BUY and SELL strategy.
Priceactionanalysis


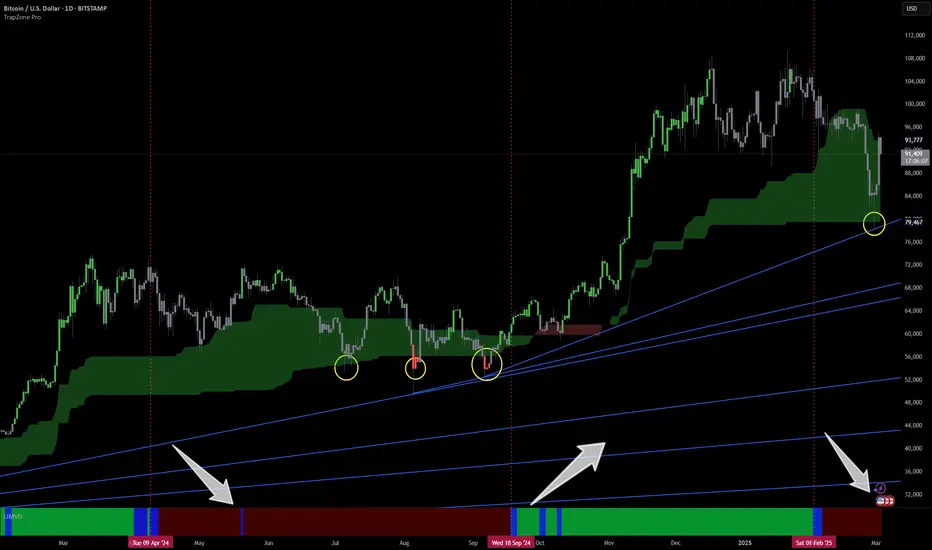
BITCOIN Technical analysis - This price action is familiar!See for yourself.
Since Apr 24 we had red UMVD and market went sideways. This is exactly what's happening right now. We have RED UMVD after a new high and now we just had first bounce from the bottom Green TrapZone. No Longs till we get fresh GREEN UMVD.
Small size plays only till, buy the bottom and sell the tops with this red UMVD.
Will post the hourly for close up next. Happy trading and stay safe, dear snowflakes!
04.03.25 Morning ForecastPairs on Watch -
FX:EURUSD
FX:GBPUSD
A short overview of the instruments I am looking at for today, multi-timeframe analysis down to what I will be looking at for an entry. Enjoy!

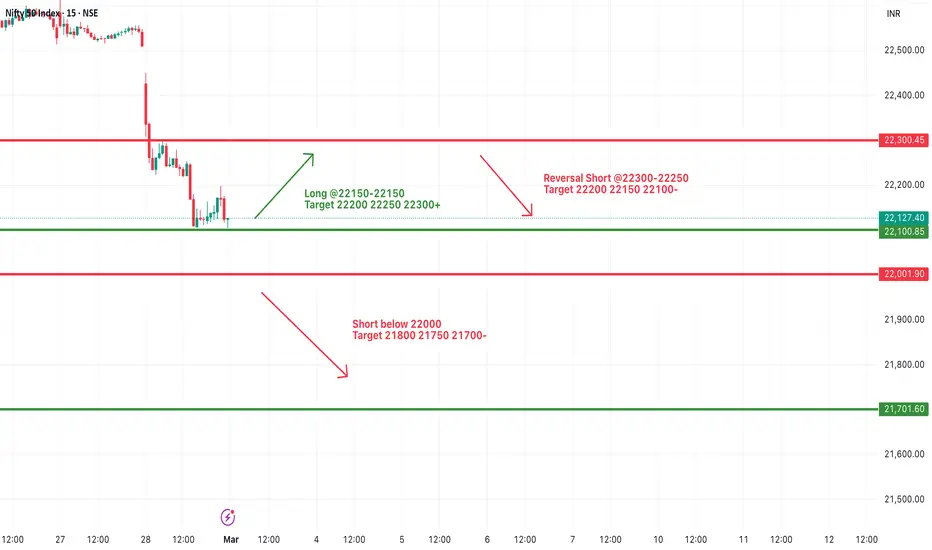
#NIFTY Intraday Support and Resistance Levels - 04/03/2025Gap down opening expected in nifty near the 22050 level. After opening if nifty sustain above 22050 level then only expected upside movement in index. Upside 22300 level will act as a strong resistance for today's session. Major downside fall expected in nifty in case it's starts trading below 22000 level. This downside can goes upto 21700 level.

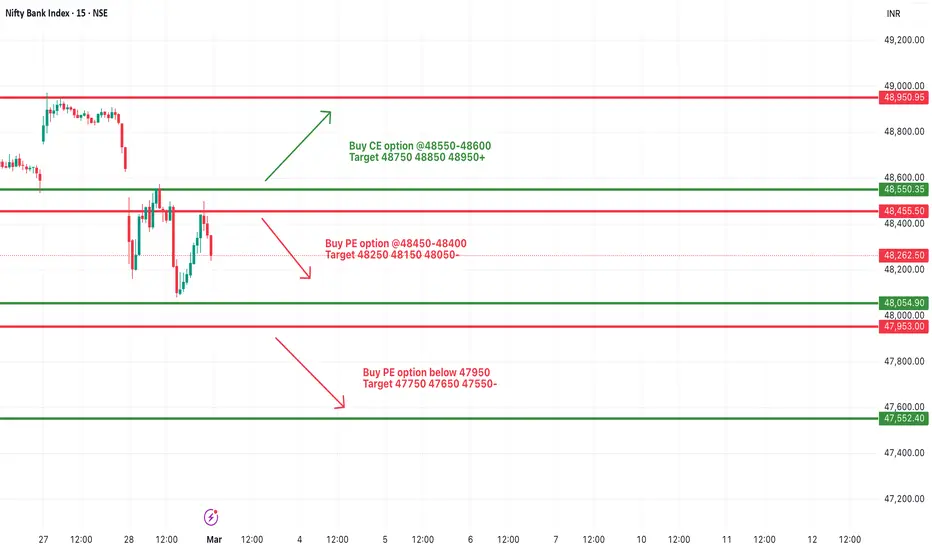
[INTRADAY] #BANKNIFTY PE & CE Levels(04/03/2025)Today will be slightly gap down opening expected in market. After opening important level for banknifty is 48050. If it is sustain above this level then expected upside rally upto the 48450 level. Major downside expected below 47950. This downside can be possible of 400-500+ points in index. Upside 48450 level will act as a strong resistance for today's session.

EUR/USD: Bearish Outlook – Targeting 1.03630 & Below 📊 Market Structure & Key Levels
EUR/USD is currently rejecting a key supply zone (1.0450 - 1.0480), showing strong signs of continued downside pressure. The pair is in a bearish trend, with price action confirming lower highs and lower lows, as seen in the Prime Market Terminal charts.
📉 Key Levels to Watch:
Supply Zone: 1.0450 - 1.0480 (Strong resistance & liquidity zone)
Demand Zone: 1.03630 - 1.03219 (Institutional liquidity target)
Extended Bearish Target: 1.02687 (Deep liquidity grab area)
🔍 Trade Setup: Bearish Bias Towards Key Support Levels
📌 Entry: Sell between 1.0450 - 1.0480
🎯 TP1: 1.03630 (Liquidity Zone)
🎯 TP2: 1.03219 (Institutional Liquidity Grab)
🎯 TP3: 1.02687 (Extended Downside Target)
❌ SL: 1.05150 (Above Key Resistance)
📉 Why This Trade? (Prime Market Terminal Analysis)
✔️ Bearish Market Structure – The 1D & 4H trend remains bearish, confirming a downward trajectory. Supertrend is bearish, and price is trading below the 72 EMA & 288 EMA, showing weak bullish momentum.
✔️ Liquidity Targets Identified – Market depth analysis from Prime Market Terminal reveals a lack of strong buy orders above 1.0450, suggesting that sellers dominate.
✔️ Volume Profile Analysis – The visible range (VPVR) highlights a high-volume node at 1.03630, making it a strong area for price to seek liquidity.
✔️ Commitment of Traders (COT) Data – Institutional positioning indicates an increase in short contracts for the EUR, aligning with the bearish trend.
✔️ Order Flow & Market Depth – Prime Market Terminal shows institutional sellers stacking sell orders at 1.0450, while liquidity pools rest below 1.03630 and 1.03219, making these ideal targets for price.
📰 High-Impact News to Watch
⚠️ HICP Flash Inflation Data (EUR - March 3, 2025) – Any deviation from expectations could drive EUR volatility.
⚠️ ISM Manufacturing PMI (USD - March 3, 2025) – A stronger-than-expected report could strengthen USD and drive EUR/USD lower.
⚠️ Fed's Musalem Speech (March 3, 2025) – A hawkish stance could accelerate EUR/USD downside pressure.
📌 Final Thoughts: Follow the Trend & Manage Risk!
EUR/USD remains firmly bearish, with liquidity resting below 1.03630. The confluence of institutional positioning, bearish trend confirmation, and market depth insights support a sell bias. Watch price action at key levels and manage your risk accordingly!
🔥 What’s your bias? Drop your thoughts in the comments! 🔥

Let us Swing GBPUSD !!!Hello everyone, happy new week and a happy new month of March to you all !!!
First of, fundamentals are heavy on the pounds this week, coupled with the fact that this is non-farm payrolls week. (Fundamentals).
Secondly, there was a market Structure shift last week which is signaling more bearish momentum.
This setup overall has a stop loss of less than 40 pips from the H4 Order Block but if you need a tighter Stop, you definitely can go sharpen the entry in a lower timeframe.
Use proper risk and money management and do not over-leverage your account.
Most especially, do your own analysis !

Brenker block or Order Block + Inducement = Profits EverywhereHello everyone, happy new week and a happy new month of March to you all !!!
First of, fundamentals are heavy on EURUSD this week, like really heavy. Coupled with the fact that this is non-farm payrolls week. (Fundamentals).
Secondly, there was a market Structure shift last week which is signaling shorts.
This setup overall has a stop loss of less than 35 pips from the breaker block but if you need a tighter Stop loss then you can use the other point of interest which is the order block i marked out.
Use proper risk and money management and do not over-leverage your account.
Most especially, do your own analysis !

Gold price analysis March 3💥Fundamental Analysis
European leaders are drafting a peace plan to present to Washington, raising hopes for a resolution to the conflict.
This optimism has pushed the Euro (EUR) to rise sharply, putting pressure on the US Dollar (USD) and pulling gold prices back up. In addition, the USD continued to weaken as China's manufacturing PMI data beat expectations, indicating an improvement in the global economy.
The cryptocurrency market also recorded a strong recovery after former President Donald Trump directed the establishment of a Strategic Reserve of cryptocurrencies, including Bitcoin, Ethereum, XRP, Solana and Cardano. This further increased pressure on the USD, helping gold regain momentum after two days of downward correction last week.
💥Technical Analysis
Gold prices are recovering towards resistance at 2890. Last week's old bottom support at 2836 is also important at the moment. These two zones are considered as two notable price zones, closing above these two zones is confirmation of strong trend continuation. 2782 is considered as Gold's weekly support zone. 2916 acts as the only barrier before Gold moves to the next ATH.
Note the important price zones for BUY and SELL signals

03.03.25 Morning ForecastPairs on Watch -
FX:USDJPY
A short overview of the instruments I am looking at for today, multi-timeframe analysis down to what I will be looking at for an entry. Enjoy!

Gold Price Analysis February 28⭐️Fundamental Analysis
This week, the US Dollar (USD) continued to recover on expectations that the Federal Reserve (Fed) will keep its monetary policy tight as inflation remains high. This caused money to flow out of gold - a non-yielding asset.
In addition, gold prices fell as investors adjusted their positions ahead of the US release of important inflation data, a factor that could affect the Fed's interest rate decision and the short-term direction of gold. However, concerns about former US President Donald Trump's tariff policy and risk-off sentiment could help gold hold its price. In addition, falling US Treasury yields also contributed to limiting gold's decline
⭐️Technical Analysis
After closing yesterday's candle, gold confirmed a clear downtrend. The SELL zone that is being watched by investors today is around 2889. Any price increase today is considered a great opportunity to sell. 2840 is considered as the support zone today. The wider price range is being watched when there are signs of Break out from the narrow range at 2920 and 2806. Currently, gold needs to break through 2870 to reach the upper range and if it fails to break 2870, we can set SELL signals at 2840 today.

#NIFTY Intraday Support and Resistance Levels - 03/03/2025Gap up opening expected nifty near 22300 level. After opening expected reversal from this level. Downside 22000-22100 zone will act as a strong support for nifty. Any strong further bearish rally only expected below 22000 level. In case nifty gives breakdown of this level can leads major downside upto 21700.
[INTRADAY] #BANKNIFTY PE & CE Levels(03/03/2025)Today will be gap up opening expected in index near 48500 level. After opening expected reversal from this level for further downside in market. Major downside expected if banknifty starts trading below 47950 level this downside rally can goes upto 47550 level. Any bullish rally only expected if banknifty starts trading and sustain above 48550 level.
USDJPY analysis week 10Fundamental Analysis
The Japanese Yen (JPY) continued to weaken against the US Dollar (USD), pushing the USD/JPY pair above the psychological 150.00 level in late US trading on Friday. Japanese government bond (JGB) yields fell after Prime Minister Shigeru Ishiba’s government cut its fiscal 2025 budget plan.
However, any meaningful depreciation in the JPY appears to be far off after the Bank of Japan (BoJ) increasingly accepted that it would continue to raise interest rates this year.
Furthermore, USD bulls may refrain from placing aggressive bets and opt to wait for the release of the US Personal Consumption Expenditures (PCE) Price Index for clues on the Federal Reserve’s rate-cutting path.
Technical Analysis
USDJPY is heading towards the technical resistance level of 151.200 where sellers are waiting quite a bit. When sellers in this 151,200 price zone cannot push below 150,100, the uptrend will continue to be maintained to the weekly target around 152,200. Note that the weekly support zone of 149,400, if broken, will form a long-term downtrend chain of this currency pair.

ETHUSDT Long by TeamPWRTradesTeamPWRTrades ETH Long Idea
Although the general Crypto market has been showing weakness, we are expecting Bullish movement for ETH in the next coming days. Based on Daily candles there is still a possibility of ETH heading towards it's daily support zone at 1800. Our team recommends using low leverage 1-2% of capital for this trade due to the daily volume signaling a possibility of ETH reclaiming 2500-2800 zone.
Enter
1: 2160
2: 2210
TP1: 2500
TP2: 2800
SL: 2088
Trade Active
Happy Trading,
TeamPWR

Move toward the level of 73,000 unitsAccording to the January 21 analysis, after identifying the trading range and determining its highs and lows, we expected Bitcoin to complete this pattern at 92,303.
However, after reaching this level on the daily timeframe, the price made a strong spike, breaking the large trading range between 92,303 and 106,436, entering a new phase and movement.
After its adventure at 86,903, this asset continued its downward movement, breaking through this range as well. Currently, it has reached a new price level at 80,000, driven by the strong spike movement.
Now, we must wait to see whether this direct movement will continue or if it will proceed with some delay and consolidation.
It is important to note that if this level is lost, Bitcoin’s price on the daily timeframe could potentially extend its move down to 73,000, which is also the expected level. The reason is that such a strong spike movement requires a powerful support level for correction or a temporary halt in this dominant wave.

28.02.25 Morning ForecastPairs on Watch -
FX:AUDNZD
FX:GBPUSD
FX:EURUSD
A short overview of the instruments I am looking at for today, multi-timeframe analysis down to what I will be looking at for an entry. Enjoy!

[INTRADAY] #BANKNIFTY PE & CE Levels(28/02/2025)Today will be gap down opening expected in banknifty near 48550 level. After opening this is the important support for today's session. Major downside only expected if banknifty starts trading below 48450 level. Currently banknifty consolidated in between range of 48550 to 48950 level. Any bullish side rally only expected after the breakout of 49050 level.

EUR/NZD Analysis: Bullish Continuation After Retracement?🔹EUR/NZD 1H Technical Analysis
▪️Market Structure & Trend:
The market is in a bullish structure, forming higher highs and higher lows. The recent price action suggests a potential pullback before continuing the uptrend.
▪️Key Levels
- Support (Point of Interest - POI): 1.83660
- Resistance (Target Area): 1.84930
- Current Price: 1.84052
▪️Price Action & Expected Movement:
- The price has reached a short-term resistance zone and is showing signs of consolidation.
- A retracement to the POI (1.83660) is likely before further upside movement.
- If buyers step in at this demand zone, a bullish continuation toward the 1.84930 target is expected.
▪️Trade Considerations
- Bullish Scenario: Look for confirmation of support at the 1.83660 zone before entering a long position.
- Bearish Scenario: A break below the POI could indicate further downside, invalidating the bullish bias.
▪️Conclusion:
The market remains bullish, but a short-term pullback to the 1.83660 support zone could offer an optimal buy opportunity for a move toward 1.84930. Traders should watch for bullish confirmation signals at the POI before entering a trade.
😊Don't Forget To Hit The Like Button & Share Your Thoughts In Comments.

Gold Price ActionHello Traders,
I have marked a key zone on the 4-hour chart, highlighting liquidity areas that need to be grabbed. Based on this setup, there is a strong possibility that the price will rise.
Looking at today's economic forecast, the USD appears slightly weaker due to higher-than-expected unemployment claims. Additionally, I have identified divergence, which further supports a potential bullish move.
You can consider entering a long position, but always ensure proper risk management. Stay disciplined, avoid over-leveraging, and don’t let greed take over.
Wishing you all the best and happy trading!
Thank you.

27.02.25 Morning ForecastPairs on Watch -
FX:AUDNZD
FX:NZDUSD
OANDA:AU200AUD
FX:EURUSD
A short overview of the instruments I am looking at for today, multi-timeframe analysis down to what I will be looking at for an entry. Enjoy!

#NIFTY Intraday Support and Resistance Levels - 27/02/2025Flat opening expected in nifty. After opening important level to watch is 22500. If nifty starts trading below this level then sharp downside rally expected upto 22300 in opening session. Any upside move only expected if it's sustain above 22550 level. Upside 22750 level will act as a resistance for today's session.
