Gold Analysis May 25⭐️Fundamental Analysis
Market sentiment remained cautious on Tuesday due to concerns over Trump tariffs and Nvidia's upcoming earnings report. The US dollar continued to hold its strength on risk-off sentiment, limiting gold's gains. However, gold prices remained supported by falling US Treasury yields and rising trade war risks.
Bond yields fell on a strong auction and weak PMI data, raising expectations that the Fed will cut interest rates twice this year. Meanwhile, trade tensions escalated as the Trump administration considered tightening controls on chip exports to China.
⭐️Technical Analysis
Gold prices are still operating in a wedge of 2928 and 2952. The 2958 zone is also quite easy to create a false ATH. 2968-2970 acts as the most important resistance for Gold at the moment, which is considered the weekly resistance level. Watch out for gold falling, there could be a deep drop to 2906-2900.
Priceactionanalysis

$104K and Counting: Can Bitcoin Sustain Its Momentum?COINBASE:BTCUSD - Daily
Current Price: 97,520
Executive Summary:
Is Bitcoin Set for a Correction After Hitting $104,000?
Bitcoin has hit significant milestones, with two of our predicted targets—$90,000 and $100,000—successfully achieved, delivering a remarkable gain of 46.44% and 3,307,221 pips. After climbing to $104,000, Bitcoin entered extreme overbought territory across daily, weekly, and monthly charts, signaling exhaustion. With the formation of an ascending channel and overbought signals, a potential correction could be on the horizon. Here’s what to expect next.
Analysis:
In our earlier analysis, we predicted key price targets of $90K, $100K, and $110K. Bitcoin successfully hit $90K and $100K, eventually climbing to $104K—a remarkable gain of 46.44% and 3,307,221 pips. However, this rally propelled Bitcoin into extreme overbought territory across multiple timeframes, signaling a potential need for correction.
On November 6, Bitcoin broke out of a falling wedge/handle pattern, driving the price to $104K. Since November 12, it has been ascending within a channel—a formation that often precedes a downward correction. Coupled with extreme overbought conditions on daily, weekly, and monthly charts, Bitcoin now shows clear signs of buyer exhaustion.
Potential Correction Level:
Fibonacci Retracement (50%): $85,327.80
Key Levels to Watch:
• Extreme Overbought: $112,500
• Overbought Resistance: $106,250
• Ultimate Resistance: $100,000
• Major Support: $75,000
Thank you for taking the time to read this analysis. Wishing you great success in your trading journey! Always prioritise proper risk management to achieve sustainable growth in the markets. Good luck with your trades!

25.02.25 Morning ForecastPairs on Watch -
FX:EURCAD
FX:EURNZD
A short overview of the instruments I am looking at for today, multi-timeframe analysis down to what I will be looking at for an entry. Enjoy!

#NIFTY Intraday Support and Resistance Levels - 25/02/2025Slightly gap down opening expected in nifty. After opening if nifty starts trading below 22500 level then possible sharp downside of 150-200 points occurs in nifty. This downside rally can goes upto the 22300 level. Upside 22750 will act as a major resistance for today's session. Any upside rally can be reversal from this level.

[INTRADAY] #BANKNIFTY PE & CE Levels(25/02/2025)Today will be slightly gap down opening expected in banknifty near 48550 level. After opening if banknifty starts trading below 48450 level then possible strong downside rally in index towards the 48050 level. Any bullish side rally only expected if it's sustain above 48550 level. Upside 48950 level will act as a strong resistance. Any bullish side rally can be reversal from this level.

Gold price analysis February 24⭐️Fundamental Analysis
The uncertainty surrounding former US President Donald Trump's tariff policy and global economic risks continue to strengthen gold's role as a safe-haven asset. In addition, geopolitical tensions and pessimistic sentiment towards the US Dollar (USD) also contributed to supporting gold prices.
However, expectations that the US Federal Reserve (Fed) will maintain high interest rates to control inflation have limited the upside of this precious metal. Investors are now focused on the US Personal Consumption Expenditures Price Index (PCE) report on Friday, important data that could influence the Fed's interest rate policy, impact the USD and the next trend of gold prices.
⭐️Technical Analysis
Gold is currently relatively difficult to trade and pay attention to the Gold range around 2953 and 2906. A relatively wide range. The further range of 2978 and 2873 will be noticed this week. In the end of the H4 candlestick session, it closed above 2941. Gold will soon have a price of 2953. On the contrary, when gold closes below 2933, we can wait for a retest around 2938-2940 to SELL. TP Gold is still around 2923. If we break this area, pay attention to 2906. Wish you a successful trading day.

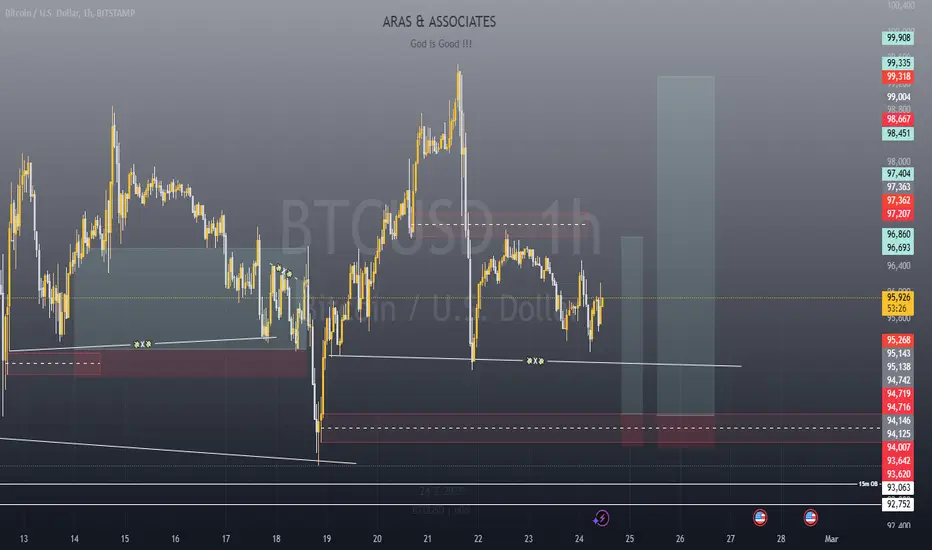
Rinse & Repeat !!!Hello everyone, a happy new trading week to you all !.
This setup is particularly a short-term buy for those looking to take advantage of BTC's range that has been refusing to take a side.
A good RRR trade that's sure to make you a bit of money. Use proper risk and money management (risk what you're willing to not get bothered by) and most especially, do your own analysis for extra confluence !.
24.02.25 Morning ForecastPairs on Watch -
FX:EURCAD
A short overview of the instruments I am looking at for today, multi-timeframe analysis down to what I will be looking at for an entry. Enjoy!

#NIFTY Intraday Support and Resistance Levels - 24/02/2025Flat or slightly gap down opening expected in nifty. After opening important level is 22750. In case nifty starts trading below this support level then possible strong downside rally in index upto 22550 in today's session. Any upside rally only expected if nifty sustain above 22800 support level. Upside 23000 level will act as a strong resistance for any bullish side rally.

[INTRADAY] #BANKNIFTY PE & CE Levels(24/02/2025)Today will be flat opening expected in banknifty. After opening if banknifty starts trading below 48950 level then expected sharp downside rally in index upto 48550 level. This downside rally can be extend for further 400-500+ points downside in case banknifty gives breakdown of 48450 level. Any bullish side rally only expected if it is starts trading and sustain above the 49050 level. Upside 49450 level will act as a strong resistance for today's session.

GBPNZD +4.5% Win Trade RecapA FX:GBPNZD short position I took in the last trading week, resulting in a +4.5% win.
Top down analysis explained in the video and also my reasons for the lower timeframe entry in combination with the manual close decision.

21.02.25 Morning ForecastPairs on Watch -
FX:GBPUSD
FX:GBPCAD
FX:COPPER
A short overview of the instruments I am looking at for today, multi-timeframe analysis down to what I will be looking at for an entry. Enjoy!

Gold price analysis February 21⭐️Fundamental Analysis
Gold prices fell as investors booked profits ahead of the release of key US economic data, including PMI and PCE inflation.
The Fed minutes did not change expectations for two rate cuts this year, but maintained a cautious stance. If the economy is strong and inflation is high, the Fed may not be in a hurry to ease policy.
Gold prices may fluctuate in the short term following economic data, but are still supported by concerns about Trump's tax policies and Russia-Ukraine tensions.
Despite the correction, gold remains a safe haven, and dips can be good buying opportunities.
⭐️Technical Analysis
Gold price is heading towards 2920 and this area is the most important area for gold today. When breaking 2920, pay attention to the 2906 area for BUY signals and just wait for the test beats to sell around 2920 when this area is broken. When gold bounces from 2920, the market continues to want to increase. As long as there is any close above 2928, gold will soon regain the resistance level of 2944. Wish everyone the best trading strategy.

Gold price analysis February 20⭐️Fundamental Analysis
The rally came after US President Donald Trump said a trade deal with China was possible. Geopolitical concerns increased after US President Trump said Ukraine had started a war with Russia and hinted that it was time to pay back all the aid it had provided to the US.
Meanwhile, the Federal Reserve (Fed) meeting minutes from Wednesday night had little impact. Only a few members of the Federal Open Market Committee (FOMC) favored stable interest rates and were in no rush to cut. Considering this, the possibility of a rate cut in June remains.
⭐️Technical Analysis
Gold prices are currently difficult to trade as they are at an all-time high. any recovery to the breakout points is considered the best opportunity to buy gold towards the 3000 peak. Watch for recovery points around 2940-2920 for BUY signals and watch the 2970 area as today's major resistance.

#NIFTY Intraday Support and Resistance Levels - 21/02/2025Gap down opening possible in nifty near the 22800 level. After opening important support for nifty is 22750-22800 range. Major downside expected in nifty in case it gives breakdown of this level and starts trading below 22700. This downside can goes upto 22500 level in today's session. Any bullish rally only expected above 23050 level.

[INTRADAY] #BANKNIFTY PE & CE Levels(21/02/2025)Today will be gap down opening expected in banknifty. Expected opening near 49000 level. After opening if banknifty starts trading below 48950 level then possible sharp downside rally upto 48550 level. Any bullish rally only expected above the 49550 level.

GBP/USD Trade Recap – A Perfect Long Setup 1️⃣ Trade Execution – Why I Took the Long Position
Today’s GBP/USD trade was a textbook example of combining Fibonacci retracements, smart money positioning, and seasonality trends to catch a high-probability long setup.
💡 Entry Details:
✅ Entry: 1.2600 (Fibonacci golden zone)
✅ Stop Loss: 1.2587 (Below structure)
✅ Take Profit: 1.2635 (Key resistance zone)
✅ Risk-Reward Ratio: 3:1
🎯 Result: Hit TP at 1.2635 for a solid profit! ✅
2️⃣ Why This Trade Worked – A Breakdown of the Confluences
📊 Fibonacci Retracement – Perfect Pullback & Reversal
Price retraced to the 61.8%-78.6% Fibonacci zone (1.2600 - 1.2593) before reversing.
The bullish move was expected after a strong impulse leg, following smart money positioning.
📈 Smart Money & Retail Sentiment – Trading Against the Herd
🔹 62% of retail traders were SHORT on GBP/USD (as per DMX data).
🔹 Since I trade against retail sentiment, this provided a strong bullish confirmation.
🔹 Institutional COT data showed big players increasing long positions, further supporting a bullish bias.
🕵️♂️ Seasonality & Historical Trends Supported the Long
📊 15-year seasonality data indicated GBP/USD typically rallies in late February and early March.
📅 The next 3-5 day forecast showed a bullish probability, adding further conviction.
📉 Technical Confirmation – Momentum Indicators & Structure
✅ SuperTrend flipped bullish on the 4H chart
✅ Price was trading above key moving averages (EMA 6, 24, 72, 288)
✅ Broke above short-term trendline resistance, confirming upward momentum
3️⃣ Key Takeaways from This Trade
🔹 Trading with smart money & against retail sentiment = High probability setups
🔹 Seasonality provided extra confidence in taking the long trade
🔹 Using Fibonacci and EMAs for confluence led to a precise entry
🔹 Patience and risk management were key to securing profits
📌 Final Thoughts – What’s Next for GBP/USD?
🚀 With this bullish breakout, I will look for further longs on dips, targeting the next key resistance at 1.2680 - 1.2700.
👀 Are you bullish or bearish on GBP/USD? Let’s discuss in the comments!

#NH , 1D and 1W Bullish Pattern
Looks Very Good in Weekly And Daily Time Frame , It is Ready for Breakout from Pattern .
It has Repeated the same pattern in Past so High chances to go up .
if u find this Chart Helpful pls like and Follow for More like this charts .
I am A Swing Trader , Trade only Price Action Patterns .

usdcny longit seems USD getting stronger specially after trump reelection. if you want to go long on it, it is better to wait for a breakout above 7.3400

20.02.25 Morning ForecastPairs on Watch -
FX:AUDUSD
FX:GBPNZD
FX:GBPJPY
A short overview of the instruments I am looking at for today, multi-timeframe analysis down to what I will be looking at for an entry. Enjoy!

#NIFTY Intraday Support and Resistance Levels - 20/02/2025Today will be flat opening expected in nifty. After opening possible nifty can consolidated in between 22950-23050 level. Any major movement only expected either breakout of 23050 level or downside of 22950 level. Downside 22800 will act as a important support for today's session. Below this support level sharp downside rally expected.

[INTRADAY] #BANKNIFTY PE & CE Levels(20/02/2025)Flat or slightly gap down opening expected in banknifty. After opening if banknifty starts trading and sustain above 49550 level then possible upside rally upto 49950+ level in today's session. Major downside expected if banknifty not sustain above level and starts trading below 49450. This downside can possible of 400-500+ points. Downside 49050 level will act as a strong support for today's session.

Gold price analysis February 19⭐️Fundamental Analysis
Gold prices rose again due to concerns about new tariffs from former US President Donald Trump and the deadlock in negotiations between the US and Russia. Trump announced that he would impose tariffs of 25% or more on pharmaceuticals, semiconductors and automobiles, putting great pressure on European and Asian economies. This raised concerns about supply chain disruptions and global inflation.
In addition, the negotiations between the US and Russia did not progress, causing investors to seek safe assets such as gold and USD. However, the market is still cautiously waiting for the Fed's meeting minutes, because if the Fed maintains its stance of curbing inflation, gold prices may be restrained.
⭐️Technical Analysis
Gold prices reacted around the old peak around 2940, proving that buyers are not strong enough to push prices to create a new ATH and need a more suitable price. There are two price levels 2916-1914 and 2906-2904 which are the areas where the Buyers are very interested in jumping into the market. The price range 2924-2934 is considered as this Asia-Europe range for breakout signals when there are signs of crossing.
