NZDCAD - D, H4, H1 forecast, Technical Analysis & Trading IdeasMidterm forecast:
While the price is above the support 0.79427, beginning of uptrend is expected.
We make sure when the resistance at 0.82009 breaks.
If the support at 0.79427 is broken, the short-term forecast -beginning of uptrend- will be invalid.
Technical analysis:
A trough is formed in daily chart at 0.80285 on 02/12/2025, so more gains to resistance(s) 0.81380 and maximum to Major Resistance (0.82009) is expected.
__________________________________________
❤️ If you find this helpful and want more FREE forecasts in TradingView,
. . . . . Please show your support back,
. . . . . . . . Hit the 👍 BOOST button,
. . . . . . . . . . . Drop some feedback below in the comment!
🙏 Your Support is appreciated!
Let us know how you see this opportunity and forecast.
Have a successful week,
ForecastCity Support Team
Priceactionanalysis

NZDUSD DAILY ANALYSIS 14/02/25NZDUSD is on a strong monthly support level, i see buyers taking back control if todays candle remains engulfed and closes above market demand zone

GBPAUD -1% Loss Trade RecapA FX:GBPAUD short position I took in the last trading week, resulting in a -1% loss.
Top down analysis explained in the video and also my reasons for the weighted timeframe entry in combination with the management decision.

14.02.25 Morning ForecastPairs on Watch -
FX:AUDUSD
FX:GBPUSD
FX:EURAUD
A short overview of the instruments I am looking at for today, multi-timeframe analysis down to what I will be looking at for an entry. Enjoy!

#NIFTY Intraday Support and Resistance Levels - 14/02/2025Gap up opening expected in nifty. After opening possible nifty will trade in between range of 23050 to 23250 in today's session. Any major and further downside only expected if nifty starts trading below the 22950 level. Upside 23250 will act as a strong resistance for nifty. Any strong bullish rally possible if nifty gives breakout of this resistance level.

[INTRADAY] #BANKNIFTY PE & CE Levels(14/02/2025)Today will be slightly gap up opening in banknifty. Since few days banknifty trading in between the range of 49050-49950 level. After opening if it's sustain above 49550 level then possible upside rally upto 49950 resistance level. Similarly downside expected below 49450 level and this can goes upto 49050 support level.

GBPUSD DAILY ANALYSIS 14/02/25GBPUSD has been dancing around a key resistance zone of 1.25500, A daily bullish confirmation breakout has just occured, i see price buying strongly to the next level resistance of 1.28100.

$LUNC Long Setup see on Chart, LUNC Price on the Rise as Terra..LUNC Price on the Rise as Terra Classic Moves Closer to 403B Target
The Terra Luna Classic (LUNC) market rose continuously during five trading days and surpassed its essential resistance barrier. On February 12, LUNC reached its peak value at $0.0000784 while showing a 59% rise relative to its yearly market lows.
LUNC Burn Activity Triggers Price Surge
The upward price trend of LUNC joins altcoins in general, which have recovered from their local winter lows reached on Monday. LUNC’s latest price increase stems directly from the continuous token-burning efforts on the Terra Classic network.
LUNC Metrics demonstrates that the network has destroyed more than 628 million tokens throughout the previous week. The latest round of burning operations has expanded the total destroyed LUNC supply up to 402.78 billion since the initiative commenced.
The current pace indicates that the total burned supply will cross the 403 billion threshold during the latter part of this month. Between on-chain network transactions and Terraform Labs donation amount, 67.86 billion of the total burned tokens have been eliminated thus far, but 334.92 billion tokens were directed toward the burn wallet.
Binance stands out as the primary supporter of LUNC burning through its destruction of more than 70.8 billion tokens, as noted in our earlier post. The burn process received substantial support from the DFLUNC Protocol, which managed to destroy 4.52 billion tokens, along with LunaticsToken, which burned 1.97 billion tokens.
The Terra Classic community believes that ongoing burn operations alongside staking might possibly resolve the issues that affect TerraClassicUSD (USTC).
USTC, the stablecoin that lost its peg during the Terra ecosystem collapse, also recorded a notable surge. USTC price rose above 13.22% today to reach the value of $0.01875. However, the current value of USTC remains 5,233% below its target dollar value of $1, therefore necessitating further increase in price.
LUNC Price Analysis Today
On Wednesday, LUNC price continued surging, trading at $0.00007805, up by 5.12% at press time. A formation of hammer candlestick pattern emerged at this price level with its long lower wick and tiny body structure, which often indicates a bullish reversal move, as mentioned in our previous story.
The LUNC price exceeded the upper boundary forming the pattern of declining wedge. The falling wedge is created by descending trend lines that move toward one another and generally signal bullish price movements. Terra Classic overcame its previous support area at $0.00007140 in early September.
Terra Classic stands to potentially reach its next major resistance point at $0.0001025 after breaking through this barrier because this level corresponds with the 38.2% Fibonacci retracement measure. The future price potential stands at 40% above its current value according to this target measurement. Hence, the current bullish outlook would become invalid if market bearishness drives prices beneath the $0.00005525 support
Disclaimer: This article is for informational purposes only and does not constitute financial advice. Always conduct your own research before making any investment decisions. Digital asset prices are subject to high market risk and price volatility. The value of your investment may go down or up, and you may not get back the amount invested. You are solely responsible for your investment decisions and Binance is not available for any losses you may incur. Past performance is not a reliable predictor of future performance. You should only invest in products you are familiar with and where you understand the risks. You should carefully consider your investment experience, financial situation, investment objectives and risk tolerance and consult an independent financial adviser prior to making any investment.

GBPJPY Price ActionWe’ve already hit our take-profit (TP) target, and the price has now reached the highest volume zone, which is where it previously dropped from. Currently, the price is attempting to form a higher high, but the upward momentum is slowing down. If you look at the volume, there’s a noticeable divergence—price is making progress, but the volume at the bottom isn’t significant, indicating weakness in the move.
For your take-profit levels, you can aim for TP1 which around 250+ pips during the initial impulse move and TP2 which is 450+ pips if the price continues to push higher. Keep an eye on the volume and momentum for confirmation.
Hint - FOR SL Don't use more than 30-40 Pips or MAX 50 Pips Depends Your Lot Size and Risk Management.

13.02.25 Morning ForecastPairs on Watch -
FX:GBPAUD (Live)
FX:EURCAD
FX:USDJPY
A short overview of the instruments I am looking at for today, multi-timeframe analysis down to what I will be looking at for an entry. Enjoy!

[INTRADAY] #BANKNIFTY PE & CE Levels(13/02/2025)Today will be slightly gap up opening expected in banknifty. Any bullish rally only expected if banknifty starts trading and sustain above 49550 level. Further downside expected below the 49450 level. This downside can goes upto 49050 and extend next 400-500+ points in case starts trading below 48950 level.

#NIFTY Intraday Support and Resistance Levels - 13/02/2025Today will be flat or slightly gap up opening expected in nifty. After opening if nifty sustain above 23050 level then only expected upside rally upto the 23250 level. This level will act as a strong upside resistance for today's session. Any bullish rally can give reversal from this level. Below 23000 level sharp downside expected in today's session.

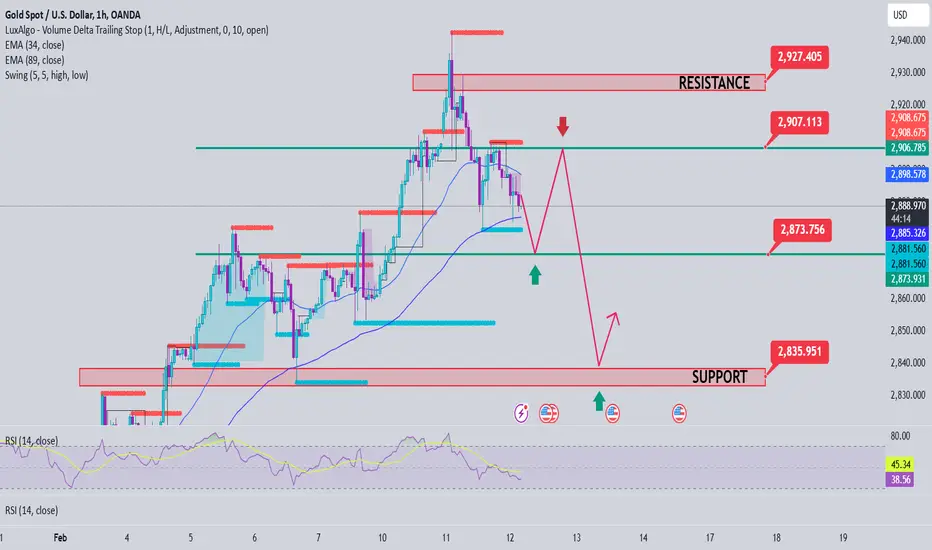
Gold Price Analysis February 12⭐️Fundamental Analysis
Asian and European traders were cautious ahead of Fed Chairman Jerome Powell's remarks to Congress. Powell said he was in no rush to adjust monetary policy and wanted to see more progress on inflation, saying the economy was in a "pretty good place." His remarks helped stabilize financial markets, helping Wall Street trim losses and the dollar recover.
Powell will continue his testimony on Wednesday, and investors are also awaiting January CPI data, which is forecast to have risen 2.9% year-on-year, with core annual growth of around 3.1%.
⭐️Technical Analysis
Gold is accepting the 2941 area as a top, and the decline has created quite clear structures. 2873-2871 is an important support zone in pushing gold prices to increase again. If gold prices cannot close the h4 candle above 2890, it will be considered a confirmation of a dow breakout and a downtrend wave that can extend to 2833. In the direction of gold going up again, 2807 and 2827 will be the zones that the SELL side will pay attention to in order to participate in the market.
EURUSD - H4, H1 forecasts, Technical Analysis & Trading IdeasIntraday forecast
The downtrend is broken, and the price is in an impulse wave.
Forecast:
1- Correction wave toward the Buy Zone
2- Another Upward Impulse wave toward Higher TPs
SL: Below 1.0331
________________________________
❤️ If you find this helpful and want more FREE forecasts in TradingView,
. . . . . Please show your support back,
. . . . . . . . Hit the 👍 BOOST button,
. . . . . . . . . . . Drop some feedback below in the comment!
🙏 Your Support is appreciated!
Let us know how you see this opportunity and forecast.
Have a successful week,
ForecastCity Support Team

Gold Price ActionHello Traders!
Let’s break this down in a simple and friendly way. If you’ve noticed, gold is dropping even though the overall market is in an uptrend. Here’s what you can do:
1. Switch to the 2-hour timeframe and use my Supply and Demand Analyzer Indicator. You’ll see that the price has reversed from a fresh demand zone, which is a good sign.
2. Now, check the 30-minute timeframe. You’ll notice liquidity at the top, along with fresh supply zones. If the price continues to follow the overall trend, there’s a high chance it could move upward.
3. Always manage your risk! Even if your win rate is around 30-40%, solid risk management can keep you ahead in this business. Remember, protecting your capital is key to long-term success.
Wishing you all the best and happy trading! Stay disciplined and trade smart. 😊

USDJPY → Fake Breakdown Gives Bulls a Chance!FX:USDJPY The price dips into support and creates a false breakdown below the lower boundary of the current trend. Meanwhile, the dollar is gaining strength, which could provide an opportunity for the currency pair to rise.
The price has paused near a strong support zone, as the fundamental backdrop has been increasingly unstable and heavily influenced by developments in the USA. Attention has shifted away from Japan's interest rate hikes, with market participants now closely monitoring economic data from the West.
From a technical perspective, the chart presents two potential triggers—one for buying and one for selling. However, given that both the global and local trends are upward, the bias leans toward buying. If the currency pair manages to sustain above the 151.9 - 151.95 level, short- to medium-term growth toward the targets marked on the chart is likely.
Resistance levels: 151.94, 153.7, 153.97
Support levels: 150.95, 149.52
That said, if the dollar's correction persists and buyers fail to capitalize on the false breakdown of support, a drop back to 150.95 could trigger a breakdown, potentially leading to a decline toward 148.64.

12.02.25 Morning ForecastPairs on Watch -
FX:GBPAUD
FX:USDJPY
A short overview of the instruments I am looking at for today, multi-timeframe analysis down to what I will be looking at for an entry. Enjoy!

[INTRADAY] #BANKNIFTY PE & CE Levels(12/02/2025)Today will be slightly gap up opening expected in banknifty. Any bullish rally only expected if banknifty starts trading and sustain above 49550 level. Further downside expected below 49450 level this downside rally can be continue upto 49050 level in today's session. If banknifty banknifty starts trading below 48950 in today's session then possible strong downside rally of 400-500+ points upto 48550 level.

#NIFTY Intraday Support and Resistance Levels - 12/02/2025Today will be slightly gap up opening expected in nifty. After opening if it's sustain above 23050 level then expected reversal upto the 23250 level. 23250 level will act a strong resistance for today's session. Possible nifty will goes further downside from this level. Important support for today's session is 23000-23050 zone. Sharp downside expected below the 23000 level.

Still in Bullish trendI see impulse wave in XAU, it's gonna up to the tip or over the highest price I guess.

XLMUSD - Weekly forecast, Technical Analysis & Trading IdeasMidterm forecast:
0.1625 is a major support, while this level is not broken, the Midterm wave will be uptrend.
Technical analysis:
A trough is formed in daily chart at 0.3030 on 02/09/2025, so more gains to resistance(s) 0.3552, 0.3875, 0.4521 and more heights is expected.
Take Profits:
0.3552
0.3875
0.4521
0.4965
0.5602
0.6080
0.6905
0.7975
__________________________________________
❤️ If you find this helpful and want more FREE forecasts in TradingView,
. . . . . Please show your support back,
. . . . . . . . Hit the 👍 BOOST button,
. . . . . . . . . . . Drop some feedback below in the comment!
🙏 Your Support is appreciated!
Let us know how you see this opportunity and forecast.
Have a successful week,
ForecastCity Support Team

11.02.25 Morning ForecastPairs on Watch -
FX:AUDUSD
FX:EURUSD
FX:GBPAUD
A short overview of the instruments I am looking at for today, multi-timeframe analysis down to what I will be looking at for an entry. Enjoy!

[INTRADAY] #BANKNIFTY PE & CE Levels(11/02/2025)Slightly gap up opening expected in banknifty near 50000 level. After opening if banknifty starts trading and sustain above 50050 level then expected upside rally upto the 50450 level in opening session. Downside movement possible if banknifty not sustain above level and starts trading below 49950. This downside can goes upto the 49550 level in today's session.
