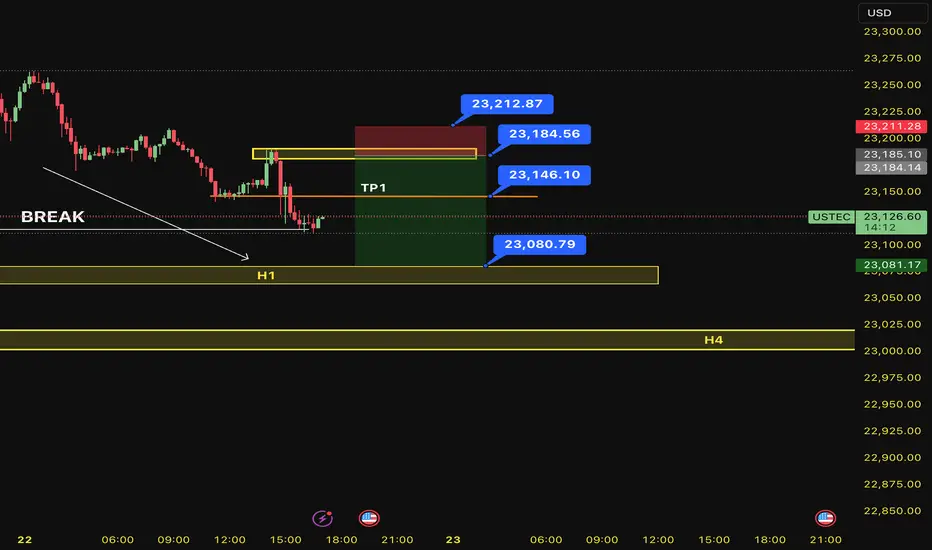
SELL USTEC 22.7.2025Confluence trade order: SELL at M15
Type of entry: Limit order
Condition:
- If the price break down THE LAST TOP confirming the down trend into H1.
Note:
- Management of money carefully at the price of bottom (23,146)
Set up entry:
- Entry sell at 23,184
- SL at 23,212
- TP1: 23,146
- TP2: 23,080
Trading Method: Price action (No indicator, only trend and candles)
Priceactionanalysis
22.07.25 Morning ForecastPairs on Watch -
FX:GBPJPY
FX:AUDUSD
OANDA:XAUUSD
FX:GBPUSD
A short overview of the instruments I am looking at for today, multi-timeframe analysis down to what I will be looking at for an entry. Enjoy!

XAUUSD Analysis : From Ellipse Demand to Reversal Zone – Target Hello traders!
Let’s decode today’s GOLD setup using the MMC (Mirror Market Concepts) strategy. This is a clean and textbook example of how institutional price delivery works – from demand creation to reversal zones. Let’s go step by step👇
🔵 Previous Ellipse Full Demand – The Accumulation Phase:
The market initially formed an Ellipse structure, which you’ve rightly marked as the Previous Full Demand Zone. This is where smart money started to accumulate long positions after pushing the market into a discounted area.
Price remained inside this ellipse zone for a while, showing slow and controlled price action with multiple rejections from the bottom. This type of price behavior is usually a trap zone, where retail traders are shaken out, and institutions silently build their positions.
💥 FMFR Zone – Where Momentum Begins:
On July 18, a clear FMFR (Fresh Money Flow Reversal) took place. This is the moment where price broke out of the ellipse demand zone with strength.
This FMFR marks the transition from accumulation to markup phase. It signals that the market makers have done their job in collecting liquidity and are now ready to drive price upward.
From this FMFR, the market respected a curved path — a classic MMC parabolic build-up, showing buyer dominance throughout.
📈 One-Time Delivery (OTD) – Clean Impulse:
Following the FMFR, price followed a One-Time Delivery (OTD) move. You’ve marked this beautifully with the vertical box showing the aggressive bullish impulse.
The candles are strong, consecutive, and with minimal pullbacks — a sign that the market is being delivered efficiently by the institutions toward their target.
🟩 Reversal Area – Target Reached:
Price has now entered the Reversal Area (Supply Zone), which was expected based on previous structure and imbalance. The market is reacting to this area already — giving signs of exhaustion.
From an MMC perspective, this is a potential “sell to buy” or “buy to sell” trap zone, where the market could either reverse completely or engineer liquidity before moving again.
⚖️ Central Zone – Balance Area:
Below the current price lies the Central Zone, which is a neutral area where the market may consolidate if it fails to hold higher or reject immediately. This area usually acts as a pause or buffer zone, often seen before the market decides the next leg (up or down).
🔄 Next Reversal Area – Demand Reload Zone:
If price drops, the Next Reversal Area marked below (around the 3,345–3,355 range) will be crucial. This is the zone where you should watch for:
Bullish rejections
FMFR signals
Trap candles (like liquidity wicks)
Expect this area to act as the next “Buy Program”, where institutions might step back in to reload longs.
🧠 Conclusion & Trader Mindset:
✅ Market respected MMC phases: Accumulation ➝ FMFR ➝ Delivery ➝ Reversal
🛑 Currently in a high-probability reaction zone – wait for confirmation before trading.
👁️ Watch how price behaves in the Reversal Area — rejection or continuation?
🔁 If market retraces, Next Reversal Area is your prime hunting zone for long setups.
🔔 Stay Patient – React, Don’t Predict.
Let the market reveal its next move. Whether it’s a pullback to reload longs or a deeper retracement, MMC logic will guide you to stay on the right side.

[INTRADAY] #BANKNIFTY PE & CE Levels(22/07/2025)Bank Nifty is expected to open gap-up today, continuing the momentum seen in yesterday’s session. The index has successfully crossed above the short-term resistance zone near 56,900, showing bullish strength. The next key breakout level is at 57,050, and once crossed decisively, we may see a sharp upward rally.
Traders can look to Buy CE option above 57,050, targeting 57,250, 57,350, and 57,450+. The structure indicates that momentum buyers may take over above this zone, with the potential for strong upside if Bank Nifty sustains above the breakout level.
On the downside, if the index slips back and breaks 56,950 decisively, then Buy PE option below 56,950 can be considered, with potential downside targets of 56,750, 56,650, and 56,550-. This zone will act as an immediate intraday support and any fall below it can lead to quick profit-booking.
Additionally, if Bank Nifty finds support near the 56,550–56,600 zone again, traders may also consider reversal CE buying with upside targets of 56,750, 56,850, and 56,950+.

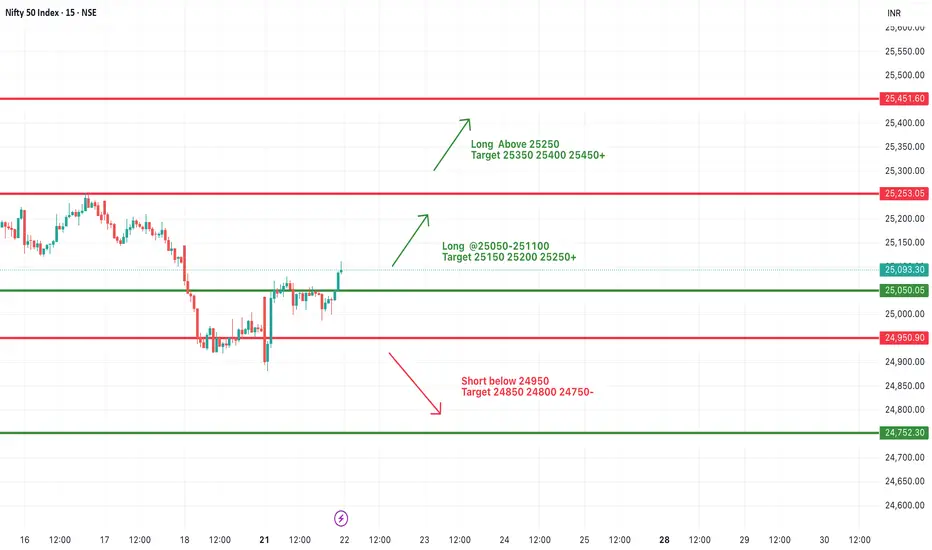
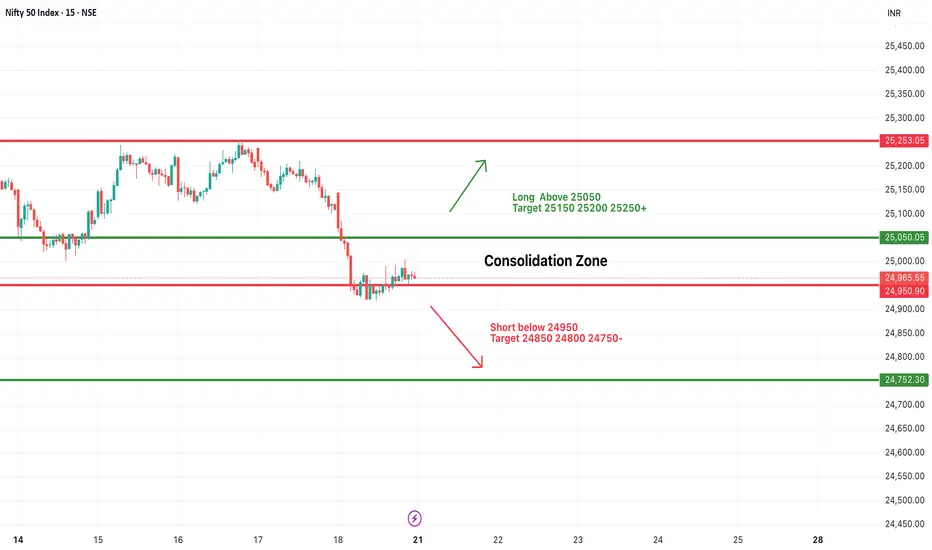
#NIFTY Intraday Support and Resistance Levels - 22/07/2025Today, Nifty is expected to open slightly gap-up, indicating positive early sentiment. After breaking out from the previous day’s consolidation zone, the index has shown strength around the 25,050 level, which will now act as an important intraday support. If this level is held during the early session, we can expect further upside continuation.
A move above the 25,050–25,100 zone can trigger upward momentum with potential targets at 25,150, 25,200, and 25,250+. Sustained strength above 25,250 will open the door for further bullish moves toward 25,350, 25,400, and 25,450+, making it a favorable long scenario for trending market conditions.
However, if the index fails to hold above the 25,050 level and starts trading back below 24,950, it may again enter a bearish territory. In such a case, downside targets of 24,850, 24,800, and 24,750- are possible, indicating weakness and reversal from resistance.
Gold (XAUUSD) – 22 July Outlook | Reversal Zones in FocusGold (XAUUSD) – 22 July Outlook | Three Key Reversal Zones to Watch
Yesterday, Gold gave a strong breakout above the key resistance level at 3377 , shifting the M15 structure bullish and confirming upside strength.
Today, the market is likely entering a retracement phase on both the H4 and M15 timeframes — a healthy pullback after a breakout, which may lead to the next leg of the uptrend.
So where should we focus for long opportunities?
We are observing three key zones as potential bases for the continuation move:
📍 Zone 1 – 3377.6–3373.5 (Breaker Block):
This is the immediate structure zone — previous resistance which may now flip into support.
→ If price respects this area, we can anticipate a classic S&R Flip setup.
📍 Zone 2 – 3367.5–3363 (Demand Block):
If the first level doesn’t hold, this zone becomes critical. It lies just under the breakout base and could act as the next level of defense by bulls.
📍 Zone 3 – 3358.5–3350.5 (H4 Order Block):
This is the most significant support zone for the day. It aligns with a higher-timeframe order block, making it a high-probability POI for a deeper pullback and reversal.
But remember, we do not predict blindly .
Plan of Action:
– Observe price behavior at each zone
– Wait for confirmation via M1 internal structure shifts + BoS
– Trade only when all conditions align
– SL: 40 pips | TP: 120 pips
Risk-Reward: Always 1:3
Summary:
✅ Structure is now bullish on M15 and H4
✅ We’re in a pullback phase — ideal for continuation trades
✅ Three clear POIs mapped — now we wait for the market to speak
Patience. Precision. Discipline.
Let the trade come to you — not the other way around.
📘 Shared by @ChartIsMirror

GBPAUD's wide trading range remains intact✏️GBPAUD is trading in a wide range. After the increase on Friday, the pair is retesting the support zone breaking past resistance. And the current reaction point also coincides with the 20 SMA. There is not much momentum for the pair to break out of the wide trading range, so buying the pair to the upper range of 2.097 is a reasonable choice at the moment.
📉 Key Levels
Support: 2.058
Resistance: 2.083-2.096
BUY Trigger: Confirmed bounce from 2.059 (EMA support)
Target 2.09600
BUY DCA Trigger: Break 2.083
Leave your comments on the idea. I am happy to read your views.

ETHUSD heading towards the top of the D1 frame✏️ CRYPTO:ETHUSD is in a strong uptrend towards the resistance zone of the 3800 daily frame. There are not many conditions for the sellers to jump in and reverse the current trend. Wait for the price reaction at the resistance of the D1 frame to consider the SELL strategy. Because currently if BUY is too Fomo.
📉 Key Levels
Sell trigger: Rejection from 3800
Target 3400, potentially 3,380
Leave your comments on the idea. I am happy to read your views.

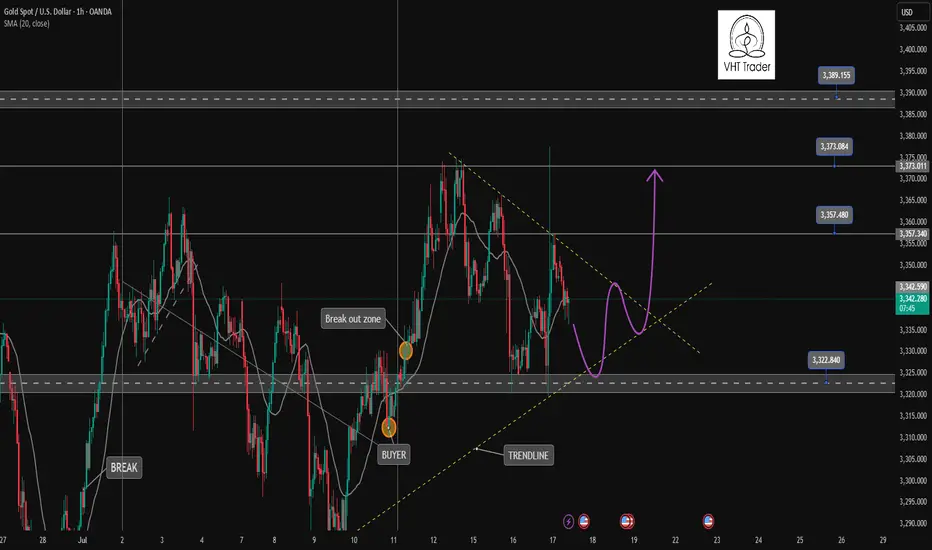
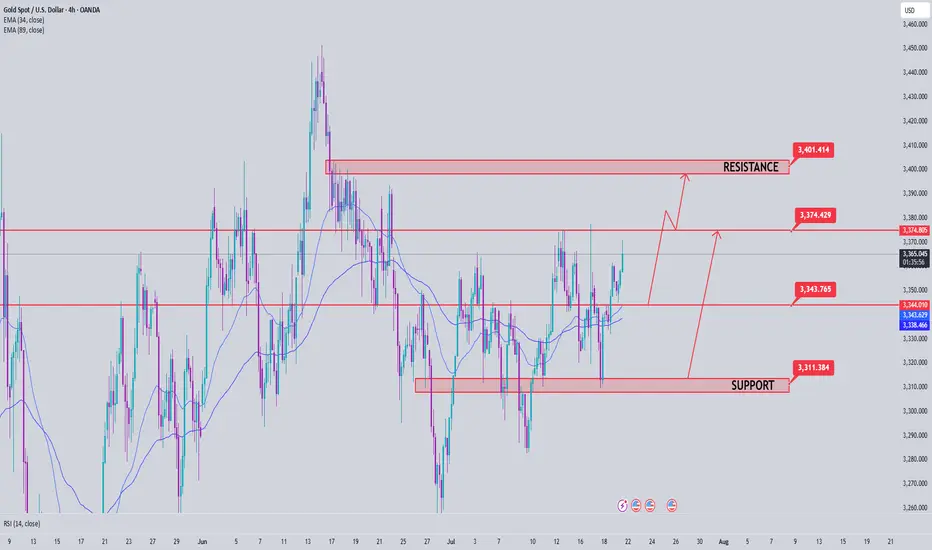
Gold returns to its original nature. Price increase towards 3400✏️ OANDA:XAUUSD is back to its inherent uptrend. Currently trading in a wide range. Shaped by CPI news last week. Trendline is still supporting Gold price towards 3400 next week. Pay attention to the important zone 3373 to DCA BUY and do not SELL when breaking this important zone 3373. Effective trading strategy is to wait for Gold to correct and buy.
📉 Key Levels
Support: 3343 - 3322
Resistance: 3373-3400
Buy Trigger: Rejects the support zone 3343 and reacts to the upside
Buy Trigger: Rebound from 3322
Target 3400
Leave your comments on the idea. I am happy to read your views.
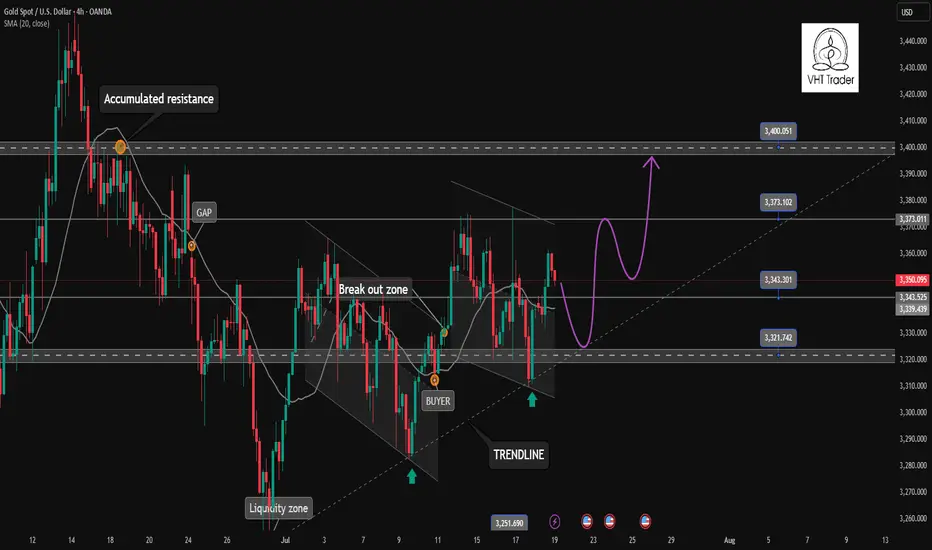
Gold Price Analysis July 21After being reinforced by CPI data last week, gold prices have regained their bullish momentum and are currently trading in a wide range. The technical structure still shows a dominant uptrend, with the trendline continuing to act as reliable support, targeting the important resistance zone of 3400 next week.
📌 Preferred trading strategy:
Watch the price reaction around the support zone of 3343. If there is a rejection signal of this zone accompanied by buying pressure, that will be the ideal entry point.
If the price continues to correct deeper, the strong support zone of 3322 will be a reasonable DCA point.
It is not recommended to SELL if the price breaks the confluence zone of 3373, as this is a signal confirming the strong bullish momentum continues.
📍 Important price zones:
Support: 3343 – 3322
Resistance: 3373 – 3400
🚀 Buy Trigger:
Price rejects 3343 zone with clear bullish signal
Strong bounce from 3322 zone
21.07.25 Morning ForecastPairs on Watch -
FX:GBPAUD
FX:EURUSD
FX:AUDUSD
OANDA:XAUUSD
A short overview of the instruments I am looking at for today, multi-timeframe analysis down to what I will be looking at for an entry. Enjoy!

#NIFTY Intraday Support and Resistance Levels - 21/07/2025Nifty is likely to start the day with a flat opening, as current price action is indicating a consolidation phase near the lower range. The zone between 24,950–25,050 is acting as a key area of indecision, where prices are stuck in a tight range, showing a lack of clear momentum. This consolidation could lead to a breakout or breakdown depending on how the index reacts at key levels.
If Nifty sustains above 25,050, it may trigger a short-term upward move, breaking the consolidation phase. In such a scenario, an upside rally towards 25,150, 25,200, and 25,250+ levels can be expected, making it a favorable long setup for intraday traders.
On the contrary, if the index slips below 24,950, the selling pressure may increase, and downside momentum can accelerate. A breakdown here could pull the index towards support levels of 24,850, 24,800, and even 24,750-, which would confirm bearish strength.
Traders are advised to avoid aggressive positions within the consolidation zone and wait for a breakout or breakdown for directional trades. Quick entries with partial profit booking at every level and strict stop-losses are recommended to manage risk efficiently in today’s range-bound environment.
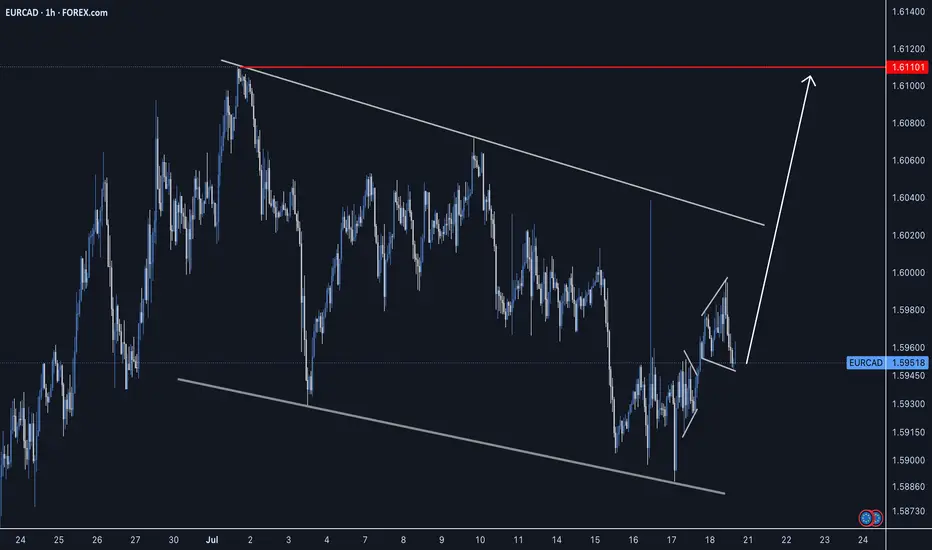
EURCAD - Long Setup - Impulse, Correction, ImpulsePrice action has been setting up for the next impulse phase as we can the bullish continuation is completing to indicate price has further growth. Looking for a long entry this upcoming week.
Good Luck
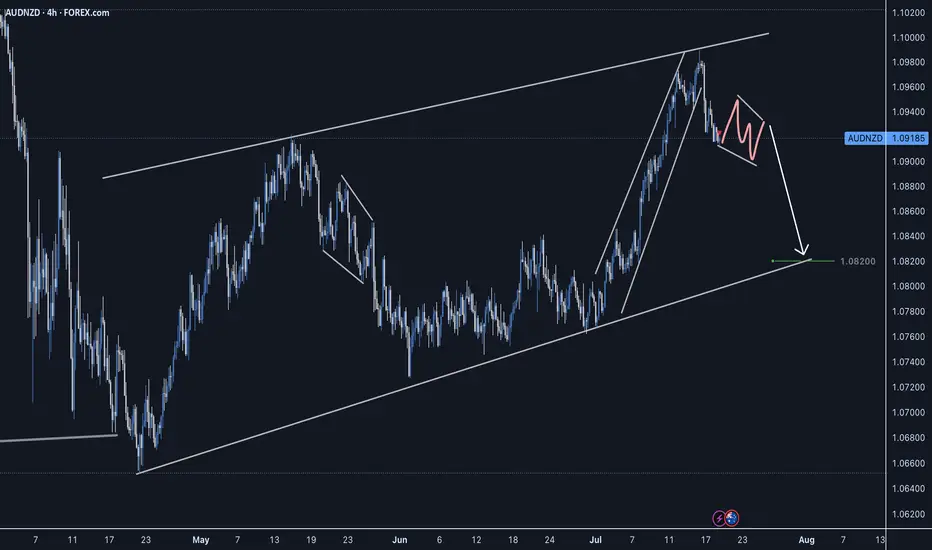
AUDNZD Short Setup - CAB EntrySellers stepping in, strong reversal impulse. Waiting for a slight correction before taking a short entry on the LTF.
Good Luck
Gold breaks trendline and returns to uptrend. BUY NOW!✏️ OANDA:XAUUSD A deep sweep to 3310 and bounce back to the trading range. Gold is reacting at the Trendline around the price zone of 3344. This is an important price zone that if broken will return to the uptrend and head towards 3373 soon. 3332 plays an important role in the current bullish wave structure, which is a suitable SL placement point for BUY signals.
📉 Key Levels
Support: 3332-3312
Resistance: 3344-3357-3373-3389
BUY trigger: Break and trading above Resistance 3344 (trendline, top uptrend wave 1)
BUY DCA trigger: Break Resistance 3353
Target 3373
Leave your comments on the idea. I am happy to read your views.

USDCAD bearish view
OANDA:USDCAD again on this pair, first analysis accurate, in new look having bearish view, price in PA moving, still we having nice structure, price is now come back in channel, looks like breaking first channel, which will take for confirmation and sign for bearish expectations.
SUP zone: 1.37400
RES zone: 1.36400, 1.36100

USDJPY Symmetrical Triangle – Be Ready for Breakout or BreakdownUSDJPY is currently squeezed inside a well-formed symmetrical triangle, indicating a breakout is imminent. This consolidation pattern is nearing its apex, and price action is getting tighter. A sharp move in either direction could unfold soon. Here's how to prepare:
🟢 Bullish Breakout Setup:
Entry Trigger: 1H candle close above 148.70
Stop Loss: Below last higher low or triangle support (~148.15)
Targets:
TG1: 149.20
TG2: 149.60
Final TG: 149.95–150.00
Bias: Favors trend continuation (previous uptrend)
🔍 Confirmation: Strong breakout candle with momentum and/or volume.
🔴 Bearish Breakdown Setup:
Entry Trigger: 1H candle close below 148.15
Stop Loss: Above triangle resistance (~148.70)
Targets:
TG1: 147.60
TG2: 147.20
Final TG: 146.80
Bias: Reversal or failed trend continuation
🔍 Confirmation: Clean breakdown with bearish candle close + possible re-test rejection.
⚠️ Avoid premature entries inside the triangle. Wait for a confirmed breakout or breakdown with candle close and rejection follow-up.
🎯 Tip: Triangle breakouts often result in fast directional moves. Plan your lot size based on volatility and stick to your risk parameters. This is a high-probability setup — trade with discipline.
=================================================================
Disclosure: I am part of Trade Nation's Influencer program and receive a monthly fee for using their TradingView charts in my analysis.
=================================================================

EURUSD & US30 Trade Recaps 18.07.25A long position taken on FX:EURUSD for a breakeven, slightly higher in risk due to the reasons explained in the breakdown. Followed by a long on OANDA:US30USD that resulted in a loss due to the volatility spike that came in from Trump.
Full explanation as to why I executed on these positions and the management plan with both.
Any questions you have just drop them below 👇

Gold Price Analysis July 18XAUUSD Analysis
Gold has just had a deep sweep to 3310 before bouncing back within the trading range. Currently, the price is reacting at the Trendline area around 3344. This is an important level - if broken, gold can return to the uptrend, with the nearest target at 3373.
🔹 Key Levels
Support: 3332 - 3312
Resistance: 3344 - 3357 - 3373 - 3389
🔹 Trading Strategy
BUY trigger: when price breaks 3344
BUY DCA: when price surpasses 3353
SL: below 3332
Target: 3373
💡 Note:
The 3332 area plays an important role in the bullish wave structure, suitable for placing Stop Loss for BUY orders.

18.07.25 Morning ForecastPairs on Watch -
FX:GBPAUD
FX:EURAUD
FX:EURNZD
FX:EURCAD
A short overview of the instruments I am looking at for today, multi-timeframe analysis down to what I will be looking at for an entry. Enjoy!

GBPUSD ANALYSIS From the previous trading day we can see that the pair has been making random up and down movements without a clear direction and even though we rejected a key support area the higher timeframes like daily and weekly still show bearish sentiment right now the best move is to wait

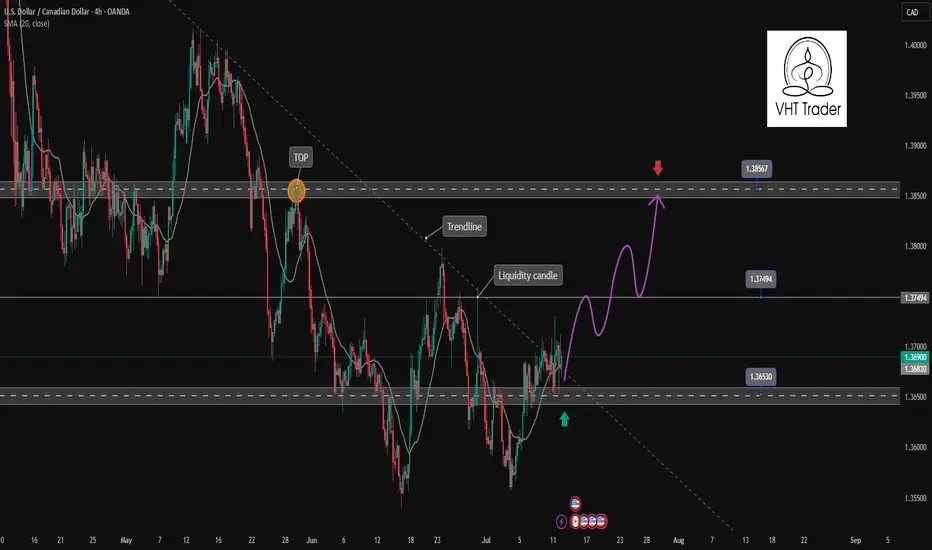
USDCAD is showing signs of bullish recovery✏️ OANDA:USDCAD has broken the Trendline structure to form a corrective uptrend. The price is still above the 20 SMA, indicating that the market's bullish momentum is still strong. The bullish wave may extend to 1.385. Pay attention to the reaction at the 1.375 liquidity candle wick zone for a positive DCA strategy.
📉 Key Levels
Support: 1.365
Resistance: 1.375-1.385
BUY Now: 1.365 (Strong support zone)
BUY Trigger: break and close above 1.375
Target: 1.385
Leave your comments on the idea. I am happy to read your views.
Gold returns to Sideway range waiting for new momentumOANDA:XAUUSD A sweep of liquidity back to the 3377 zone and then back into the triangle trading range. Currently, the market will wait for new momentum for the next trend. If the 3322 zone is still holding, the uptrend to 3400 is still there. This is an important price zone in today's trading day.
📉 Key Levels
BUY Trigger: rejection 3323 with bullrish confirmation
Target: 3373
SELL Trigger: Break and trading Bellow support 3321
Target: 3285
Leave your comments on the idea. I am happy to read your views.