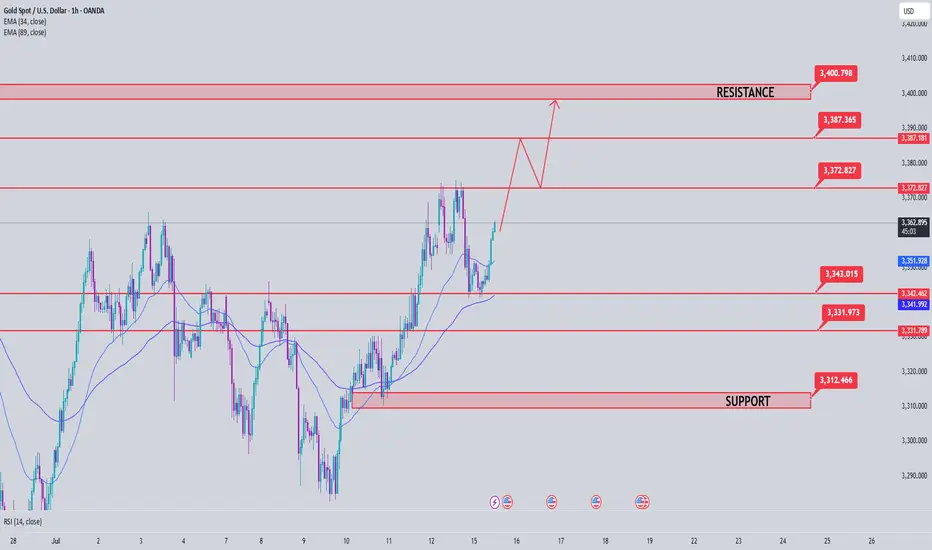
Gold returns to Sideway range waiting for new momentumOANDA:XAUUSD A sweep of liquidity back to the 3377 zone and then back into the triangle trading range. Currently, the market will wait for new momentum for the next trend. If the 3322 zone is still holding, the uptrend to 3400 is still there. This is an important price zone in today's trading day.
📉 Key Levels
BUY Trigger: rejection 3323 with bullrish confirmation
Target: 3373
SELL Trigger: Break and trading Bellow support 3321
Target: 3285
Leave your comments on the idea. I am happy to read your views.
Priceactionanalysis
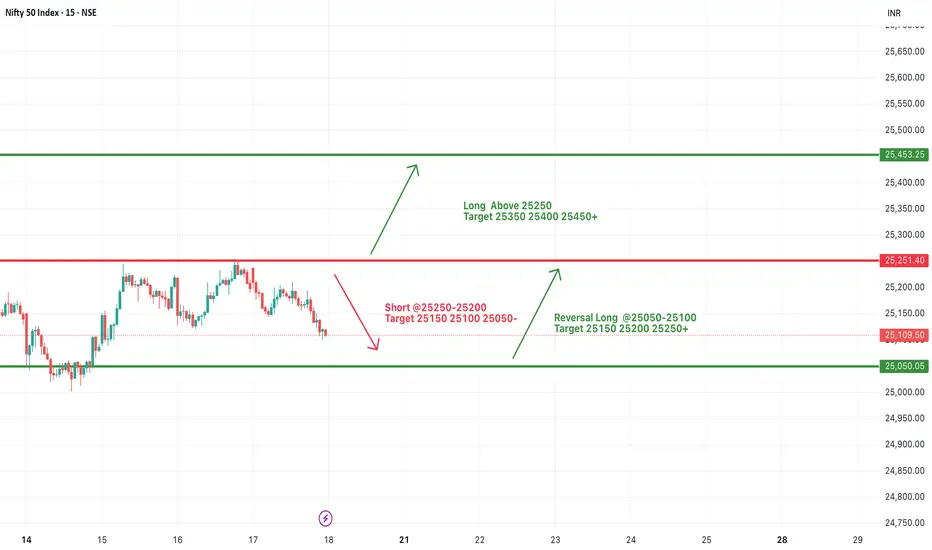
#NIFTY Intraday Support and Resistance Levels - 18/07/2025Nifty is likely to open slightly gap-up today near the 25100–25150 zone. There are no major changes from yesterday’s levels, so the same trading levels remain in focus for today’s session. If Nifty sustains above the 25250 level, we can expect an upside move toward 25350, 25400, and even 25450+ levels. This area remains a crucial resistance zone for potential bullish continuation.
On the downside, if Nifty fails to cross and sustain above 25250 and breaks below the 25200–25250 zone, we may witness a downward move with possible targets at 25150, 25100, and 25050.
A reversal long opportunity may arise in the 25050–25100 support zone if the market finds buying interest after a dip. From this level, we can expect targets around 25150, 25200, and 25250+.
The index is trading in a tight range with no fresh cues. Avoid aggressive entries and stick to level-based trades with strict stop-loss and partial profit booking.
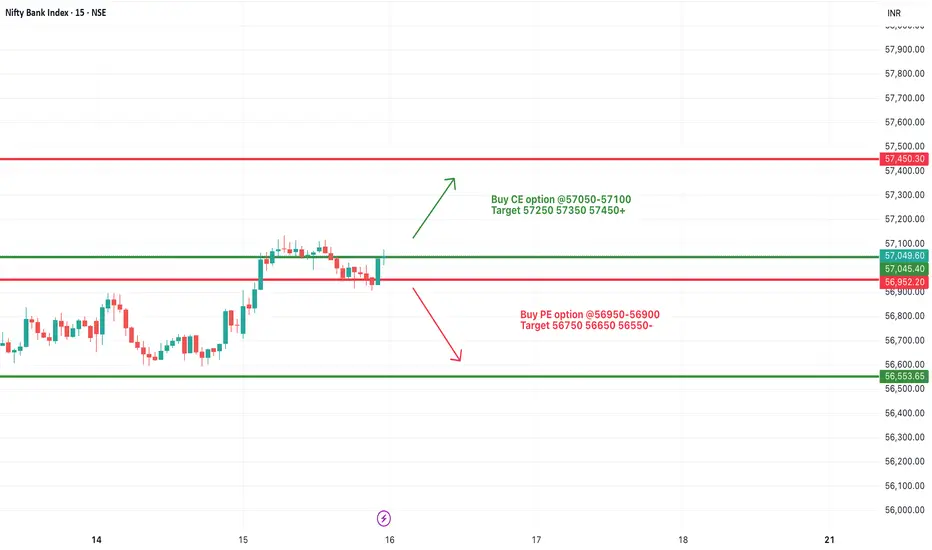
[INTRADAY] #BANKNIFTY PE & CE Levels(18/07/2025)Bank Nifty is expected to open flat around the 56800 zone, suggesting indecision in the early session. If it manages to move upward and sustain above the 57050–57100 resistance range, it could invite bullish momentum targeting 57250, 57350, and even 57450+. A breakout above this level can trigger a continuation of upward movement, but volume and price confirmation are essential.
On the downside, if the index stays weak and slips below the 56950–56900 zone, we may see fresh bearish pressure pulling it toward 56750, 56650, and 56550 support levels. This zone remains a crucial intraday pivot for traders to watch.
A reversal opportunity may also emerge if the index drops further near 56550–56600 and then shows a sharp recovery. In such a case, targets of 56750, 56850, and 56950+ are possible, making it a good support-based bounce trade. Overall, the market might remain sideways with both opportunities for quick scalps and reversals—focus on key levels and act with strict stop losses.

SOXL — Buying on a Strong Uptrend with 30%+ Profit PotentialDirexion Daily Semiconductor Bull 3x Shares (SOXL) continues to move in a clear uptrend after breaking long-term resistance. Price is consolidating above the breakout level, indicating sustained interest from major market participants.
Long positions remain valid.
Profit targets:
First target — 39.85
Second target — 60.42
The setup offers over 30 percent profit potential. The semiconductor sector continues to lead the broader market higher.
Focus on trading with the trend. Adding on pullbacks is reasonable with proper risk management in place.

17.07.25 Morning ForecastPairs on Watch -
OANDA:US30USD
CAPITALCOM:DE40
FX:GBPJPY
A short overview of the instruments I am looking at for today, multi-timeframe analysis down to what I will be looking at for an entry. Enjoy!

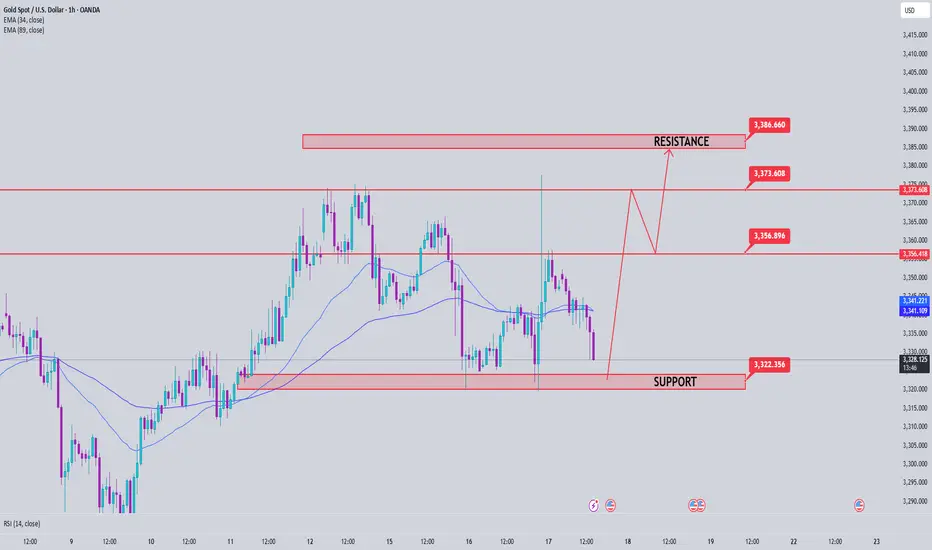
Gold Price Analysis July 17XAUUSD Analysis Today
The price has cleared the liquidity to the 3377 zone, then returned to trading within the triangle. The market is currently waiting for new momentum to determine the next trend.
✅ BUY Scenario
If the 3322-3323 zone continues to hold and there is a bearish rejection signal and confirmation of buying power, gold is expected to continue its uptrend towards the 3373 - 3400 zone.
❌ SELL Scenario
If the price breaks the 3321 support with clear selling pressure, it can extend the decline to 3285.
🔑 Key Level Today
Support: 3321 - 3323
Resistance: 3373 - 3400
💡 Strategy:
Watch the price reaction at the important support zone to decide the next action.
SBIN , 1W , Bullish As the Pattern is Formed and given Breakout , enter after strong candle close in weekly Timeframe and put SL below Swing low . follow proper risk management
follow for more swing ideas like this

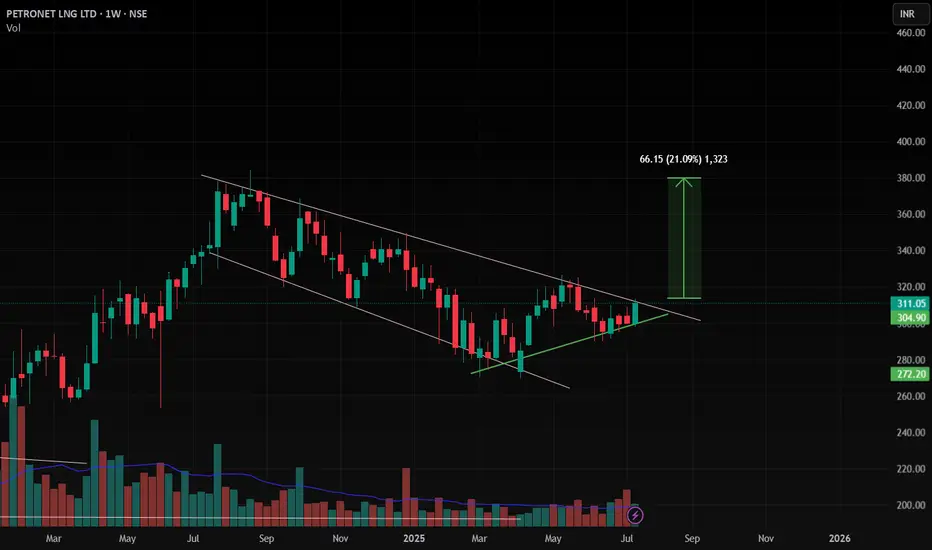
Petronet , 1W , BullishAs the Pattern is Formed and Ready for Breakout , enter after strong candle close in weekly Timeframe and put SL below Swing low . follow proper risk management
follow for more swing ideas like this
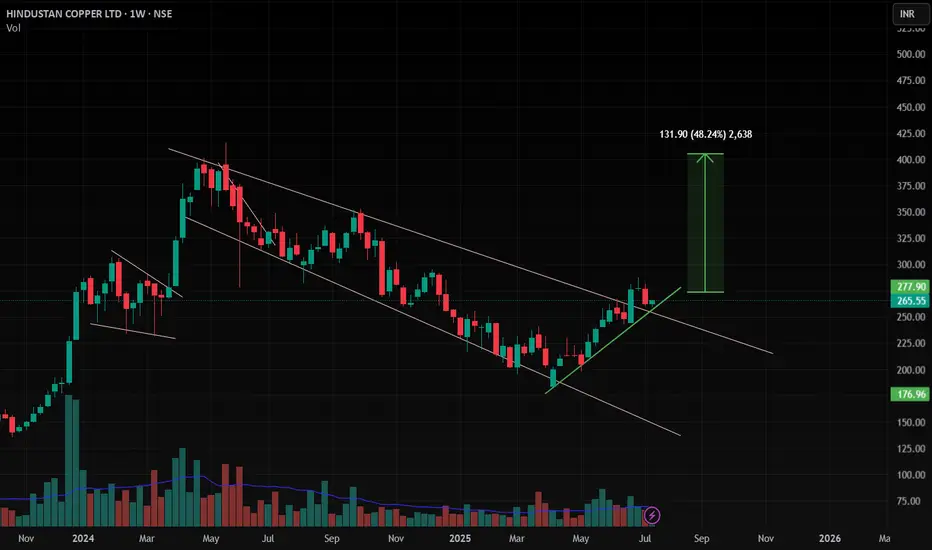
HINDCOPPER , 1W , Bullishthe Pattern is already broken out and now it is at Retest point wait patiently for strong close in weekly . then enter with proper risk management , keep SL below its Swing Low
Follow for more Swing ideas like this
[INTRADAY] #BANKNIFTY PE & CE Levels(17/07/2025)Bank Nifty is expected to open slightly gap-up near the 57100 zone. This level is a key intraday pivot. If the index sustains above 57100, it could trigger upward momentum toward the next resistance levels at 57250, 57350, and potentially 57450+. A move beyond 57550 will likely strengthen the bullish sentiment and may stretch the rally further toward 57750, 57850, and 57950+.
On the downside, if Bank Nifty fails to hold 57050–57100 and slips below 56950–56900, it may invite selling pressure, with potential downside targets at 56750, 56650, and 56550. This zone acts as short-term support, and failure to hold here could lead to further weakness.
Overall, Bank Nifty is currently in a range with bullish bias above 57100.

BUY ETHUSDT 16.7.2025Confluence order: BUY at M15
Type of order: Limit order
Reason:
- M15~FIBO 0,5-0,618 (same position)
Note:
- Management of money carefully at the price of sub key M15 (3152)
Set up entry:
- Entry buy at 3137
- SL at 3127
- TP1: 3152
- TP2: 3164
Trading Method: Price action (No indicator, only trend and candles)

16.07.25 Morning ForecastPairs on Watch -
FX:GBPJPY
FX:GBPNZD
FX:USDJPY
A short overview of the instruments I am looking at for today, multi-timeframe analysis down to what I will be looking at for an entry. Enjoy!

BUY XAUUSD 16.7.2025Trend Resumption at H1: BUY at M15
Type of order: Limit order
Reason:
- The price brokeout the sub key of M15, confirming the uptrend into main key M15.
Note:
- Management of money carefully at the price of sub key M15 (3335)
Set up entry:
- Entry buy at 3325
- SL at 3319
- TP1: 3335
- TP2: 3347
Trading Method: Price action (No indicator, only trend and candles)

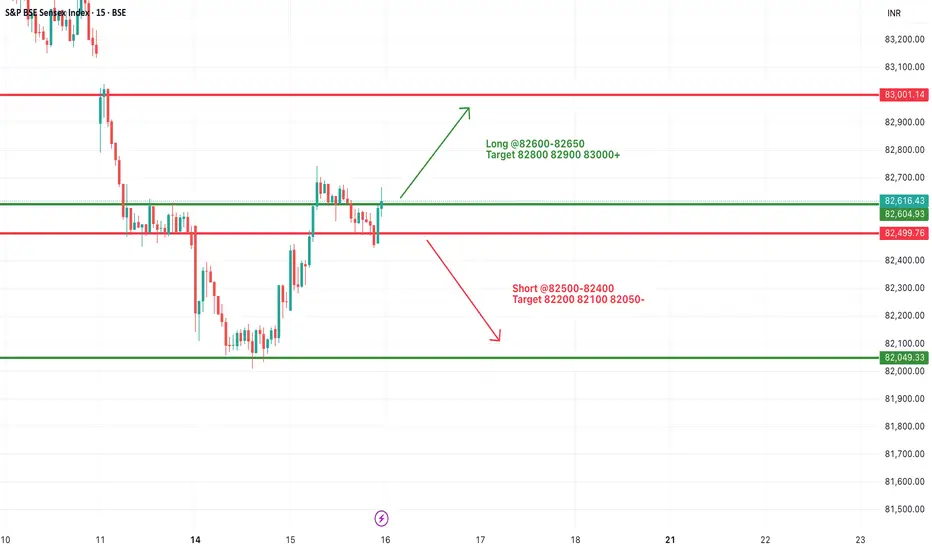
#SENSEX Intraday Support and Resistance Levels - 16/07/2025Sensex is expected to open flat near the crucial 82600–82650 resistance zone, which has acted as a turning point multiple times recently. A sustained move above this range may trigger bullish momentum toward 82800, 82900, and even 83000+. This move would indicate a positive continuation after the recovery seen from recent lows.
However, if the index faces rejection around 82600–82650, it may once again slip below 82500, opening the door for short-side opportunities with targets at 82200, 82100, and 82050. This region has seen a lot of price action over the last few sessions, so volatility may be higher.
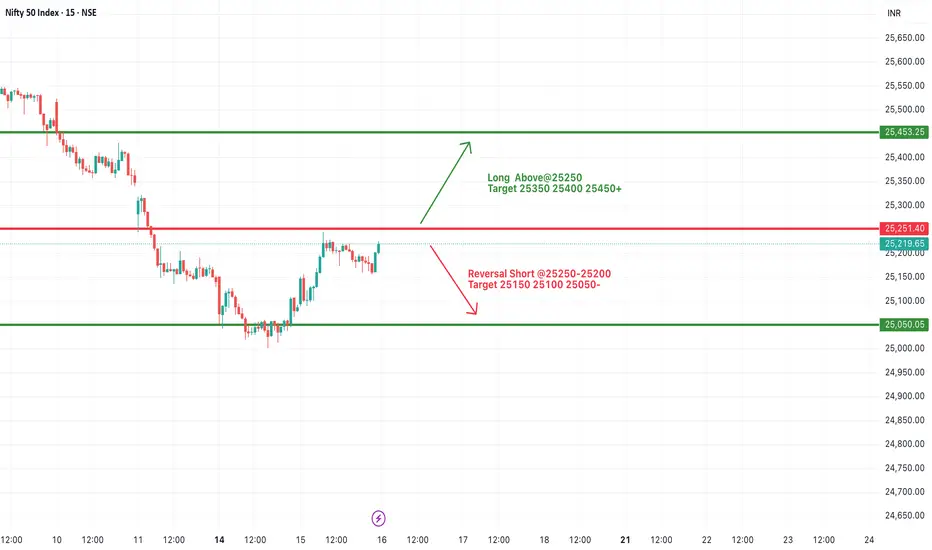
#NIFTY Intraday Support and Resistance Levels - 16/07/2025Nifty is likely to open flat near the 25200 mark, with the index currently hovering just below a key resistance zone of 25250. A decisive breakout above 25250 may provide momentum for a further upside rally toward 25350, 25400, and possibly 25450+. This level has acted as resistance in the past, so sustaining above it will be crucial for any bullish continuation.
On the flip side, 25250–25200 is also a potential reversal zone. If Nifty fails to break and sustain above it, then sellers may take control, and the index could see a pullback toward the immediate support levels of 25150, 25100, and 25050.
Since the index is near a crucial breakout/rejection point, early session price action will determine the direction.
[INTRADAY] #BANKNIFTY PE & CE Levels(16/07/2025)Bank Nifty is expected to begin the day on a flat note near the 57000 mark, indicating indecisiveness after the previous session's recovery. The immediate resistance zone lies between 57050 and 57100. A sustained move above this level can trigger an upward continuation toward the targets of 57250, 57350, and possibly 57450+. This zone will be key for bullish momentum, and traders can look for strength confirmation around this breakout.
On the downside, the 56950–56900 level is crucial. If Bank Nifty slips below this zone, it may invite fresh selling pressure, with intraday downside targets around 56750, 56650, and 56550. The support at 56550 and below can act as demand zones for any pullback.
GBPAUD Weekly Trade Setup–Parallel Channel Breakdown Opportunity1. Overview of GBPAUD Technical Setup
As of 15th July 2025, the GBPAUD 4-hour chart reflects a price currently positioned at a critical support level around 2.0470–2.0480, which has held multiple times since early April. The price action leading to this point has formed a classic descending parallel channel, with price making lower highs and testing horizontal support with increased frequency.
Key observations:
Price is well below the 200 EMA (currently around 2.0794), confirming a bearish long-term bias.
The resistance zone at 2.1070–2.1120 has proven strong over time, pushing back multiple rallies.
Price is compressing — getting squeezed into the lower boundary of the channel with shorter pullbacks, often a precursor to breakout.
The setup is aligning for a high-probability short trade, with a potential move toward the next major demand zone around 2.0100.
The Breakdown Thesis – What We See on the Chart
The current structure of GBPAUD tells a very clear story:
After a rally in early April, price has been trading within a consolidation range, failing to make higher highs.
The support around 2.0470 has now been tested repeatedly with lower bounces each time.
Price recently made a lower high and returned to support with momentum, increasing the probability of a breakdown.
We are expecting a bearish breakout of this support level, followed by a re-test of the broken zone, and then a strong downside continuation.
Risk Management Strategy
Every trade setup — no matter how technically perfect — must begin with a strong risk management plan.
For this GBPAUD setup:
Entry Trigger: Breakdown below 2.0470 and successful re-test rejection with bearish candle confirmation
Stop Loss: Above re-test high; ideally, just above 2.0530 (~66 pips risk)
Target 1: 2.0300 (170+ pips)
Target 2: 2.0200
Target 3 / Final: 2.0100 (potential 370+ pip move)
This gives us an excellent Risk:Reward ratio of ~1:5 or more, allowing traders to be wrong several times and still remain profitable over time.
Opportunities in the market don’t come from guessing — they come from waiting. The GBPAUD parallel channel setup is a brilliant example of structure-based trading that combines logic with discipline. Whether you're a full-time FX trader or a part-time swing participant, setups like these are where consistency is built.
Watch the breakdown. Wait for the re-test. Execute only when the market confirms your plan.
Happy Trading!
=================================================================
Disclosure: I am part of Trade Nation's Influencer program and receive a monthly fee for using their TradingView charts in my analysis.
=================================================================

15.07.25 Morning ForecastPairs on Watch -
FX:EURUSD
CAPITALCOM:DE40
FX:EURGBP
FX:GBPJPY
A short overview of the instruments I am looking at for today, multi-timeframe analysis down to what I will be looking at for an entry. Enjoy!

Gold – M15 Downtrend in Play | July 15 Analysis🔻 Gold (XAUUSD) – July 15 Analysis | Bearish Bias Until Proven Otherwise
The market has entered a pullback phase on H4, and we’re expecting a potential retest of the 3320 Order Block before any continuation of the broader uptrend resumes.
🔍 M15 Market Structure:
✅ ChoCH followed by BoS confirms a downtrend on M15
🎯 Current short-term objective: Retest of H4 OB (3320)
📍 Price Action Context:
Price is now revisiting the same M15 POI where yesterday’s short setup originated.
Last session, this POI was respected, but instead of creating a new Lower Low, price is trading inside the same zone again.
This signals indecision — so we let price reveal its intent
🧭 Trade Planning Scenarios:
Scenario 1 – Bearish Continuation:
→ If the POI is respected again with clear M1 confirmation ( Micro-ChoCH + BoS ), we will plan for a short setup toward 3320
Scenario 2 – POI Breaks:
→ If price breaks above this POI zone, the next key level to observe is the 3355–3359 supply zone
→ We’ll reassess from there based on new confirmation
📌 Bias for Today:
🔻 Bearish bias remains intact as long as M15 structure does not shift back to bullish.
All setups must align with structure — we are short-biased only until the market proves otherwise
📖 Structure before emotion. Let the market invite you — not the other way around.
📘 Shared by @ChartIsMirror

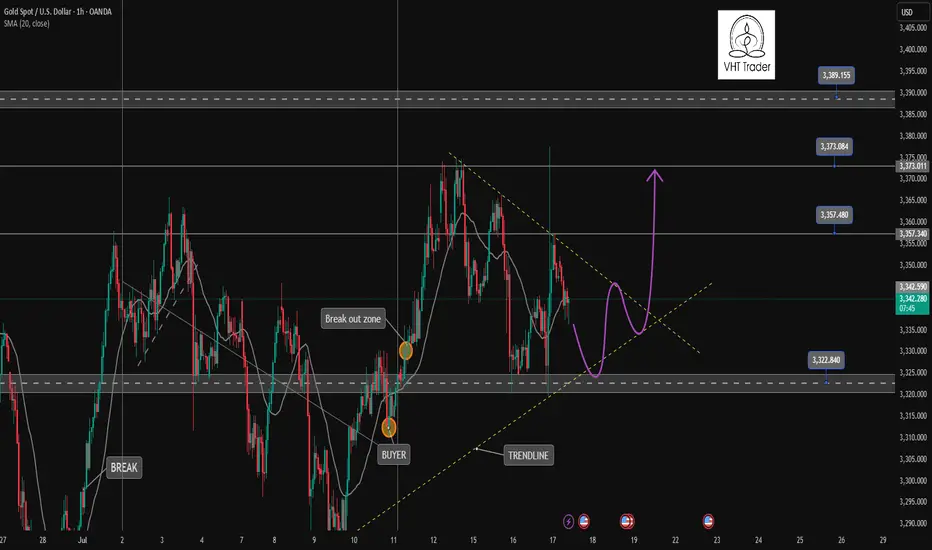
Gold Price Analysis July 15Continued uptrend after touching the 3345 buy zone
As analyzed at the beginning of the week, gold price has touched the buy zone around 3345 and continues to maintain the bullish wave structure, heading towards the 3400 resistance zone.
Currently, if gold breaks the 3373 mark, the uptrend is likely to be further strengthened. At that time, it is not advisable to trade against the trend, especially when the buyers completely control the market.
However, in case gold falls below the 3343 support zone (the resistance level in yesterday's US session), the current uptrend may be temporarily interrupted. At that time, the market will need to form a new momentum to establish the next trend.
🔑 Important price zones:
Support: 3343 – 3330 – 3313
Resistance: 3373 – 3387 – 3400
📌 Trading strategy:
Hold BUY order at 3345, expected target 3400
Activate SELL order if there is a clear price rejection signal at 3373 or 3387 (with confirmation of selling pressure)
SELL at 3400 if the strong resistance zone reacts clearly
PFC– At Resistance with Ascending Triangle PatternPower Finance Corporation (NSE: PFC) is forming a technically clean structure — trading within a rising trend channel and now testing a critical resistance zone around ₹430–₹440.
This is a make-or-break level, and the market could tip in either direction depending on how price reacts this week.
1. Chart Structure Overview
Support Zone: Defined by a rising green trendline connecting higher lows since March 2025.
Resistance Zone: Red band between ₹430–₹440, where price has previously reversed multiple times.
200 EMA (Blue Line): Currently hovering around ₹423, adding confluence as a dynamic support/resistance level.
This convergence makes the current price zone crucial for directional confirmation.
2. Two Trade Scenarios
Scenario 1: Bullish Breakout (Trend Continuation)
If the price breaks above ₹440 with strong bullish candles, traders can look for:
✅ Entry after a confirmed breakout + re-test of the ₹430–₹435 zone
🎯 Target Zones: ₹455, ₹470+
🛡️ Stop Loss: Below the swing low of the re-test (₹425 or as per price structure)
🔁 Risk/Reward: 1:2 or better
Scenario 2: Resistance Rejection (Short-Term Pullback)
If the price fails to break above ₹430–₹440 and shows reversal patterns:
✅ Entry on confirmation (e.g., bearish engulfing, rejection wick)
🎯 Target Zones: ₹410 (near rising trendline), possible extension to ₹400
🛡️ Stop Loss: Just above the resistance (~₹442–₹445)
🔁 Risk/Reward: 1:2 to 1:3 depending on entry
Thread>

#SENSEX Intraday Support and Resistance Levels - 15/07/2025Sensex is likely to kick off the session with a gap-up opening around the 82500 level, reflecting early bullish momentum. If this initial strength holds and the index begins to build above the 82600–82650 zone, it could signal the start of a recovery leg toward higher resistance levels at 82800, 82900, and potentially 83000+. Sustained action above 82650 may encourage momentum traders to chase strength during the day.
However, the 82500–82650 range will act as a battleground. Failure to defend this zone could invite selling pressure. A breakdown below 82500 may expose the index to intraday weakness, opening downside targets at 82200, 82100, and even 82050. In this case, expect volatility to increase near support levels.
Traders should approach with a flexible strategy—watching for breakout confirmation above 82650 or signs of reversal pressure below 82500. Today’s early range could set the tone for the entire session.

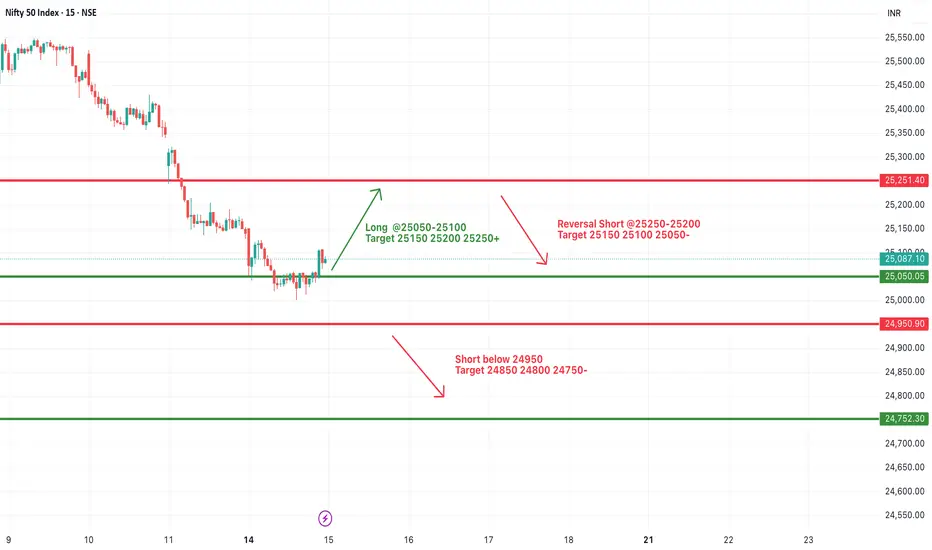
#NIFTY Intraday Support and Resistance Levels - 15/07/2025Nifty is expected to open with a gap-up today near the 25050–25100 zone. If the index sustains above this level after the opening, bullish momentum could follow with potential upside targets of 25150, 25200, and 25250+. This zone will act as the key intraday support-turned-demand area.
However, if Nifty struggles to hold above 25200–25250 and shows signs of reversal from this zone, we might witness selling pressure. A rejection from this region could lead to a pullback toward 25150, 25100, and 25050 levels.
On the downside, a breakdown below 24950 will signal further weakness. If that level is breached decisively, it can lead to sharp downside movements toward 24850, 24800, and even 24750. This would indicate a reversal of early bullish sentiment.
Today’s session could remain volatile around key levels. It’s advisable to watch price action around the 25050–25250 range for intraday confirmation before taking directional trades.