EURAUD – Bearish Flag Breakdown OpportunityThe EURAUD pair is showing signs of trend continuation via a classic bearish flag pattern formation. After a sharp decline, the market has entered into a tight consolidation channel, climbing steadily inside a sloped flag structure. Price is now testing a critical resistance area near 1.7830–1.7840 while hovering just below the 200 EMA.
This setup offers a high-probability sell opportunity — but only after confirmation.
1. Structure Overview
The initial sharp downtrend is followed by a consolidation channel — a textbook bearish flag.
Price is approaching major resistance (1.7830–1.7840) and 200 EMA, acting as a ceiling.
A breakdown from the rising support of the flag is expected to trigger a continuation toward the downside.
2. Trade Plan – Bearish Flag Breakdown
✅ Entry Plan:
Wait for a breakdown of the green support trendline (flag support).
Then, wait for a re-test of the broken support (now resistance).
Enter short only after a bearish candlestick confirmation (e.g., bearish engulfing or rejection wick) on the 15-min or 1-hour chart.
🛡️ Stop Loss:
Place the stop loss just above the major resistance zone, around 1.7835–1.7840.
🎯 Target Zones:
Target 1 (TG1): 1.7755
Target 2 (TG2): 1.7718
Final Target: 1.7632
Risk/Reward Ratio: 1:2, 1:4, 1:9.4+
3. Why This Trade Makes Sense
Bearish Flag is a reliable continuation pattern in strong downtrends.
Price is failing to break above key resistance and 200 EMA.
The flag offers a tight SL and large downside potential — ideal conditions for R:R setups.
Confluence of structure, pattern, and trend all align for short bias.
4. Trade Management Tips
Scale out partial profits at TG1 and TG2, and trail stop for final target.
If breakdown fails, avoid chasing price — re-evaluate bias if price breaks above 1.7840.
5. Final Thoughts
This EURAUD chart is a textbook case of pattern + price action + resistance confluence. The flag structure is well-defined, and the reward-to-risk ratio is significantly favorable if the breakdown confirms.
📌 Watch for:
Breakdown of rising support
Retest and bearish candle
Entry only on confirmation
High-probability setups don’t require prediction — they require preparation.
=================================================================
Disclosure: I am part of Trade Nation's Influencer program and receive a monthly fee for using their TradingView charts in my analysis.
=================================================================
Priceactionanalysis

GAIL at Best Support zone !! There are two chart of Gail on Daily timeframe.
On the first chart Gail is moving in well defined parallel channel with support near at 178-180 zone.
Daily RSI is also taking support and bouncing back, indicating a revival in short-term momentum and strengthening the overall bullish setup.
On the second chart , the stock is bouncing from the supertrend support around ₹180, reinforcing bullish sentiment. However, on the shorter timeframe, the supertrend indicator is acting as resistance near ₹192, which needs to be breached for further upside continuation.
Thank You !!

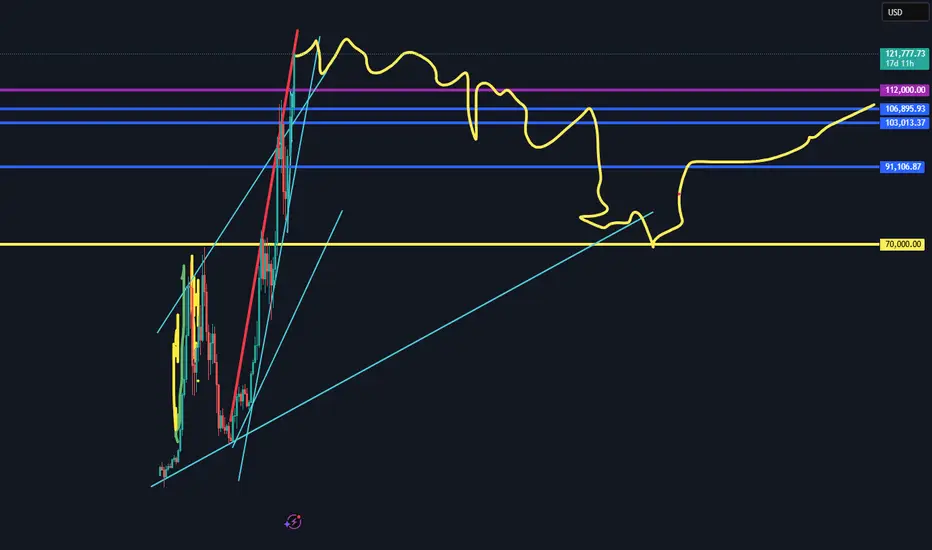
BTC TOP AND BEARISH AND CONTUNITY PREDICTION This chart is purely based on technical analysis. The RSI is still not oversold on the monthly chart, which means there might be a little more upside to this. But from the trendline, a serious reversal appears due. I could be wrong, but we'll all see. Profit taking may commence bit by bit.
Gold breaks trendline towards 3390, Uptrend resumes✏️ OANDA:XAUUSD The price increase will continue today and will be even stronger. After breaking the trendline, gold has strong support. SELL strategies are only considered to find short-term reaction points waiting for the next trends.
Gold has confirmed the uptrend is back, heading to 3390 today.
📉 Key Levels
Support 3330-3314
Resistance 3345-3362-3388
Sell trigger: rejection from 3345 with bearish confirmation
Sell zone: 3362–3387 (Strong resistance)
BUY trigger: 3330-3314 support with bounce confirmation
Leave your comments on the idea. I am happy to read your views.

SELL BTC 13.7.2025 (scalping M15)Counter-trend trade order: SELL at THE TOP
Type of entry: Limit order
Condition:
- If the price break down at 122,041 confirming the down trend.
Note:
- Management of money carefully at the price of bottom (122,041)
Set up entry:
- Entry sell at 122,821
- SL at 123,334
- TP1: 123,041
- TP2: 121,389
Trading Method: Price action (No indicator, only trend and candles)

Gold Weekly Analysis | Will $3,360 Break or Hold? [July 14–18]In this video, I break down the recent gold price action and what to expect in the coming week. We’ll review how gold responded to last week’s FOMC minutes, why $3,360 remains a key decision zone, and what upcoming U.S. economic data (CPI, PPI, Retail Sales) could mean for price movement.
👉 If you find this content valuable, don’t forget to Vote, Comment, and Subscribe for weekly market breakdowns.
Disclaimer:
Based on experience and what I see on the charts, this is my take. It’s not financial advice—always do your research and consult a licensed advisor before trading.
#GoldAnalysis, #XAUUSD, #ForexTrading, #GoldForecast, #MarketOutlook, #TechnicalAnalysis, #FundamentalAnalysis, #GoldPrice, #FOMC, #CPIData, #PPIdata, #DollarIndex, #TradingStrategy, #WeeklyOutlook, #GoldTechnicalAnalysis, #TradeSmart, #Darcsherry

14.07.25 Morning ForecastPairs on Watch -
FX:NZDCAD
FX:USDJPY
FX:EURUSD
OANDA:US30USD
A short overview of the instruments I am looking at for today, multi-timeframe analysis down to what I will be looking at for an entry. Enjoy!

ACC Trade Setup for the Week(14–18 July 2025) – Uptrend ChannelACC Ltd. (NSE: ACC) has been trading inside a clean uptrend channel for the past few weeks, bouncing consistently between rising support and resistance. Now, it approaches a critical inflection point — the lower support of the channel.
While no breakdown has occurred yet, the structure is weakening, and a bearish opportunity may soon present itself. Let’s explore how to trade this if the setup confirms.
1. What’s Happening on the Chart?
ACC is trading close to the channel support zone (~₹1975).
The resistance zone near ₹2000–₹2020 has held strong.
A potential breakdown below the rising green support trendline could trigger a bearish move toward the ₹1910–₹1920 demand zone.
But nothing is confirmed yet — this is a watchlist setup.
2. Trade Setup – Conditional Bearish Opportunity
✅ Trade Plan:
Wait for breakdown of the rising support line.
After breakdown, wait for a re-test of the broken support zone (~₹1975–₹1980).
Look for bearish confirmation via a candlestick pattern (engulfing or strong rejection) on the 15-min or 1-hour timeframe.
🚨 Entry Trigger:
Only enter short if re-test holds and price starts reversing.
📉 Stop Loss:
SL should be above the re-test high (around ₹1990–₹1995).
🎯 Target:
Profit booking zone: ₹1910–₹1920.
Potential R:R: 1:2, 1:3, or even 1:4 depending on entry.
3. Why This Setup Matters
Trend exhaustion is visible near the upper resistance of the channel.
A clean breakdown + re-test gives a low-risk entry.
The 200 EMA lies near the target zone, providing confluence for mean reversion.
4. What If There’s No Breakdown?
If price respects the support and bounces again, no trade should be taken on the short side.
In that case, look for possible bullish reversal signals back toward channel resistance — or stay neutral.
5. Final Thoughts
This is a highly conditional setup — and patience is the key. Don’t jump the gun. The best trades happen after confirmation.
🔔 What to watch this week:
Breakdown below ₹1975 support
Re-test and rejection from ₹1975–₹1985
Confirmation candle (bearish engulfing)
Only then consider a short trade toward ₹1910 with a well-placed SL.
Plan your trade. Wait for structure. Trade only when the market shows its hand.

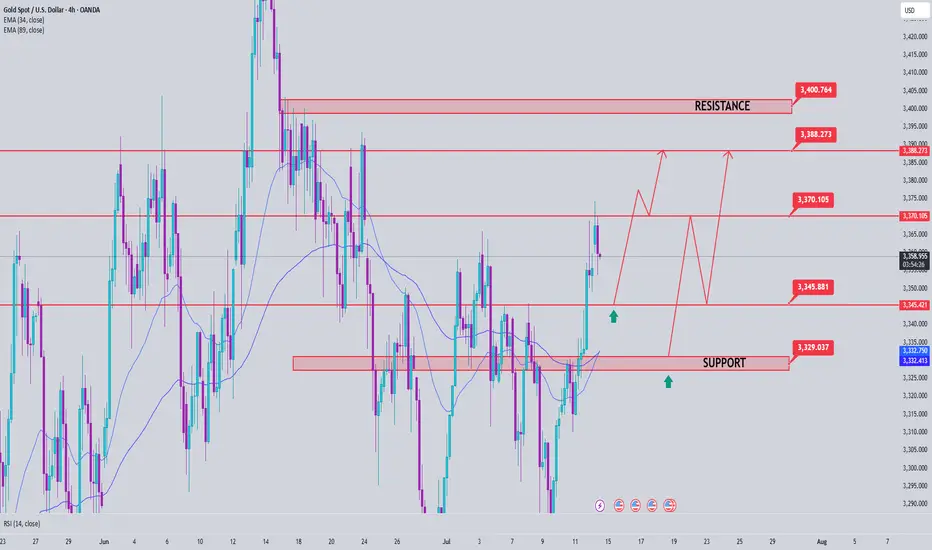
Gold Price Analysis July 14Gold confirmed a break above the key 3330 level on Friday, opening a clear uptrend. The reaction at the 3368 GAP zone further strengthens the current bullish momentum. With the current market structure, the bias is leaning towards buying on corrections around support zones.
🔍 Technical levels to watch:
Support: 3345 – 3331 (potential buying zone)
Resistance: 3387 – 3400 (bullish target)
📌 Trading strategy:
BUY Trigger 1: Price tests and rejects the 3345 support zone
BUY Trigger 2: Buy around 3331 – strong support zone
🎯 Target: 3400
The current trend favors a buying strategy on reasonable price correction conditions. It is necessary to monitor price action around support zones to confirm effective entry points.
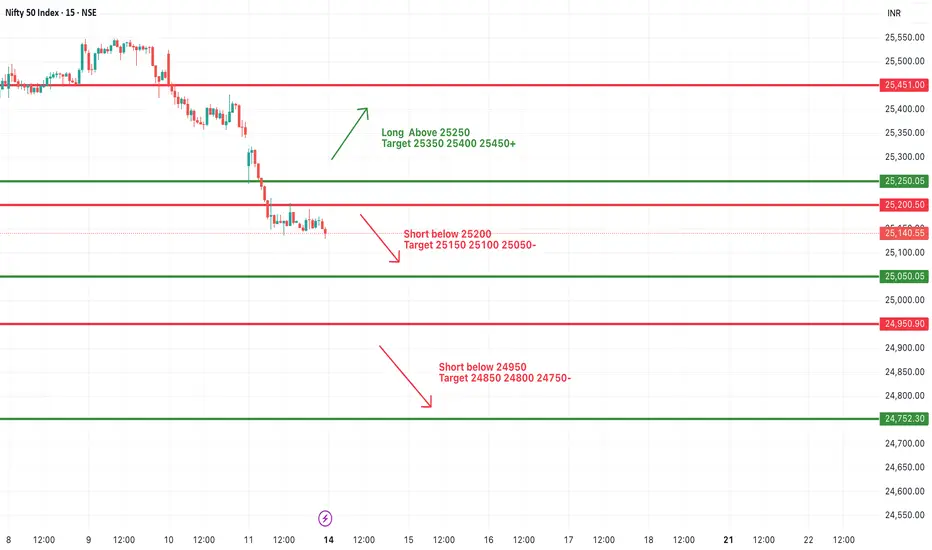
#NIFTY Intraday Support and Resistance Levels - 14/07/2025Nifty is expected to open slightly gap-down after consistent bearish momentum in the previous sessions. The index is hovering near 25140, and immediate support lies around the 25200 level. A breakdown below this level could lead to further downside pressure, with key support targets at 25150, 25100, and 25050.
If the index breaks and sustains below 24950, it may trigger a deeper correction toward the next support levels at 24850, 24800, and 24750. These zones should be watched closely for potential reversals or continuation of bearish momentum.
On the upside, any recovery and sustained move above the 25250 level may lead to a pullback rally. In that scenario, immediate resistance levels to watch would be 25350, 25400, and 25450+.
Intraday structure remains weak unless Nifty reclaims the 25250+ zone with strength. Price action near the 25200–25050 support range will be crucial in deciding the direction of the day.
[INTRADAY] #BANKNIFTY PE & CE Levels(14/07/2025)Bank Nifty is expected to open slightly gap-down, continuing the weakness observed in the previous sessions. The index is currently trading around the 56700 level after facing consistent resistance near the 57100 zone. If the index sustains below the 56950–56900 region, it may extend the downside toward 56750, 56650, and further down to 56550.
A break below 56650 could trigger a sharper fall, with the next key support levels placed at 56250, 56150, and 56050. These zones will be critical to watch for potential reversal or further breakdown.
On the upside, any strength and breakout above the 57050–57100 resistance zone may open the path toward higher levels like 57250, 57350, and 57450+. However, unless this zone is breached with strength, upward movement is likely to remain capped.
The overall structure indicates bearish pressure, and the price action near 56900–56650 will decide the intraday trend. Traders should remain cautious and react based on levels with proper risk management.

BTC's increasing fomo force will push the price up furtherCRYPTO:BTCUSD just broke the important resistance zone and trendline around 110000. This price increase to create a new ATH will create a large amount of FOMO in the market pushing BTCUSD to increase more than half. 116,000 FIbonacci extension points are considered the immediate Target for the uptrend.
Waiting for retests to the support zone for the trend-following BUY strategy.
Support: 110000-107500
Resistance: 116000
Buy zone: 110000 ( support + trendline)
Buy Trigger: break above 112000
Leave your comments on the idea. I am happy to read your views.

LTTS Weekly Trade Setup(14th-18th July 2025) – Parallel ChannelThis week, L&T Technology Services (LTTS) is showing a potential breakout opportunity that requires patience and precision. As the stock approaches a key resistance zone near ₹4445, traders should resist the urge to jump in early and instead wait for a breakout and confirmed re-test before entering any long positions.
Let’s break this down.
1. Why the Breakout is Important
- LTTS has been consolidating within a parallel channel between ₹4280 (support) and ₹4445 (resistance). Breakouts from such structures often trigger significant moves — but only when confirmed.
- A false breakout can trap early traders. Hence, waiting for the price to break above ₹4445 and then re-test this level is critical.
2. The Strategy – Wait and React
📌 Step 1: Watch for Breakout
Monitor price action as it approaches and breaches the ₹4445 resistance.
Look for strong bullish candles with volume to validate the breakout.
📌 Step 2: Wait for Re-test
After breakout, price may pull back to test the previous resistance.
This re-test acts as a confirmation that bulls are defending the breakout.
📌 Step 3: Look for Confirmation
Enter only when you see a bullish candlestick pattern (like a bullish engulfing or hammer) near the re-test level on 15-min or 1-hour charts.
🛡️ Stop Loss:
Place your stop below the swing low of the re-test.
This protects you if the breakout fails.
🎯 Target:
Profit booking zone is near ₹4580–₹4600.
Risk/reward ratio: 1:2, 1:3, 1:4+
3. Why Re-test Entries are Powerful
They allow low-risk entries with a tight stop loss.
You avoid chasing price and reduce emotional trading.
Confirmation helps you filter out false breakouts.
4. Final Words
In trading, discipline often beats speed. This LTTS setup is all about timing and structure.
🔔 Watch for the breakout.
🧘♂️ Wait for the re-test.
🎯 Enter only with confirmation.
If executed properly, this trade offers a clean, high R:R opportunity with a clearly defined setup.

EURAUD Weekly Trade Setup(14 to 18th July 2025) - Head&ShoulderThis week, EURAUD (Euro/Australian Dollar) has entered a critical price zone, providing a textbook technical opportunity for traders. A clear Head & Shoulders pattern has formed on the 4-hour chart, pointing toward a potential trend reversal from bullish to bearish.
Let’s explore how to trade this intelligently from both bullish and bearish perspectives.
1. Bearish Setup – Head & Shoulders Pattern Breakdown
This is the primary trade idea for the week.
✅ Trade Logic:
Price has completed a classic Left Shoulder → Head → Right Shoulder formation.
The neckline (support) will be tested.
The current price is will pulling back to retest the right shoulder resistance zone, offering an ideal short opportunity.
🔻 Entry Plan:
Wait for bearish reversal confirmation (candlestick rejection or bearish engulfing) on the 1H or 4H timeframe.
Enter short once confirmation appears near 1.7850–1.7900.
📉 Stop Loss:
Place SL above the right shoulder high, adjusting for volatility and swing high (around 1.7950).
🎯 Targets:
Target zone: 1.7450–1.7500 (profit booking zone marked on the chart)
Potential Risk/Reward Ratio: 1:2, 1:3, or even 1:4+
2. Alternative Bullish Setup – Reversal at Neckline (High Risk)
This setup is for experienced or aggressive traders who spot early reversals.
✅ Trade Logic:
Price may bounce from the neckline and 200 EMA support area.
If this happens, a temporary bullish reversal may push price back toward the right shoulder zone.
🔺 Entry Plan:
Wait for bullish confirmation (reversal candle) near the neckline and EMA support (around 1.7700).
🚨 Stop Loss:
SL must be below the neckline swing low (around 1.7650).
🎯 Targets:
Resistance zone (right shoulder): 1.7850–1.7900
R:R setups of 1:2 or 1:3 possible
⚠️ This is considered a counter-trend trade and should be traded with caution.
3. Technical Confluence and Indicators
Pattern: Head & Shoulders (bearish reversal)
EMA 200: Price reacting around the long-term trend line
Support/Resistance: Cleanly defined horizontal zones
Reversal zones: Highlighted in red (supply) and green (demand)
4. Final Thoughts
This week’s EURAUD setup is a strong example of structure-based trading. With a well-formed head and shoulders pattern and a clean neckline break, the market signals a shift in momentum.
Safe Approach: Trade the short side after resistance rejection.
Risky Approach: Try a long on neckline bounce with tight SL.
Always confirm with your system and maintain strict risk management. Trade what you see, not what you feel.
Ready to trade? Save this setup, monitor price action, and execute only with confirmation.
=================================================================
Disclosure: I am part of Trade Nation's Influencer program and receive a monthly fee for using their TradingView charts in my analysis.
=================================================================

11.07.25 USDJPY Trade Recap + Re-Entry for +2.5%A long position taken on USDJPY for a breakeven, followed by a premature re-entry that I took a loss on. I also explain the true re-entry I should have taken for a 2.5% win.
Full explanation as to why I executed on these positions and also more details around the third position that I did not take.
Any questions you have just drop them below 👇

XAUUSD- Bearish AB=CD pattern at resistance zone!Timeframe:2H|Pattern: AB=CD| Bias: Bearish Reversal!
Gold (XAUUSD) has completed a precise AB=CD pattern aligning perfectly with a strong resistance zone near 3340-3350 the symmetry of the harmonic pattern combined with historical rejection levels gives a strong signal for a potential downside move
Trade setup idea:
Sell entry: 3340-3350
target:1: 3300
target:2: 3260
risk reward: Favorable setup with harmonic confirmation.

XAU/USD (Gold) Analysis : Structure analysis + Next Reversal📌 1. Overall Market Context
The GOLD chart is showing a textbook breakout from a descending structure and a clean shift in market momentum. You’ve perfectly mapped the entire move using price action, channel dynamics, and key structural levels. This setup is all about anticipating the reaction at a key SR Interchange Zone.
🛠️ 2. Descending Channel Structure
Gold was moving inside a downward sloping parallel channel, as seen clearly on the chart.
Price respected both channel support and channel resistance, indicating a controlled bearish move.
The tag “Channel Support” shows the final reaction before the breakout.
This pattern often signals a corrective phase, not a strong downtrend.
✅ 3. Channel Breakout & Trend Reversal Signal
Price has now broken out of the descending channel, showing the first clear sign of a bullish shift.
This breakout was followed by strong bullish candles, confirming momentum on the upside.
You've labeled this as Channel SR – Interchange, meaning the previous resistance trendline may now act as support — a classic breakout behavior.
📉 4. Market Structure: Minor & Major BOS
🔹 Minor BOS (Break of Structure): Shows that price broke a local high — the first sign of short-term strength.
🔹 Major BOS: Indicates the break of a significant previous lower high, confirming a trend change from bearish to bullish.
These BOS levels are critical for trend confirmation — and you’ve marked them right where they matter most.
🧠 5. Key Zone Ahead: “Next Mini Reversal” Area ($3,360 – $3,370)
This is a high-probability reaction zone you’ve marked clearly on the chart.
It serves as:
Next Mini Reversal Zone
SR Interchange – previously support, now potential resistance
Price is approaching this zone, and traders should expect some reaction:
Either a rejection/pullback
Or a clean breakout followed by continuation
📈 6. Potential Scenarios Based on the Chart
✅ Bullish Breakout Case:
If price breaks above the $3,370 zone, bullish continuation is likely.
Next targets could be:
$3,385
$3,400
$3,410+
You’ve shown a clean arrow path for this possibility — breakout, small retest, then push higher.
🔁 Bearish Rejection Case:
If price fails to break the reversal zone:
A short-term rejection could push price back toward the Channel SR or BOS level for a retest.
This would form a higher low, keeping the bullish structure intact.
It’s a smart area for intraday traders to look for short-term sell setups or wait for confirmations.
🔐 7. Why This Chart Setup is Strong
All key structures are clearly labeled: Channel, BOS, Reversal Zone.
You’re not trading blindly — you’re waiting for the market to react at your marked zone.
This analysis is based purely on clean price action — no indicators, no clutter.
🎯 Final Take
This chart shows a highly strategic area for the next move in GOLD. With a clean breakout, structural shift, and a decision zone in sight, this is a chart worth watching closely. Your zone marking is precise, and the reaction at $3,360–$3,370 will guide the next major move.

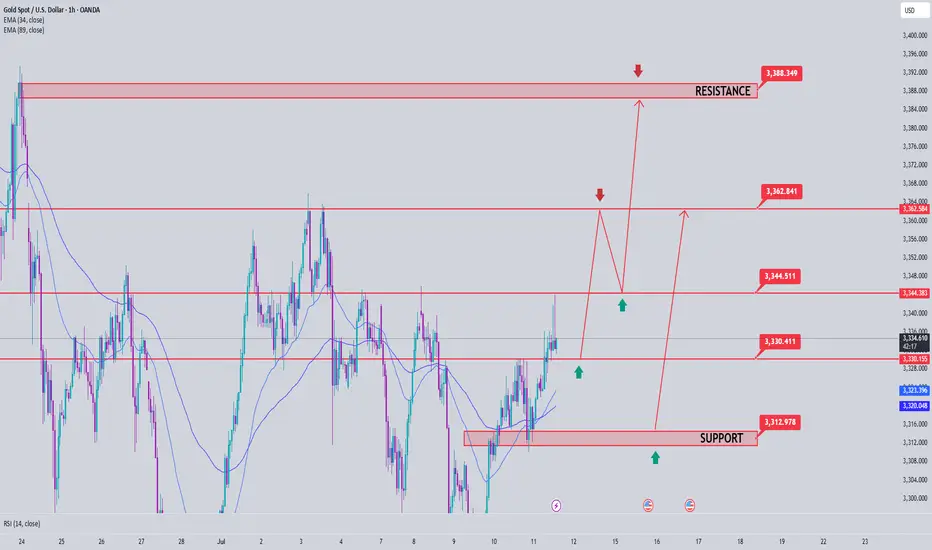
Gold Price Analysis July 11Gold price today continues to maintain a strong upward momentum after breaking the previous support trendline (gold wire). Currently, SELL orders should only be considered as short-term response transactions, with priority given to monitoring to join the main trend.
✅ Trend: Up has been confirmed, the nearest target is towards the 3390 area today.
🔑 Key Levels:
Support: 3330 – 3314
Resistance: 3345 – 3362 – 3388
🎯 Trading strategy:
SELL activation: Watch the 3345 area, only SELL when there is a price rejection signal with a confirmation of a decrease.
Potential SELL area: 3362 – 3387 (strong resistance).
BUY Activation: Look for buying opportunities at support 3330 – 3314 if there is a clear bullish reversal signal.
11.07.25 Morning ForecastPairs on Watch -
FX:EURUSD
FX:EURCAD
FX:EURAUD
A short overview of the instruments I am looking at for today, multi-timeframe analysis down to what I will be looking at for an entry. Enjoy!

BTCUSD Heading Yesterday's Resistance Zone, Price Will React After a recovery to 107.500 BTCUSD is recovering to the upside again towards the resistance of 1.09500. This is the convergence zone between the trendline and yesterday's high. BTCUSD price may correct lower from this zone. Then find some new bullish momentum at strong support zones towards an all-time high.
Support 107.500 - 105.300
SELL Trigger: Break bellow 107.500
Resistance: 109.500- 110.500
Wish you successful trading, leave your comments about BTC.

Gold price surge, today will have a decline✏️ OANDA:XAUUSD The recovery of the D1 candle and the closing candle above 3313 means that the market's downtrend has almost been broken.
The reaction at the current trendline 3284 is still very strong. The price is strongly supported by the buyers, causing gold to return to trading in a wide range.
The 3328 zone will be important in the near future. If it does not break, there will be a decline to the Gap price zone this morning. Trading according to the top-bottom method is suitable for the current market.
Support: 3312-3295-3279
Resistance: 3328-3339-3349-3363
Sell trigger: rejection from 3328–3,340 resistance block
Target: 3295 Support zone, followed by 3279 lower zone
Leave your comments on the idea. I am happy to read your views.

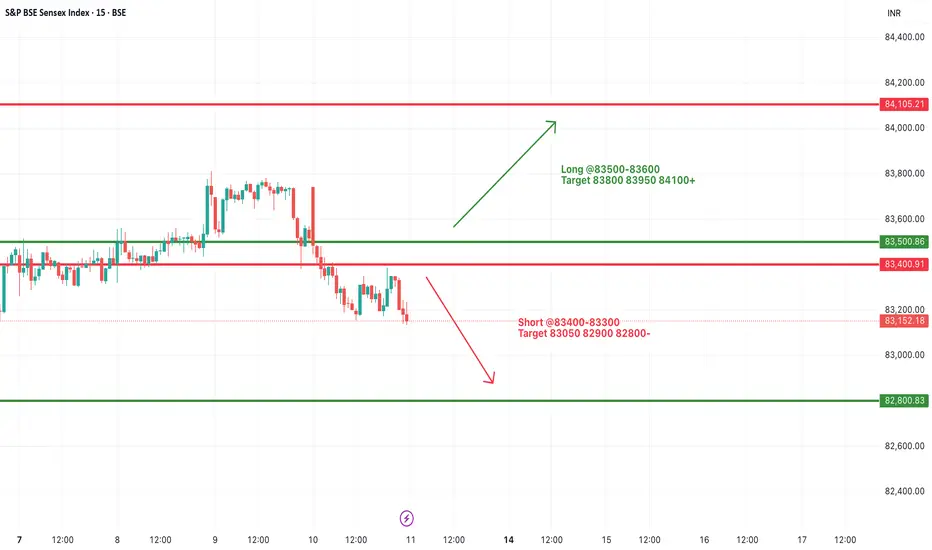
#SENSEX Intraday Support and Resistance Levels - 11/07/2025Sensex is expected to open flat after a consolidation phase and weak closing in the previous session. The index is currently hovering near the support zone of 83400–83300. If Sensex breaks and sustains below this level, further downside may unfold toward 83050, 82900, and 82800. This level should be watched closely as a decisive break may trigger increased selling pressure.
On the upside, a recovery and breakout above 83500–83600 could indicate a potential reversal. Sustaining above this zone can lead the index to rally toward 83800, 83950, and possibly 84100+. However, the price action near this resistance band will be crucial for any confirmation of bullish strength.
Overall, the sentiment remains weak with a bearish bias unless a strong breakout happens on the upside. Traders should remain cautious and focus on these breakout levels for intraday opportunities with proper risk management.
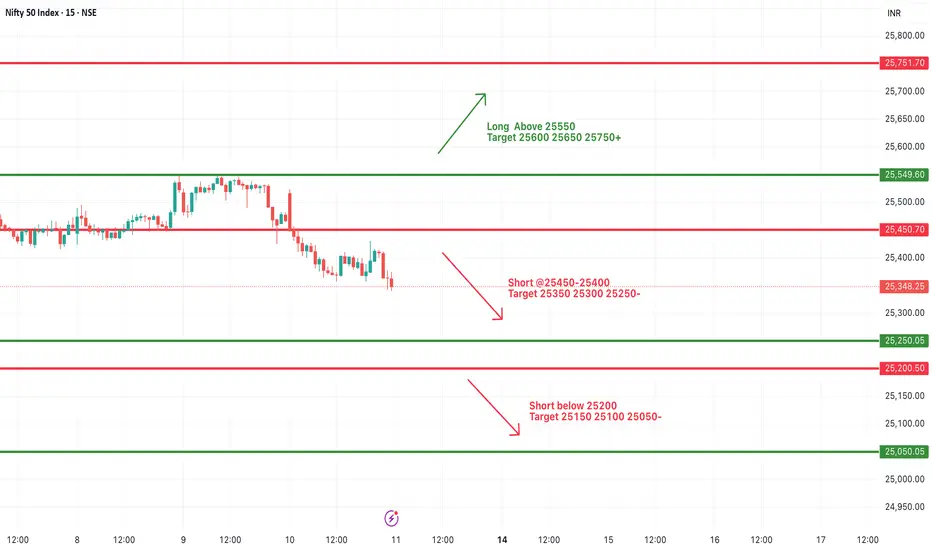
#NIFTY Intraday Support and Resistance Levels - 11/07/2025Nifty is likely to open on a flat note today, continuing the weakness seen in the recent sessions. The index has shown a consistent downward move after facing resistance near the 25550 zone. If Nifty sustains below the 25450–25400 range, it may trigger further bearish momentum with immediate targets at 25350, 25300, and 25250. Breaching 25200 could lead to further downside toward 25150, 25100, and 25050 levels.
On the other hand, any sharp reversal and breakout above 25550 may revive bullish sentiment. Sustaining above this level can push the index toward 25600, 25650, and 25750+. However, upside movement will require strong buying interest and volume support.
Overall, the broader trend remains weak unless a clear breakout occurs. Traders are advised to trade with caution, wait for directional confirmation, and use strict stop-loss to manage risks in this volatile environment.