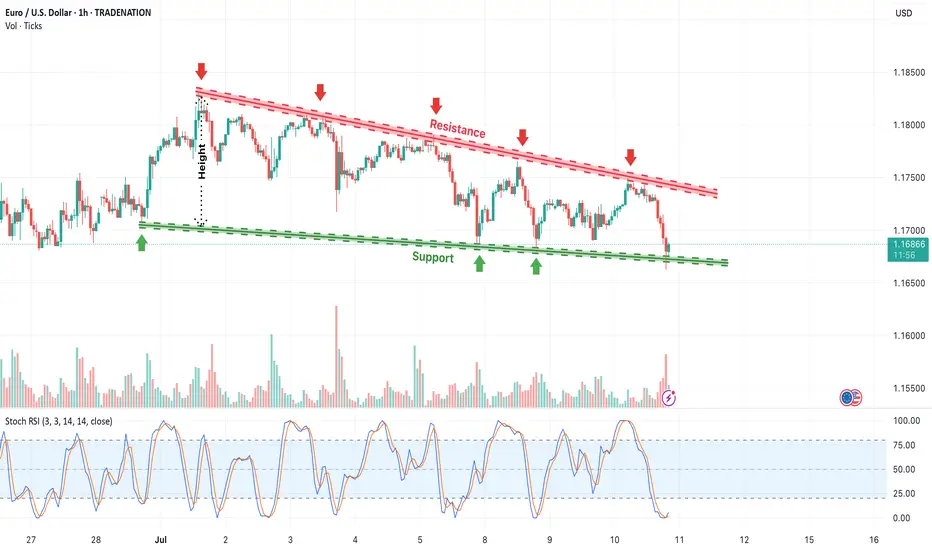
Descending Channel Pattern Forming in EUR/USDThe EUR/USD pair is currently trading within a well-defined descending channel on the 1-hour timeframe, as shown in the chart. The pair has been making consistent lower highs and lower lows, indicating a bearish trend. The red downward-sloping resistance line has been respected multiple times, while the green support line continues to act as a buying zone for bulls.
The resistance trendline has been tested five times (marked with red arrows), confirming strong selling pressure.
The support line has held three key touches (green arrows), suggesting buyers are still defending this level.
A breakout below the support zone could lead to further downside, while a reversal or breakout above resistance may trigger bullish momentum.
Traders should watch for volume confirmation and breakout direction before entering new positions.
=================================================================
Disclosure: I am part of Trade Nation's Influencer program and receive a monthly fee for using their TradingView charts in my analysis.
=================================================================
Priceactionanalysis
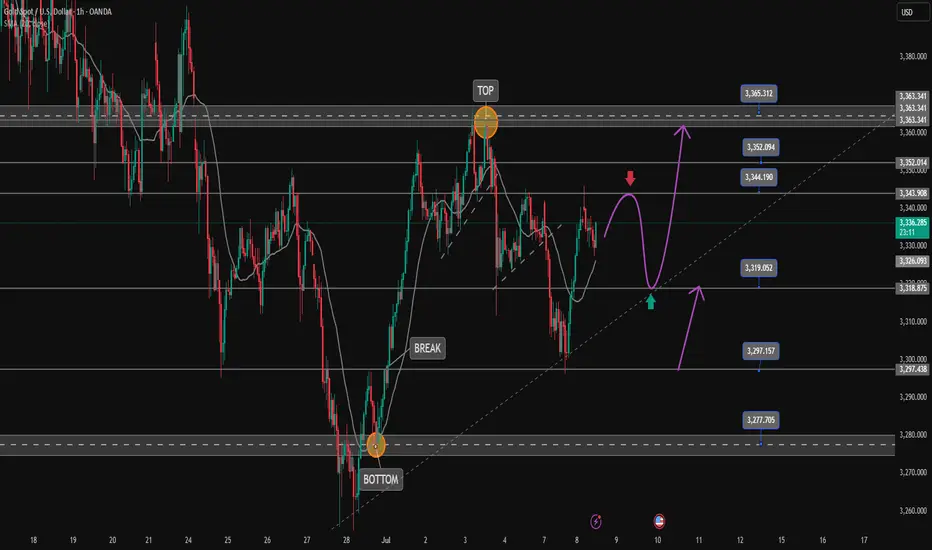
The price is climbing toward the top of the channel.OANDA:XAUUSD
We are currently in a wide descending channel on the 1-hour timeframe, and a potential move upward toward the top of the channel is expected.
Note: Our previous analysis on gold (XAUUSD) remains valid and intact.

BTCUSD At Crucial Pivot Point. Is This The Ceiling? - PhoenixFX BTCUSD Price-Action Analysis & Scenarios
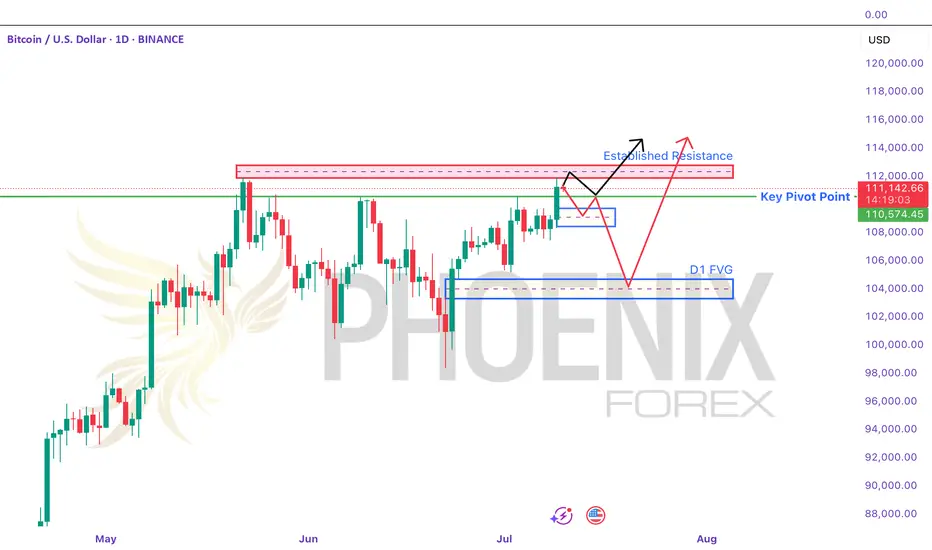
Below is an overview of the two possible paths for Bitcoin over the coming days, as sketched out by the black and red arrows on your chart. We’ll also highlight the key pivot level and resistance zone that will decide which scenario plays out.
🔵 Key Levels to Watch
Established Resistance (~$111,800–$112,500)
This zone marks multiple failed attempts to break higher in recent weeks. It’s where large stop-runs and sell-side limit orders tend to cluster. A decisive daily close above $112K is required to signal genuine bullish continuation.
Daily Pivot Point (~$110,600)
Acting as the “battle line” between bulls and bears, this pivot is the first level to confirm market bias.
Above $110.6K: Tends to favor buyers, suggesting strength and higher-high attempts.
Below $110.6K: Gives the bears the edge, increasing the odds of deeper retracements.
📈 Black-Arrow (“Bullish Continuation”) Scenario
Break & Hold Above Resistance
Price thrusts cleanly above $112K on strong volume.
Retest the H4 Order Block (~$111,000–$111,200)
A shallow pullback into the highlighted H4 demand zone (blue box) offers a lower-risk long entry.
New Highs
From there, Bitcoin resumes its uptrend, closing the week with fresh highs above the prior $113K peak.
Key Trigger: Sustained daily close above $112K, followed by a successful retest of that level.
📉 Red-Arrow (“Bearish Rejection & Dip”) Scenario
Rejection at Resistance
Price stalls and reverses somewhere between $111,800–$112,500, forming a bearish reversal candle.
Drop to Daily FVG Zone (~$104,000–$105,000)
This larger Daily Fair-Value Gap (blue box lower on the chart) coincides with strong weekly support—an ideal zone for dip buyers.
Recovery Rally
After absorbing selling pressure in the FVG, BTC bounces back toward the established resistance, setting up a second test of $112K.
Key Trigger: Clear bearish price action (e.g., engulfing or pin-bar) in the $111.8K–$112.5K zone, followed by a daily close below the pivot at $110.6K.
🎯 How to Trade These Setups
Bullish Entry:
Wait for daily close > $112K
Enter on pullback into $111K–$111.2K (H4 order block)
Stop below $110.6K pivot; target new highs above $113K+
Bearish Entry:
Look for bearish reversal signals in $111.8K–$112.5K
Enter on break & close below $110.6K pivot
Target $104K–$105K (Daily FVG); stop above $112.5K
Note: The pivot at $110.6K is your first “line in the sand” for bias—trade in the direction of the break, and use the major resistance zone to confirm strength or failure. Always manage your risk and adjust to how price actually unfolds!
Just a Heads-Up:
This is my take on the charts—not gospel, not financial advice, and definitely not a crystal ball 🔮. Trading is part skill, part patience, and part “what just happened?” 😅
We all see things a little differently, and that’s the beauty of it. So if you’ve got a hot take, wild theory, or just want to drop some chart wisdom—hit the comments!
Let’s grow, learn, and laugh through the madness together. 🚀📈
Each one, teach one.
— Phoenix FX Team 🔥🦅
10.07.25 Morning ForecastPairs on Watch -
FX:USDJPY (live position)
FX:EURNZD
FX:EURUSD
A short overview of the instruments I am looking at for today, multi-timeframe analysis down to what I will be looking at for an entry. Enjoy!

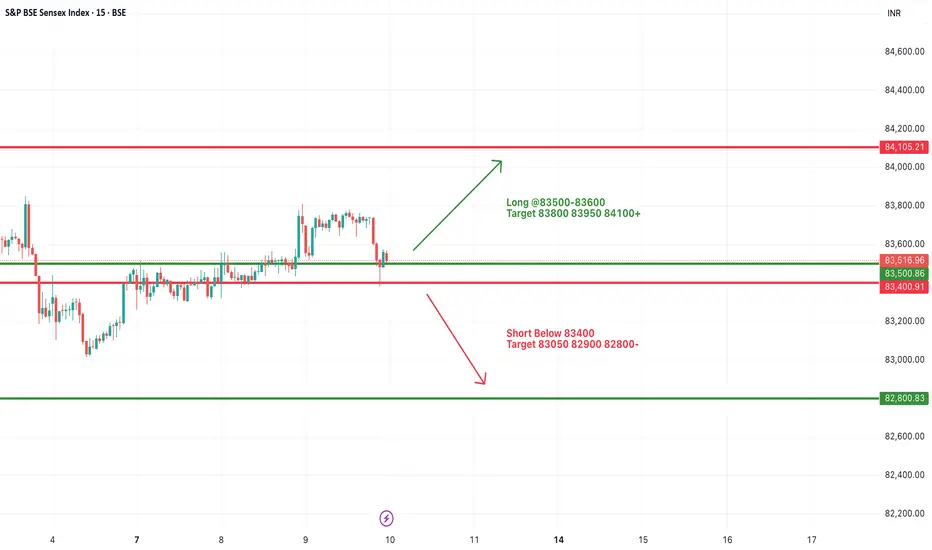
#SENSEX Intraday Support and Resistance Levels - 10/07/2025Sensex is expected to open flat today, continuing the consolidation observed in the past few sessions. The price action remains range-bound with key support near 83400 and resistance around 83600 levels.
Currently, Sensex is hovering near its critical range with buyers and sellers struggling for control. A breakout above the 83500–83600 zone may trigger fresh bullish momentum with targets at 83800, 83950, and 84100+. Sustained movement above 84100 could signal a stronger trend reversal.
On the downside, a breakdown below the 83400 level could lead to weakness, with immediate targets at 83050, 82900, and 82800-.
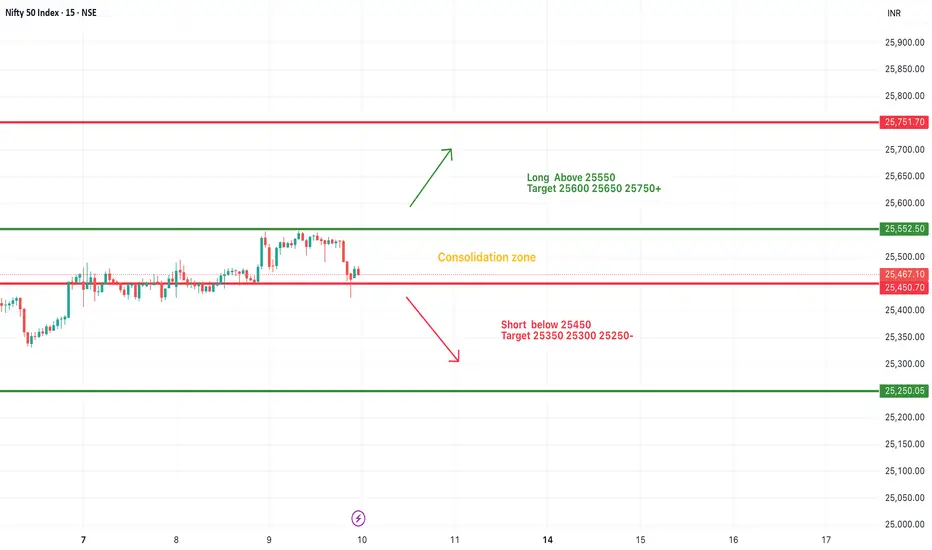
#NIFTY Intraday Support and Resistance Levels - 10/07/2025Nifty is also expected to open flat today, reflecting a similar consolidation pattern observed in recent sessions. The index continues to trade within a tight range, signaling indecisiveness among traders and lack of strong directional momentum.
Currently, Nifty is oscillating in a consolidation zone between 25550 resistance and 25450 support. A breakout above 25550 could trigger fresh long entries, with potential upside targets at 25600, 25650, and 25750+. Sustained strength above 25750 may open the way for extended bullish movement.
Conversely, a breakdown below the 25450 level may lead to short opportunities, with downside targets at 25350, 25300, and 25250-.
Until the index decisively breaks out of this range, sideways movement is likely to persist. Traders should wait for confirmation before taking aggressive directional positions.
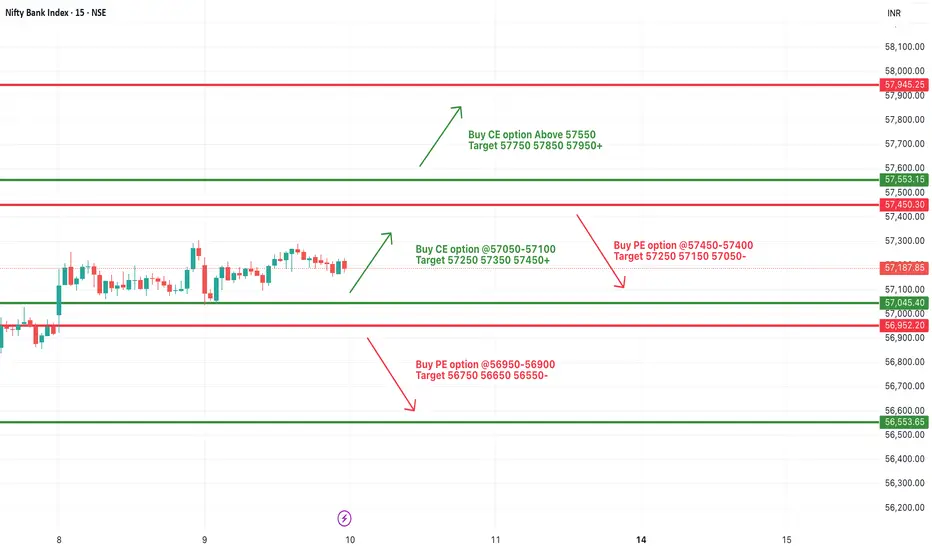
[INTRADAY] #BANKNIFTY PE & CE Levels(10/07/2025)Bank Nifty is expected to open flat today due to the continued consolidation seen over the last few sessions. The index is trading within a tight range between 57450 on the upside and 57050 on the downside, indicating indecision in the market.
A sustain above the 57050–57100 zone could initiate fresh buying momentum, potentially pushing prices towards the targets of 57250, 57350, and 57450+. Sustained move above 57550 may further lead to an extended rally toward 57750, 57850, and even 57950+ levels.
On the other hand, if the index breaks below the 56950–56900 level, it may invite fresh selling pressure. In such a scenario, downside targets are seen at 56750, 56650, and 56550-.
Until a decisive move happens beyond the upper or lower bounds, expect sideways action within the current consolidation range. Traders are advised to wait for a breakout from the range for directional trades.
$BNB Chart Showing Bullish Flag Pattern and Price Will Hit +$750CRYPTOCAP:BNB Previously Chart showing Bullish Inverse Head and Shoulder Pattern and Gain Profit of Range. It's a Reversal Pattern .
Now Chart Showing a Bullish Flag Pattern and it's Continuation Pattern. Time to Bullish for BNB Coin for FOMC 10th July Thursday 2025.
The upsloping 20-day EMA and the RSI just above the midpoint indicate a slight edge to the bulls. If the $665 resistance falls, the BNBUSD pair could rise to $675 and then to $698.
Sellers are likely to pose a solid challenge at $698 because a break above it could propel the pair to $732. I'm guess BNB Price Breakout of ATH and $888 Mystery will Happen.
This optimistic view will be negated in the near term if the price turns down and breaks below the moving averages. The pair may then drop to $636.
NEWSBTC: BNB Price Gears Up for Upside Break — Will Bulls Deliver?
BNB price is gaining pace above the $650 support zone. The price is now showing positive signs and might aim for more gains in the near term.
BNB price is attempting to recover from the $620 support zone.
The price is now trading above $655 and the 100-hourly simple moving average.
There is a key contracting triangle forming with resistance at $662 on the hourly chart of the BNB/USD pair (data source from Binance).
The pair must stay above the $655 level to start another increase in the near term.
BNB Price Eyes More Gains
After forming a base above the $620 level, BNB price started a fresh increase. There was a move above the $645 and $650 resistance levels, like Ethereum and Bitcoin.
The price even surged above the $660 level. A high was formed at $666 before there was a downside correction. The price dipped below the 50% Fib retracement level of the upward move from the $650 swing low to the $666 swing high.
The price is now trading above $655 and the 100-hourly simple moving average. On the upside, the price could face resistance near the $662 level. There is also a key contracting triangle forming with resistance at $662 on the hourly chart of the BNB/USD pair.
The next resistance sits near the $665 level. A clear move above the $665 zone could send the price higher. In the stated case, BNB price could test $672. A close above the $672 resistance might set the pace for a larger move toward the $680 resistance. Any more gains might call for a test of the $700 level in the near term.
Another Decline? If BNB fails to clear the $662 resistance, it could start another decline.
Initial support on the downside is near the $655 level and the 61.8% Fib retracement level of the upward move from the $650 swing low to the $666 swing high. The next major support is near the $650 level.
The main support sits at $644. If there is a downside break below the $644 support, the price could drop toward the $632 support. Any more losses could initiate a larger decline toward the $620 level.
Technical Indicators
Hourly MACD – The MACD for BNB/USD is gaining pace in the bullish zone.
Hourly RSI (Relative Strength Index) – The RSI for BNB/USD is currently above the 50 level.
Major Support Levels – $655 and $650.
Major Resistance Levels – $662 and $665.
#Write2Earn #BinanceSquareFamily #BinanceTurns8 #BNB #SUBROOFFICIAL
Disclaimer: This article is for informational purposes only and does not constitute financial advice. Always conduct your own research before making any investment decisions. Digital asset prices are subject to high market risk and price volatility. The value of your investment may go down or up, and you may not get back the amount invested. You are solely responsible for your investment decisions and Binance is not available for any losses you may incur. Past performance is not a reliable predictor of future performance. You should only invest in products you are familiar with and where you understand the risks. You should carefully consider your investment experience, financial situation, investment objectives and risk tolerance and consult an independent financial adviser prior to making any investment.

Gold continues downtrend today✏️#GOLD view
Yesterday's D1 candle confirmed the decline in gold prices when the selling pressure returned below the liquidity candle wick. The extension of the downtrend will continue today.
Yesterday's strong support zone 3297 has become today's resistance zone, this is the SELL point today when there is confirmation from the selling side in this zone.
3310 The confluence resistance zone between the trendline and the US Session Resistance is noted in today's SELL strategy. The previous SELL Target 3352 orders pay attention to the reaction at 3377.
📈Key Level
SUPPORT 3277-3250
RESISTANCE 3297-3310-3328
SELL Trigger: Price cannot break 3297
SELL DCA Trigger: Break 3276
Target: 3250
BUY Trigger:PriceTrading above 3276
Leave your comments on the idea. I am happy to read your views.
BIG 810% in 1 day $0.60 to $5.46💥BIG 810% in 1 day 📈 $0.60 to $5.46 there were almost more halts than candlesticks that's how wildly it traded NASDAQ:PROK
Other active stocks: NASDAQ:SCAG NASDAQ:BTCS NYSE:SRFM NASDAQ:BMGL NYSE:WOLF
#stocks #stockmarket #trading #trader #daytrade #strategy #teamwork #chart #analysis

09.07.25 Morning ForecastPairs on Watch -
FX:GBPUSD
FX:EURAUD
OANDA:JP225USD
FX:USDCAD
A short overview of the instruments I am looking at for today, multi-timeframe analysis down to what I will be looking at for an entry. Enjoy!

Gold Price Analysis July 9GOLD XAU/USD ANALYSIS – CONFIRMING THE CONTINUATION OF THE BEARISH WAVE
Yesterday's D1 candle confirmed the downward momentum of gold when the selling pressure returned strongly below the liquidity candle wick. This shows that the selling pressure is still dominant and the downward momentum is likely to continue in today's session.
🔹 IMPORTANT RESISTANCE ZONE: 3297
The 3297 zone – which was a strong support in yesterday's session – has now turned into a resistance zone. This is a potential SELL zone for the day, especially if there is a confirmation signal from the sellers at this price zone.
🔹 CONFUSION RESISTANCE ZONE: 3310
The 3310 area is the confluence between the downtrend line and the resistance zone of the US session – which needs special attention in the SELL strategy. If the price approaches this zone, expect a reaction from the selling side to return.
🎯 SUGGESTED STRATEGY:
SELL when price does not break through 3297 (confirm selling pressure at resistance)
SELL DCA if price breaks down to 3276
Target: 3250
BUY only considered if price holds 3276 and has a bullish reaction
📌 Key Levels:
Support: 3277 – 3250
Resistance: 3297 – 3310 – 3328
Important reaction zone: 3377 (if price rebounds)

#SENSEX Intraday Support and Resistance Levels - 09/07/2025Sensex is expected to open slightly gap up near the 83500–83600 range, showing positive momentum as it breaks out from its recent consolidation zone. A sustained move above this level could trigger further upside, with immediate targets seen at 83800, 83950, and 84100+ levels. This zone will act as a crucial resistance-turned-support for the session.
However, if the index fails to hold above 83500 and slips below 83400, it may enter a corrective phase. A breakdown below 83400 could lead to a downward move toward 83050, 82900, and possibly 82800-. Overall, trend remains positive above 83600, and traders should watch for confirmation in the opening session.

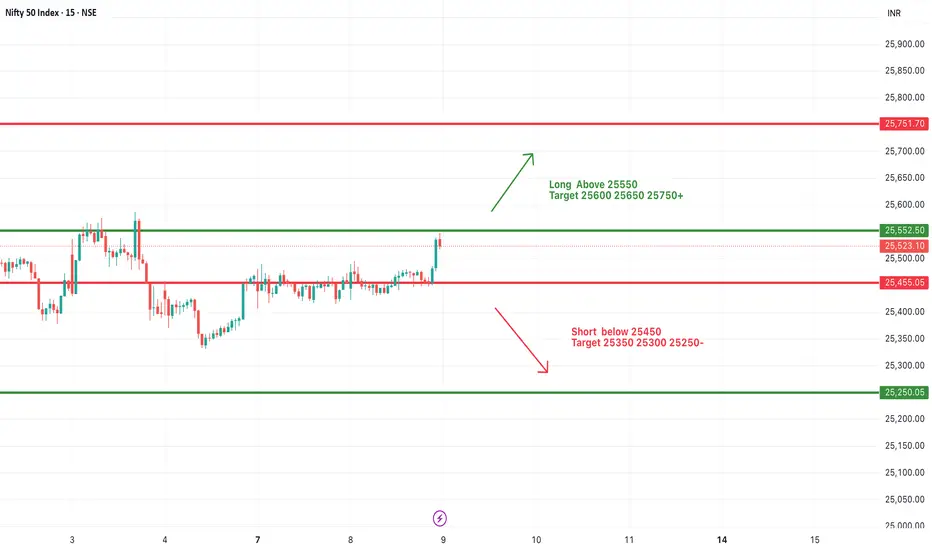
#NIFTY Intraday Support and Resistance Levels - 09/07/2025Nifty is expected to open slightly gap up around the 25500–25520 zone, showing positive momentum from the previous day’s breakout above its recent consolidation range. If the index sustains above the 25550 level, we can expect bullish continuation toward the upside targets of 25600, 25650, and 25750+ levels. This zone may act as an intraday breakout trigger.
On the downside, 25450 will now act as immediate support. Any sharp move below 25450 could invite selling pressure, and we may see a downside slide toward 25350, 25300, and 25250-. The trend remains mildly bullish above 25550, while below 25450 the trend may turn weak intraday.
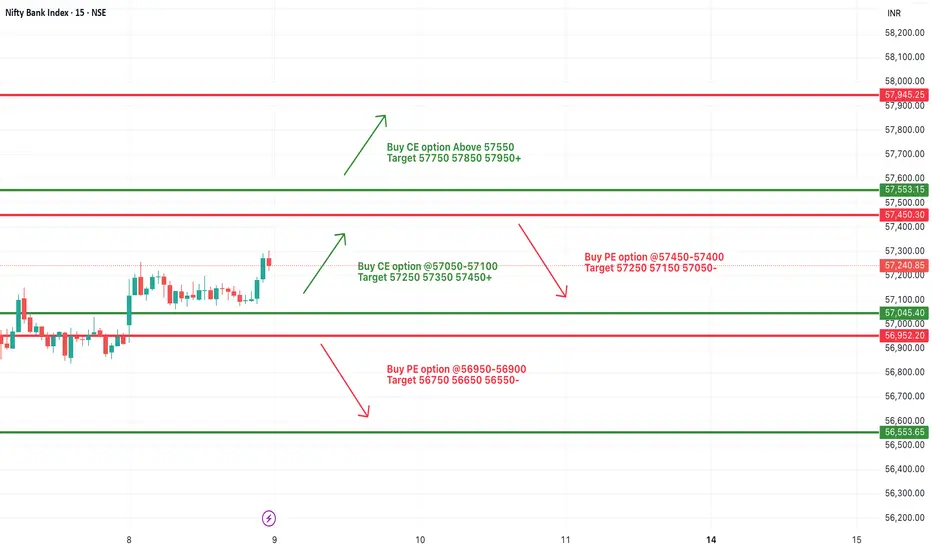
[INTRADAY] #BANKNIFTY PE & CE Levels(09/07/2025)Bank Nifty is expected to open slightly gap up today near the 57200-57250 zone, indicating mild bullish sentiment carrying over from the previous session. The index has broken out of the tight consolidation range and now approaches a key resistance near the 57400-57450 area.
A sustained move above 57550 could lead to a fresh upward rally toward 57750, 57850, and 57950+, supported by recent bullish momentum. However, if the index fails to sustain above 57400-57450, it may see a pullback, where traders should watch for possible selling pressure targeting 57250, 57150, and even 57050-.
If Bank Nifty drops below the 57100 level and especially under the 56950-56900 zone, it may turn bearish with potential downside targets at 56750, 56650, and 56550-. Overall, price action around the 57450 level will be key in defining intraday trend direction.
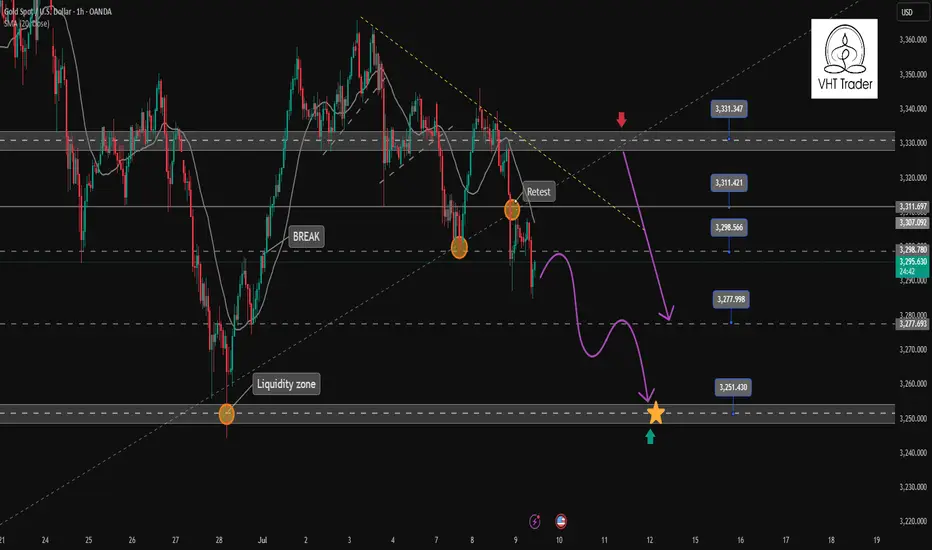
Gold (XAUUSD) – July 9 | M15 Bearish Pullback After H4 OB Tap🟡 Gold (XAUUSD) – July 9 Analysis | H4 OB Tapped, M15 Still Bearish
The market has just tapped into the H4 order block near 3280 (3288–3275) — a level we’ve been tracking closely.
However, price action shows that the H4 pullback is still active and not yet complete.
Yesterday, Gold respected the H4 supply zone (3342–3345) exactly as anticipated.
Since then, price broke below the M15 low at 3296 , confirming that bearish momentum remains valid on the lower timeframe.
🔍 Structure Breakdown
• H4: Pullback ongoing
• H4 OB: 3288–3275 (just tapped)
• M15: Broke below 3296 → Bearish trend continuation confirmed
• Current M15 State: In pullback phase
⚠️ Key Consideration:
While we are looking at bearish opportunities, keep in mind that the H4 OB (3288–3275) is a significant demand zone.
If the market begins to reclaim structure and breaks the Lower High(H4 supply zone), this could signal resumption of the H4 uptrend .
Until that happens, we remain cautiously short — but prepared to adapt.
📌 What We’re Watching
Despite the H4 OB tap, M15 remains bearish until proven otherwise.
So the focus stays on short opportunities — no longs unless structure shifts.
📍 Key M15 POI for Rejection:
→ 3322–3326 (Order Block)
→ If price pulls into this zone and gives M1 confirmation (ChoCh + micro BoS)
→ We’ll plan short setups aligned with current trend
If this zone fails, or structure flips bullish, we’ll wait patiently for a potential revisit of the H4 supply zone (3342–3345) — which remains a valid short area for high-probability setups.
🧠 Summary:
✅ H4 OB (3288–3275) tapped
❌ No bullish reversal yet — M15 still bearish
🔍 Watching 3322–3326 for possible short
📉 Bias: Bearish until structure shifts
But be flexible — if LH breaks, the game changes.
📖 Respect the structure.
The chart doesn’t reverse because you want it to —
It reverses when the market is done moving the other way.
📘 Shared by @ChartIsMirror

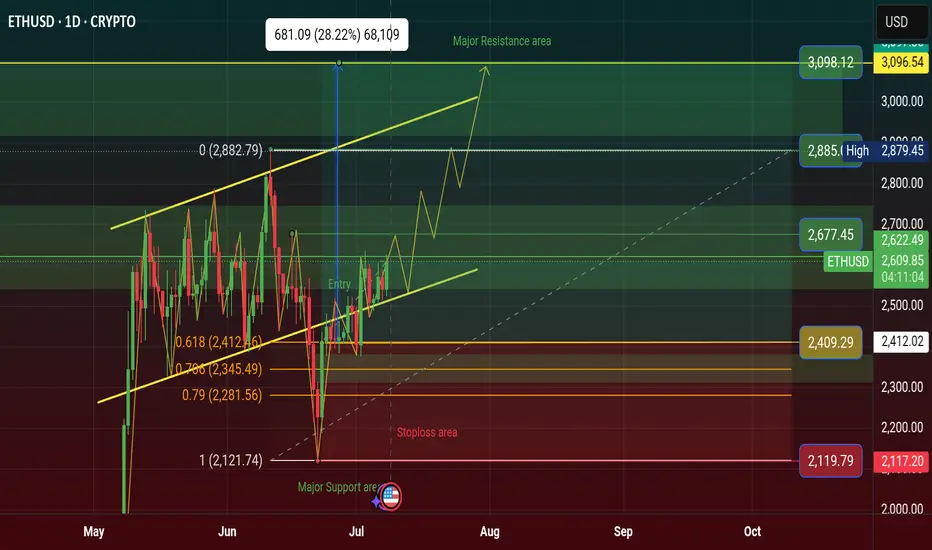
$ETH Price Will Rising $3098 in Q3, Bullish Flag Inverse AngleCRYPTOCAP:ETH price will Rising $3098 in Q3 in 2025, Price Showing a Bullish Flag Inverse Angle. it's a Reversal Pattern and Manipulation Price. See more on Chart.
Crypto News: An Ethereum address holding 900 ETH started moving coins Monday after spending nearly 10 years dormant.
The holder received these genesis coins in 2015 when ETH traded below 50 cents.
These pre-mined tokens were distributed to early Ethereum contributors before mining began.
Their current value reaches 2.2 million with ETH trading around 2,529 per coin.
This represents potential gains exceeding 5,000% from the original sub-dollar entry price.
The move follows similar whale activity, including a 27.6 million Ethereum sale in April.
Last week saw a Bitcoin whale move 8 billion after 14 years of hodling.
ETH remains 48% below its 2021 all-time high of 4,878 despite recent stability.
The holder technically isn't a whale, which requires a minimum of 10,000 ETH at current prices.
#Write2Earn #BinanceSquareFamily #ETH #SUBROOFFICIAL
Disclaimer: This article is for informational purposes only and does not constitute financial advice. Always conduct your own research before making any investment decisions. Digital asset prices are subject to high market risk and price volatility. The value of your investment may go down or up, and you may not get back the amount invested.
$SOL Price Will Hit $228 Q3, Inverse Head and Shoulder Pattern✨ CRYPTOCAP:SOL Price Will Hit $228 in Q3 of 2025 | Solana Chart Showing Inverse Head and Shoulder Pattern. It's a Bullish Reversal Pattern.
‣ Solana price is hovering below key resistance; a breakout above $159 and it's going to $228.
ETF Buzz Grows, but Price Action Still Caught in Limbo Here is why this could be the catalyst that sends price to all time highs Do THIS before that happens.
‣ Solana ETF Buzz Grows, but Price Action Still Caught in Limbo
🔸BlockNews The SEC has asked SOL ETF applicants to revise and refile submissions by end of July, fueling speculation of an ETF approval before October. Solana’s daily active addresses just hit a record 15.39 million, pointing to rising demand and user engagement on the network.
#Write2Earn #NFPWatch #BinanceSquareFamily #TrumpTariffs #SUBROOFFICIAL
Disclaimer: This article is for informational purposes only and does not constitute financial advice. Always conduct your own research before making any investment decisions. Digital asset prices are subject to high market risk and price volatility.

BTC , 4hr , BearishBTC is Forming a Pattern and it is at the top of the Another Pattern and It is facing rejection 3 Times from Above and now it is forming another pattern inside and Ready for Break Down of the Pattern , if it breaks the Pattern Down then it will be bearish almost 90% it will move to down side , if it has not given Breakdown and moving inside the small pattern then wait patiently and observe carefully .
Then it may also give Breakout for up side .
Follow Risk Management Properly
Follow for More Swing Ideas Like this .

Gold is bullish and needs more momentum at 3320The buying pressure in the US session pushed the price up and formed a bullish hammer candle on D1. Today's bearish recovery is seen as a buying opportunity to head towards the uptrend again.
3344 is the immediate resistance zone in the European session that Gold faces. Breaking this resistance zone will head towards 3365. According to the wave structure, it would be great to have a retest of 3320 to find some buying momentum and then break 3344.
SUPPORT: 3320-3297
RESISTANCE: 3345-3352-3365
SELL Trigger: Break 3320 ( Trendline & break zone)
Do you have any comments on the trading plan? I would love to hear your views.
This pullback is necessary to maintain the channel structure.OANDA:CHFJPY
We're in an ascending channel on the higher time frame, and based on candlestick patterns, I expect a minor crash as the market tests the bottom of the channel.
Stay with me so we don't miss the move. ✅
Gold price analysis July 8In the previous US session, strong buying pressure pushed gold prices up and formed a bullish hammer candlestick pattern on the D1 chart - a potential sign for an uptrend recovery.
🔄 Today's scenario: The correction in the early session is considered a good opportunity to buy, expecting the price to continue the uptrend.
📍 Nearest resistance zone:
The price is currently facing the resistance zone of 3344 in the European session. If gold breaks 3344, the next target will be 3365 - the gap zone that has not been filled.
However, according to the wave structure, it would be more optimal if the price has a retest to the 3320 zone, accumulates more buying momentum and then breaks out strongly through 3344.
📉 Bearish scenario:
If 3320 is broken, especially with a trendline and support zone breakout signal, a sell strategy can be activated with a lower target.
🔸 Support: 3320 – 3297
🔸 Resistance: 3345 – 3352 – 3365
🔸 Sell is triggered if: Price breaks 3320, confirms breaking trendline & support zone.
💬 Do you have any comments on this trading plan? Leave a comment!

08.07.25 Morning ForecastPairs on Watch -
FX:EURUSD
FX:USDJPY
A short overview of the instruments I am looking at for today, multi-timeframe analysis down to what I will be looking at for an entry. Enjoy!
