GOLD Analysis : SR Interchange , Reversal Zone + High Break🧠 Market Context & Structural Overview:
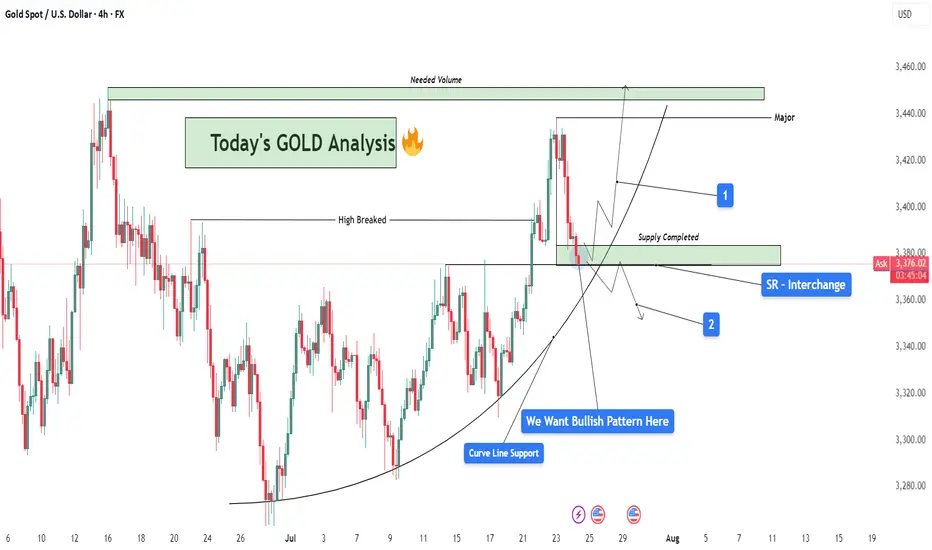
Gold has been trading within a clearly defined bullish structure after forming a rounded base pattern in early July, indicating accumulation by smart money. The market recently broke through a key horizontal resistance (previous swing high), marking a potential bullish continuation phase. However, we are now witnessing a pullback — a healthy corrective phase — that is currently testing multiple high-probability confluences.
🧱 Key Technical Zones Explained:
🔹 1. SR Interchange Zone – High Probability Reversal Area:
This area (roughly between $3,360 and $3,380) acted as previous resistance (supply) and has now flipped into support.
This is a textbook Support-Resistance Interchange (SR Flip) — a concept where prior resistance becomes new support.
Traders often look for entries here, especially when it aligns with other technical factors.
🔹 2. Curve Line Support – Dynamic Buyer Strength Indicator:
A curved trendline, often referred to as a parabolic support, has been respecting price structure for over two weeks.
Price is now sitting exactly on this support, signaling potential for another impulsive bullish leg if momentum builds.
🔹 3. Supply Zone Completed – Correction Phase Active:
The supply zone above (approx. $3,420–$3,440) has already been tapped and respected by the market.
This “completed” supply may now act as resistance unless broken with strong volume — we now watch how price reacts at the current pullback zone.
📊 What the Candles Are Telling Us:
The latest candles show some hesitation from sellers — wick rejections and smaller body candles hint at buyer interest at this level. However, confirmation is crucial. We want to see a bullish reversal pattern such as:
Bullish engulfing
Morning star
Pin bar (hammer)
Break and retest of minor resistance inside the SR zone
🔮 Scenarios to Watch:
✅ Scenario 1 – Bullish Continuation (Ideal Setup):
If a bullish reversal forms at this support zone:
Expect a potential rally back to the $3,420–$3,440 resistance area.
If this zone breaks with high volume, price could target the major supply zone near $3,465+, where we’ll need “Needed Volume” for a decisive break.
⚠️ Scenario 2 – Bearish Breakdown (Alternative View):
If the curve support and SR zone fail to hold:
Expect a drop towards $3,345 – $3,320 — where next structural support lies.
This would suggest a deeper retracement or range formation before bulls can regroup.
🧩 Strategy & Psychology:
“We want bullish pattern here.”
You’ve highlighted the importance of not entering impulsively. This is about trading with confirmation, not prediction. Waiting for a valid bullish pattern reduces risk and increases probability.
This is where smart traders win — waiting patiently for confirmation at a zone of confluence.
🧠 Learning Mindset – Why This Zone Matters:
Combines horizontal support, curved trendline, and broken structure retest.
This zone is the battleground between bulls and bears — whoever wins here will likely control short-term momentum.
Newer traders can study this as a classic example of multi-confluence trading, which combines price action, market structure, and dynamic trendlines.
Priceactionsetup
USDJPY Buy Setup! OB + 61.8% Fib + Trend Channel ConfluenceUSDJPY | 30-Min Chart – High Probability Buy Setup in Progress
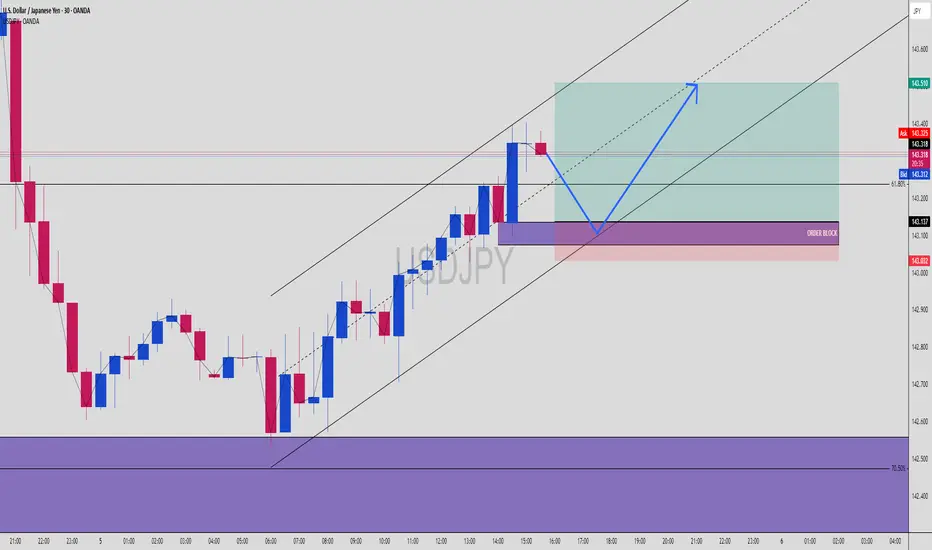
USDJPY is currently respecting a bullish market structure within a well-defined ascending trend channel. Smart Money Concepts (SMC) traders are watching for a precise reaction at the confluence of a key Order Block (OB), Fibonacci retracement levels, and mid-channel support.
🔍 Trade Breakdown:
Bullish Market Structure
Price has shifted from bearish to bullish after forming a key higher low and continuing with higher highs within the trend channel. The structure is being respected with multiple taps on both upper and lower channel boundaries.
Internal Liquidity & Order Flow:
Price previously swept sell-side liquidity below the recent swing low and sharply reversed, confirming internal liquidity engineering and institutional involvement.
Currently, we’re seeing price stall after rejecting the upper channel and OB zone. A retracement into the discount zone is anticipated before continuation.
🟣 Order Block Zone (OB): 143.032 – 143.137
A clear bullish OB formed after a strong impulsive move, marking the last down candle before the bullish break of structure.
Located just above the 61.8% Fibonacci level — strong confluence.
📐 Fibonacci Levels from Last Swing Low to High:
61.8% = 143.137
70.5% = 143.032
Potential reaction zone aligns perfectly with OB + trendline + psychological round level (143.000 area)
📊 Buy Setup Expectation:
USDJPY is expected to retrace into the OB/Fib confluence zone before a bullish continuation toward the upper boundary of the trend channel and beyond.
🔵 Projected Path:
Price dips into OB → reacts to 61.8–70.5% retracement → bullish reversal → break to fresh highs near 143.510 or higher
🧠 Chart Ninja Entry Plan:
🔹 Entry Zone: 143.032 – 143.137 (OB + 61.8–70.5% Fib)
🔻 SL Below: 143.000 (beneath OB and psychological level)
📈 Target: 143.510 (channel top + previous supply zone)
⚖️ RRR: Approx. 1:3+ — high precision Smart Money entry
💬 Ninja Wisdom:
Patience before profit. Wait for price to return to the zone where institutions left footprints — the OB at equilibrium pricing. Combine OB + Fib + channel and you're trading like the banks.
Retail buys the breakout. Smart Money buys the pullback. 🥷📚
📍 Save this chart before the setup triggers!
🧠 Do you see the same confluence? Comment your entry/TP/SL plans ⬇️
👣 Follow @ChartNinjas88 for more sniper setups on major FX pairs every session!
XAUUSD Golden Bounce? Discount OB Loading for LongXAUUSD | 30m Smart Money Buy Setup – Liquidity Sweep + Discount OB Combo
Gold’s about to act like… gold. 🤝
Price has pumped hard, and now we’re watching for a pullback into a premium discount zone — to trap sellers and give institutions their perfect entry.
Let’s break down this textbook Smart Money Concept setup:
📌 1. HTF Context:
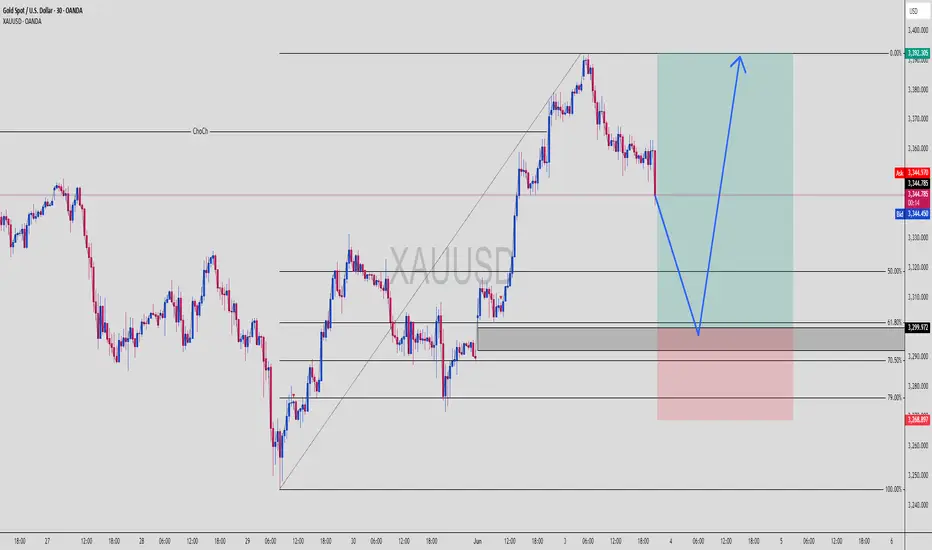
Massive bullish impulse breaking old structure highs
Change of Character (ChoCh) confirmed — buyers are in control
Market is now retracing to rebalance inefficiencies + mitigate previous demand
📊 2. Key Levels:
🔻 Entry Zone (OB): Around 3,299.972
🔻 Deeper Discount (Fib 70.5–79%): 3,280.000 – 3,268.897
📈 TP1: Recent high – 3,392.305
🛡️ Stop Below: 3,268.897
🎯 RR Potential: 1:3+ – clean sniper shot
🧠 3. Smart Money Logic:
Price is pulling back into a refined OB zone inside discount territory
This zone overlaps with a clean FVG + 70.5% fib level
Price likely to tap into this zone, fake out sellers, then launch with momentum
🔁 4. Execution Plan:
✅ Wait for:
M5–M15 bullish BOS or engulfing candle inside the OB
Strong rejection wick off the refined OB/FVG
Entry confirmation = go long with tight SL
TP = HTF resistance / liquidity highs
Remember: Let price come to you. Don’t chase the setup. Be a sniper, not a machine gunner. 🎯
💡 5. Why This Long is Gold (Literally):
✅ Perfect structure flip (ChoCh)
✅ OB inside a clean discount zone
✅ Liquidity resting below = magnet before reversal
✅ Risk:Reward is beautiful
This isn’t just a bounce — this is a smart money rebalance play, and gold loves to respect these zones with explosive moves 💥
💬 Drop “XAU Bounce 🔥” in the comments if you’re watching this unfold
📥 Save this for future entries
📈 Follow @ChartNinjas88 for the sharpest Smart Money setups on Gold & Majors
XAUUSD Hits FVG in Premium Zone — Bearish Setup in Play!📉 XAUUSD (Gold) has just tapped into a key Fair Value Gap (FVG) after a clean, impulsive rally — now we’re watching for Smart Money distribution and a potential reversal from this high-risk premium area.
📊 Chart Insights:
✅ Price retraced into the FVG zone between $3,225 – $3,240
✅ This zone aligns with the 79% Fibonacci retracement, making it a premium zone for shorts
✅ Market structure shows previous bearish impulse → this could be a retracement before continuation
✅ Current PA is reacting to the imbalance left on the drop
✅ Massive downside potential to rebalance price near $3,120
🧠 Smart Money Confluence:
FVGs are often rebalanced after price trades away impulsively
The retrace into this inefficient pricing zone is classic Smart Money mitigation
Price now sits in an area where institutions may look to offload long positions
📍 Potential Play:
Short Entry Zone: $3,225 – $3,240
Targets:
TP1: $3,200
TP2: $3,170 (mid-level liquidity)
TP3: $3,120 (full FVG fill and higher TF draw)
Invalidation: Clean break and hold above $3,240
💡 Pro Tip:
Watch for a lower timeframe structure shift (15m/5m) or confirmation candle to stack entries. The market loves to sweep highs before the real move begins — patience pays. 🧠💰
📈 This setup offers 3:1+ RR and aligns with Smart Money’s tendency to sell into imbalance and hunt liquidity below.
💬 Comment “Gold Setup” if you’re trading this one!
🔁 Share or save if you're watching for the drop.

How to Trade After Major News Events – The 15-Min Trap SetupHello Traders!
We all get excited when major news hits the market — whether it’s budget day, RBI policy, US inflation data, or company results . But jumping in too early can be a trap. Smart money often creates fake moves in the first few minutes. That’s where the 15-Min Trap Setup becomes a powerful tool for intraday traders.
Let me show you how to avoid traps and catch real moves after news events.
Why the First 15 Minutes Matter
Emotions are high: Retail traders often react instantly without confirmation. This creates liquidity for big players.
Fake breakouts happen often: Price breaks key levels in the first candle — then reverses and traps traders.
Volume is misleading: The biggest volume often comes early, but the real direction is seen later.
The 15-Min Trap Setup – How It Works
Step 1: Wait for the first 15-minute candle to close after a big news event — don’t trade before that.
Step 2: Mark the high and low of this 15-minute candle.
Step 3: Wait for a fake breakout above or below that range — if price breaks out but quickly comes back inside, it’s a trap.
Step 4: Enter in the opposite direction of the breakout after confirmation — ride the real move.
When to Use This Strategy
Major economic events – like Fed decisions, budget day, inflation data, RBI policies.
Company results – high-impact earnings or news releases.
Gap up/gap down openings after big global cues.
Rahul’s Tip
Don’t react — observe. Let the market show its trap. Big players love early overconfidence. Use their game to your advantage by planning around the 15-min candle.
Conclusion
The 15-Min Trap Setup helps you avoid emotional trades and catch the real move after major news. Be patient, mark your zones, and strike when the trap is confirmed. This simple rule can completely change your intraday game.
Have you ever been trapped in the first candle after news? Let’s share experiences below and grow together!
