YFII is fighting on very important S/R level! YFII is located in a very important Support / Resistance zone as we see in chart H4.
If we switch to a lower time frame of M15, we see that the price is also at today's Pivot Point.
If this value is broken, we can trade in the Short direction, on the contrary, if this level acts as a support and is confirmed, we can open a Long trade.
Direct entry into the trade must be in accordance with the rules of our private Price action strategy, which includes additional confluence.
Have a nice day and Happy trading, Alex_UCT
Priceactionstrategy

BTC is trying to repeat the pastHello dear friends
Experience has shown that in financial markets, history can be repeated over and over again
Based on the shared chart, my idea is that this coin will be able to grow up to 74K soon after the pattern ceiling breaks.
A strong buy signal is valid if the pattern breaks within 4 hours.
I, like you, am ready and waiting.
******Appropriate entry points for supports and resistances according to the chart*******
If you like this idea, Please Follow me and do not forget that your likes and comments are very very important .
Thank you dear friends.
Be generous and rich.

XAGUSD Daily - longsimple price action analysis.
ill do long with the tp of 24.478 and sl of 21.384.
how ever ill move my sl up when it become safer.

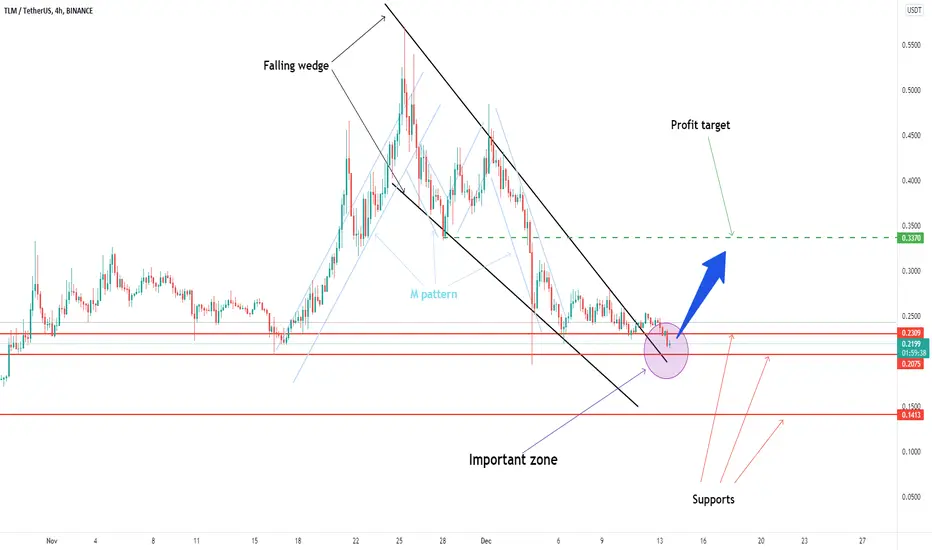
TLM/USDT: Falling wedge has been broken! The price of Alien Worlds Trilium (TLM) is 0.22 now.
We are in important zone right now (Purple circle in the chart),
where Falling wedge has been broken up and the price is sitting on historical strong support.
We also see M pattern which expect that the price will go back to a Neck line (Green dashed line).
Happy trading, Alex_UCT
Why Safepal bulls need more safety and could dump more. Safepal wallet token price reviewed using simple price action by Bitcoin Gorilla. Can Sfp Token price see any pump in 2022? Find out more in the video. SafePal S1 enables you to secure, send, buy, swap, and exchange crypto in the easiest way.
This technical analysis on sfp coin is done using price action strategy without any indicators implemented. .


EGLD/USDT Analysis: Strong price reaction soon!On the EGLD / USDT chart we see how the trend lines are squeezing our price.
The price is falling to very strong support, where the EMA 200 Daily is also important.
This place of strong confluence TL + S/R + EMA200 is marked in the purple box.
Here we expect a strong price reaction and an upward price reflection.
If all the conditions of our Price action strategy are met, we will enter the Long Position.
Happy trading, Alex_UCT

GBPAUD: Potential Trend-Following Trade Explained 🇬🇧🇦🇺
GBPAUD is very bullish from the beginning of November.
Setting a new high the pair retraced.
The market is approaching a key level at the moment.
To buy it with confirmation, watch a double bottom formation on 1H time frame.
1.844 - 1.85 is its neckline.
Your trigger to buy is an hourly candle close above that.
Then you buy aggressively or on a retest.
First goal - 1.855
In case of a bearish breakout of a blue zone,
the setup will be invalid.
❤️Please, support this idea with like and comment!❤️

GBPJPY Bullish Possibility GBPJPY bearish movement seems unable to penetrate the strong support. GBPJPY made a base around strong support which indicates the price had big chance turning into a bullish move. A bullish negative divergence is also seen on the Stochastic Indicator. I predict the price will reach the area of 151,570 - 152,217. Because there is a small resistance and the golden ratio of the Fibonacci clusters gathered together in the area of the price range.

1INCH / TETHER analysis. Will we Short or Long?? 1INCH is located at the end of the triangle and the price is squeezed. We assume a break of the triangle and a retest of one of the broken lines.
If a breakthrough occurs and all the rules of our strategy are satisfied, we will enter the trade with several levels for take profit.
Everything will be shared with our members. Here you can see how the situation is going in time.
Please leave a comment or like.
Happy trading, Alex_UCT

Multi-timeframe analysis for MATIC/USDTMATIC is progressing nicely up the trend line.
Now there is a reflection on the D1 chart and MATIC can go up, however, this chart is also dependent on Bitcoin, as well as other altcoins.
When we switch to chart H1, it reflects again the current trend line, which is in confluence with the current support and Pivot point S2.
The green levels are marked for resistance, which is used for possible Profit targets, while the red levels are used for placing stop losses.
Our students have all the information about whether we will trade this opportunity and also what levels we will use for our eventual trade.
Have a nice day and Happy Trading. Alex_UCT

The handshake goodbye conceptI talk about a price action concept that has helped me with trading and TA. It's a simple yet powerful concept. Bonus for no indicators needed!
Let me know what you think.


PRICE ACTION PATTERNS | Descending Triangle 🔰
Hey traders,
In this video, you will learn a classic price action pattern "Descending Triangle".
Main topics covered:
Structure of the pattern
Bias of the pattern
Triggers
Stop placement
Target selection
Real market example
Let me know in a comment section what pattern do you want to learn in the next video!
❤️Please, support this video with like and comment!❤️

EURCAD ( Perfect support zone)we have a perfect support zone
I think the price could side about the maximum one day and then after that
we would see a strong bull trend
please don't miss this situation

EURUSD (Beauty Long position)Don't miss this situation
this is the best price to open a big long position
but use stop loss below the 1.11671
good luck
thank you

Gold ( lovely Long )we have good resistance to opening a long position
don't miss this one
you can trail your stoploss
thank you
good luck

Nifty Kel Levels and Zones For Intraday [15 Nov 21]Nifty at resistance levels. So, if it shows some kind rejection near previous day High then downside is possible. However, better wait for break of trendline that may drag Nifty near 18000 levels.
In case, Nifty breaks above Previous day High and sustains above that key level, then you might see strong momentum.
Watch the key levels


EURCAD SHORTPrice is inside a ranging market overall, got back to a supply zone and made a reversal pattern and broke the trend so we should see potential selling of this pair for the main time. 1:7RR will be a very good idea. Hope you all enjoyed and made money through my recent chart analysis. Pls do follow me on here i will start on my mentorship videos soon okay. Love you Guys. !GET THAT BAG HARD!!!

XAUUSD UPDATE INTRADAY OPPERTUNITYXauusd is showing the bullish opportunity since we are sitting in the buying now we have to wait for some pullback so the main area we can see see the buying confirmation so we can entor long untill our both level will catch

EURNZD: Very Bearish Outlook 🇪🇺🇳🇿
EURNZD retested a daily key resistance again.
After its test, the price formed a head and shoulders pattern
and broke below a support line of a rising channel & a horizontal neckline of h&s.
The price may drop lower now.
Next support - 1.6188
❤️Please, support this idea with like and comment!❤️
