12.08.25 Morning ForecastPairs on Watch -
FX:GBPAUD
FX:CADJPY
FX:USDJPY
A short overview of the instruments I am looking at for today, multi-timeframe analysis down to what I will be looking at for an entry. Enjoy!
Priceactiontrading

11.08.25 Morning ForecastPairs on Watch -
FX:USDCAD
FX:GBPAUD
FX:CADJPY
OANDA:XAGUSD
A short overview of the instruments I am looking at for today, multi-timeframe analysis down to what I will be looking at for an entry. Enjoy!

Discipline Ends Where Hope Begins“The moment you start hoping… you’ve already left your plan behind.”
Most traders think they lose because the market “turned against them.”
But in reality — it’s when their mind turned against their rules.
Hope is silent at first.
It whispers when your stop loss is near:
“Just a little more room…”
It whispers when price is almost at your target:
“Maybe it can go further…”
In both cases, it’s the same enemy wearing two masks.
And the instant you listen — discipline ends .
Here’s the paradox:
Hope feels good.
Discipline feels hard.
But in trading, the thing that feels hard is the thing that saves you.
Rules are the antidote to hope.
You don’t “feel” your way through a trade.
You execute your way through it.
Some of the most dangerous trades aren’t the obvious losses —
They’re the ones you “saved” by breaking your rules.
Because now, you’ve trained your mind that hope works.
Until it doesn’t. And when it fails… it takes everything.
What I’ve shared here is only a fragment of the psychology I’ve written about in The Chart is the Mirror .
The deeper process — how to replace hope with pure, unshakable execution — is something I’ve reserved for readers who truly want to rewire their trading mind.
📘 Shared by @ChartIsMirror
Comment below if this hits home for you. Or tell me — which part of trading psychology should I uncover next?

AUDJPY & CADJPY Trade Recaps 08.08.25A long position on AUDJPY taken Monday for a -1%, the trade had great potential but one of those ones that didn't have enough steam to commit. Followed by a CADJPY short taken yesterday for a +2% manual close.
Full explanation as to why I executed on these positions and the management plan with both.
Any questions you have just drop them below 👇

08.08.25 Morning ForecastPairs on Watch -
FX:GBPJPY
FX:EURNZD
FX:GBPAUD
A short overview of the instruments I am looking at for today, multi-timeframe analysis down to what I will be looking at for an entry. Enjoy!

07.08.25.25 Morning ForecastPairs on Watch -
FX:CADJPY (Live position)
FX:EURNZD
FX:EURCAD
A short overview of the instruments I am looking at for today, multi-timeframe analysis down to what I will be looking at for an entry. Enjoy!

EURCAD: More Growth Ahead 🇪🇺🇨🇦
EURCAD broke a resistance line of a bullish flag pattern yesterday.
A consequent confirmed Break of Structure BoS indicates
that the rise will most likely continue.
The next strong resistance is 1.61.
The market is going to reach that soon.
❤️Please, support my work with like, thank you!❤️
I am part of Trade Nation's Influencer program and receive a monthly fee for using their TradingView charts in my analysis.

06.08.25 Morning ForecastPairs on Watch -
FX:GBPAUD
FX:EURAUD
FX:EURUSD
FX:EURCAD
A short overview of the instruments I am looking at for today, multi-timeframe analysis down to what I will be looking at for an entry. Enjoy!

BUY GBPUSD 5.8.2025Confluence order: BUY at M15
Type of order: Limit order
Reason:
- The current top is not touching anything, expected to rise to the sub-key of H1 above.
Note:
- Management of money carefully at the last bottom (1,33013)
Set up entry:
- Entry buy at 1,32790
- SL at 1,32597
- TP1: 1,33013 (~1R)
- TP2: 1,33411 (~3,5R)
Trading Method: Price action (No indicator, only trend and candles)

AUDCAD / GBPAUD Trade Recaps 01.08.25A tester trade on AUDCAD with the reasons explained as to why this was a test position, and a short position executed on GBPAUD. Solid setup that this time around just didn't commit.
Full explanation as to why I executed on these positions and the management plan with both.
Any questions you have just drop them below 👇

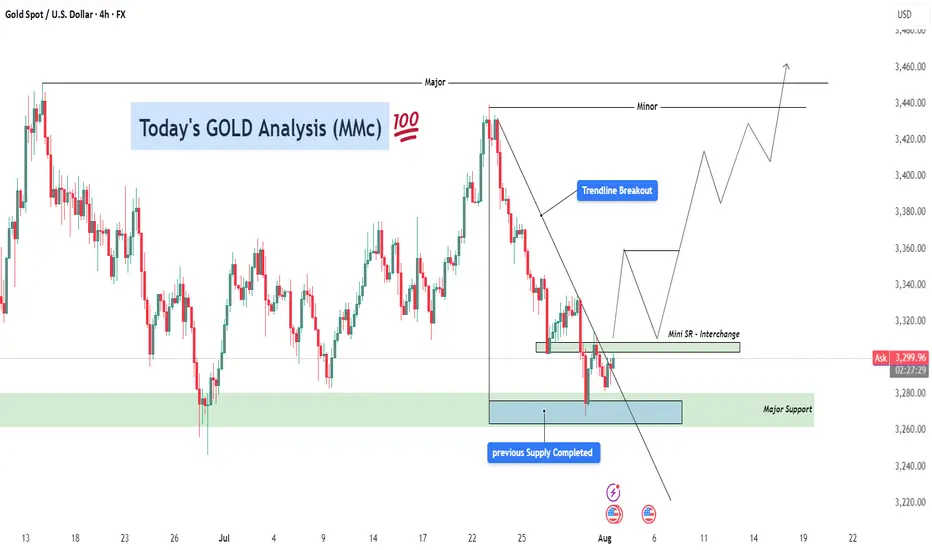
GOLD Analysis – Bullish Recovery Setup After Trendline Breakout ⚙️ Technical Structure Overview
This 4-hour chart of Gold (XAUUSD) illustrates a classic reversal setup developing after a significant correction. Price previously faced strong selling pressure from the 3,470+ zone and declined sharply. However, the recent price action suggests a shift in control from sellers to buyers, signaling a likely medium-term trend reversal or a bullish wave formation.
The key to this setup lies in three confluences:
Completion of a previous supply zone, which no longer holds influence.
Aggressive buyer activity from a major support zone.
A clean break above the descending trendline, which is a common signal that bearish momentum is losing strength.
🔑 Key Levels & Concepts Explained
🟢 1. Major Support Zone (3,260–3,280)
This zone has been tested multiple times and each time, buyers stepped in and prevented further downside. The most recent rejection from this area shows long wicks and bullish engulfing candles, indicating accumulation by institutional players. This is the foundational support that has held the entire corrective structure.
📉 2. Trendline Breakout
The descending trendline connecting swing highs has now been broken to the upside. This is a critical technical signal, especially on the 4H timeframe, as it suggests a potential trend reversal or at least a deep retracement in the opposite direction.
Trendline breakouts typically result in a retest of the trendline or a nearby support-turned-resistance zone (as is the case here with the Mini SR level).
It also implies that supply is weakening, and buyers are ready to push.
🧱 3. Mini Support/Resistance Interchange (~3,300–3,320)
This zone now plays the role of an interchange level—a previous minor resistance that could act as a support after the breakout. This level is crucial for intraday and swing traders because it can offer a low-risk long entry if price retests and confirms it with bullish momentum.
The chart projection suggests a bounce off this mini S/R, followed by successive higher highs and higher lows, forming a new bullish structure.
📈 Forecast Path & Trade Scenario
✅ Bullish Path (Preferred MMC Scenario)
Stage 1: Price retests the 3,300–3,320 zone (Mini S/R).
Stage 2: Buyers step in, leading to a bullish continuation.
Stage 3: Price targets the Minor Resistance (~3,440).
Stage 4: If momentum is sustained, it aims for Major Resistance (~3,470–3,480), completing a clean reversal formation.
This path reflects perfect bullish market structure—a breakout, followed by a retest and rally.
❌ Bearish Invalidation
If the price closes strongly below 3,260, the structure would be invalidated.
This would suggest that the support zone failed, possibly triggering deeper downside toward 3,220–3,200.
🧠 MMC Trader Mindset & Risk Considerations
Don’t Chase: Wait for a confirmed retest of the Mini S/R zone. Let the market come to your entry.
Entry Confirmation: Use candlestick signals like bullish engulfing, pin bars, or inside bars near the Mini S/R.
Volume Consideration: Volume should ideally rise on breakout legs and decline on pullbacks—this confirms healthy bullish structure.
Risk-Reward: With a stop below 3,260 and targets toward 3,470, the RR ratio favors long entries, especially after confirmation.
🔁 Summary Plan for Execution
Entry Zone: 3,300–3,320 (after bullish confirmation)
Stop Loss: Below 3,260 (structure break)
Take Profit 1: 3,440
Take Profit 2: 3,470–3,480
Risk-to-Reward: 1:2+ if planned carefully
01.08.25 Morning ForecastPairs on Watch -
FX:EURJPY
FX:EURGBP
A short overview of the instruments I am looking at for today, multi-timeframe analysis down to what I will be looking at for an entry. Enjoy!

31.07.25 Morning ForecastPairs on Watch -
FX:GBPAUD
FX:AUDCAD
FX:AUDCHF
A short overview of the instruments I am looking at for today, multi-timeframe analysis down to what I will be looking at for an entry. Enjoy!

30.07.25 Morning ForecastPairs on Watch -
FX:AUDUSD
FX:NZDUSD
FX:EURUSD
A short overview of the instruments I am looking at for today, multi-timeframe analysis down to what I will be looking at for an entry. Enjoy!

29.07.25 Morning ForecastPairs on Watch -
FX:EURGBP
FX:AUDUSD
FX:NZDUSD
A short overview of the instruments I am looking at for today, multi-timeframe analysis down to what I will be looking at for an entry. Enjoy!

GBPUSD - GBPJPY - USDJPY Trade Recaps 28.07.25Three positions taken last week. Some vital findings within my self-review process which showed a stop loss error with GBJPY causing me to miss a solid 4% trade, and a manual close on GBPUSD to bank a little extra profit.
Full explanation as to why I executed on these positions and the management plan with both.
Any questions you have just drop them below 👇

28.07.25 Morning ForecastPairs on Watch -
FX:EURCAD
FX:GBPUSD
OANDA:XAUUSD
FX:EURUSD
A short overview of the instruments I am looking at for today, multi-timeframe analysis down to what I will be looking at for an entry. Enjoy!

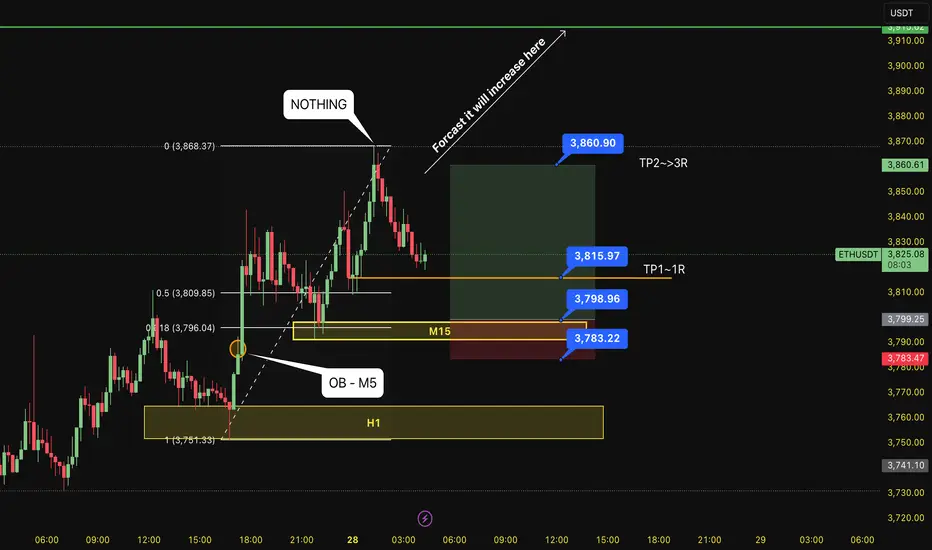
BUY ETH 28.7.2025Confluence order: BUY at M15
Type of order: Limit order
Reason:
- The current top is not touching anything, expected to rise to the H1 above.
- M15~FIBO 0,5-0,618 (same position)
Note:
- Management of money carefully at the last bottom (3,815)
Set up entry:
- Entry buy at 3,798
- SL at 3,783 (below OB NOT USED of M5)
- TP1: 3,815 (~1R)
- TP2: 3,860
Trading Method: Price action (No indicator, only trend and candles)
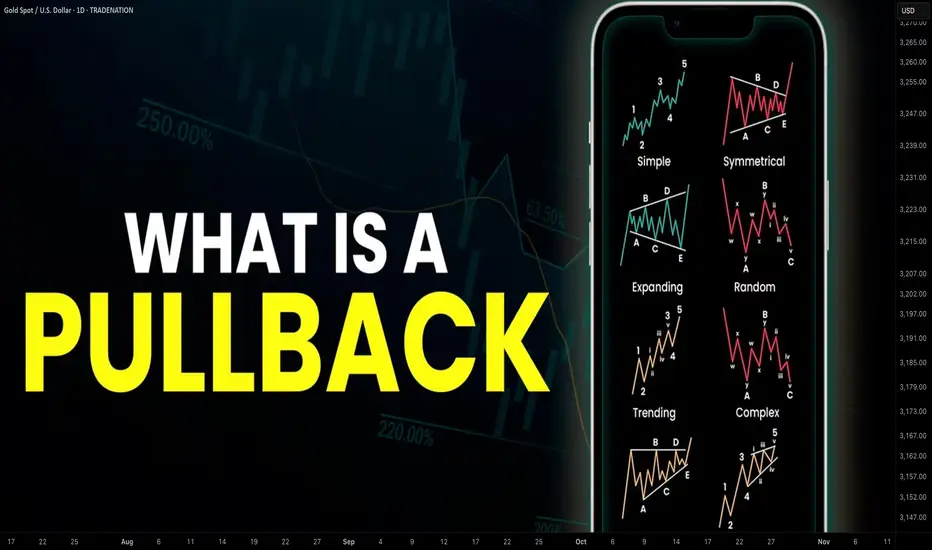
Learn What is PULLBACK and WHY It is Important For TRADING
In the today's post, we will discuss the essential element of price action trading - a pullback.
There are two types of a price action leg of a move: impulse leg and pullback.
Impulse leg is a strong bullish/bearish movement that determines the market sentiment and trend.
A pullback is the movement WITHIN the impulse.
The impulse leg has the level of its high and the level of its low.
If the impulse leg is bearish , a pullback initiates from its low and should complete strictly BELOW its high.
If the impulse leg is bullish , a pullback movement starts from its high and should end ABOVE its low.
Simply put, a pullback is a correctional movement within the impulse.
It occurs when the market becomes overbought/oversold after a strong movement in a bullish/bearish trend.
Here is the example of pullback on EURJPY pair.
The market is trading in a strong bullish trend. After a completion of each bullish impulse, the market retraces and completes the correctional movements strictly within the ranges of the impulses.
Here are 3 main reasons why pullbacks are important:
1. Trend confirmation
If the price keeps forming pullbacks after bullish impulses, it confirms that the market is in a bullish bearish trend.
While, a formation of pullbacks after bearish legs confirms that the market is trading in a downtrend.
Here is the example how bearish impulses and pullbacks confirm a healthy bearish trend on WTI Crude Oil.
2. Entry points
Pullbacks provide safe entry points for perfect trend-following opportunities.
Traders can look for pullbacks to key support/resistances, trend lines, moving averages or Fibonacci levels, etc. for shorting/buying the market.
Take a look how a simple rising trend line could be applied for trend-following trading on EURNZD.
3. Risk management
By waiting for a pullback, traders can get better reward to risk ratio for their trades as they can set tighter stop loss and bigger take profit.
Take a look at these 2 trades on Bitcoin. On the left, a trader took a trade immediately after a breakout, while on the right, one opened a trade on a pullback.
Patience gave a pullback trader much better reward to risk ratio with the same target and take profit level as a breakout trader.
Pullback is a temporary correction that often occurs after a significant movement. Remember that pullbacks do not guarantee the trend continuation and can easily turn into reversal moves. However, a combination of pullback and other technical tools and techniques can provide great trading opportunities.
❤️Please, support my work with like, thank you!❤️
I am part of Trade Nation's Influencer program and receive a monthly fee for using their TradingView charts in my analysis.
25.07.25 Morning ForecastPairs on Watch -
FX:USDJPY
CAPITALCOM:DE40
FX:GBPUSD
FX:AUDUSD
A short overview of the instruments I am looking at for today, multi-timeframe analysis down to what I will be looking at for an entry. Enjoy!

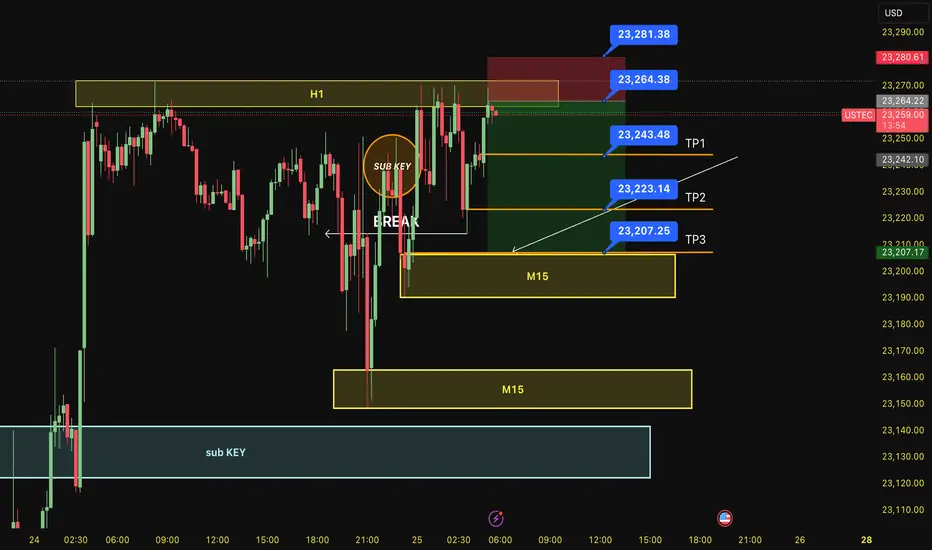
SELL USTEC 25.7.2025Reversal trade order: SELL at H1~M15 (all-time high - ATH)
Type of entry: Limit order
Reason:
- The price breakout the sub key of M15, confirming it will hit the main key M15.
- There is a key H1 support at the entry point.
Note:
- Management of money carefully at the price of bottom of M15 (23,343)
Set up entry:
- Entry sell at 23,264
- SL at 23,281
- TP1: 23,243
- TP2: 23,223
- TP3: 23,207
Trading Method: Price action (No indicator, only trend and candles)
GBPNZD: Bullish Move in a Channel 🇬🇧🇳🇿
I see a horizontal parallel channel on GBPNZD on a daily.
The price is currently testing its support.
On an hourly time frame, a cup & handle pattern was formed on that.
Its neckline was violated with the today's high impact news.
I think that the price may bounce at least to 2.246 level.
❤️Please, support my work with like, thank you!❤️
I am part of Trade Nation's Influencer program and receive a monthly fee for using their TradingView charts in my analysis.

24.07.25 Morning ForecastPairs on Watch -
FX:GBPCAD
FX:GBPUSD
FX:AUDNZD
A short overview of the instruments I am looking at for today, multi-timeframe analysis down to what I will be looking at for an entry. Enjoy!
