How to Stay One Step Ahead of the MarketHey Guys!
As traders, we always want the sense of being one step ahead of the market. In other words, what's happening with current price should not be of consequence to your trading. It's just another bit of information that's
added into your analysis of what will happen next. Now the polar opposite of this situation is chasing the market. Where a trader is reacting to what price is doing currently. After years of trading, one thing I can state with confidence, is that if you're chasing the market and reacting to current price, you won't make it in trading in the long-term. I mean, you may get lucky from time to time, but ultimately you're luck will run out. So the question becomes how does a trader stay one step ahead of the market? At the basic level, if a trader can stop focusing on price "direction", and instead begin focusing how price travels from point A to B, they have a shot at being one step ahead of the market. Let me explain.
As you guys know, on the Eur/Jpy pair during the month of February 2022, I was consistently taking short trades as price pulled back to the 132.80 levels. Now this is even if price at the moment of entry was moving up. ( I wasn't focusing on price direction) Instead, I was focusing on "how" price moved from point A(on the chart) to point B.(on the chart) Initially, there was 1 minute strong long strength sparking the explosive move up however, there was even stronger 1h strong short strength confirmed on the lower time frames in the beginning of the 1st range. At this point I was already viewing this pair to be short biased,(I was one step ahead of the market) and even if price continued up, as long as there was no confirmation of further long strength I will continue entering short positions. I was able to confidently take multiple short entries because "how" price was moving from point A to point B was not indicative of a long market. Or like I always say, " The lower time frame's price action wasn't complimenting the higher time frames move up." Then finally, there was further 5 minute confirmation of strong short strength and price began its descent. However, if a trader at this point was basing their trades on "current price direction", they're likely to take long positions on this pullback for a possible next move up. A devasting outcome as you can see.
So if you always find yourself on the wrong side of the market, firstly, stop putting value onto current price direction. It is just a result of previous price action. Begin asking yourself, "What is the context of the current price direction".
Or even better, learn how to read price to know how price traveled from point A to point B and begin staying one step ahead market. For if you a can do this, perhaps you will have a shot at staying in this game for the long haul.
I'm sure you guys have questions! Don't hesitate to ask! I'll gladly help!
Have a great day guys!
Ken
Priceactiontrading

GBPCAD: Key Weekly Structure Ahead 🇬🇧🇨🇦
Hey traders,
GBPCAD is very close to 2 years' low.
With a high probability, we will see a pullback from that structure.
To catch it with a confirmation watch a falling parallel channel on 4H time frame.
Let the price reach the underlined potential reversal zone first
and then wait for a 4H candle close above its resistance.
Then a bullish continuation will be expected to 1.6775 / 1.6915
In case of a bearish breakout of the underlined weekly structure,
the market will drop lower most likely.
❤️Please, support this idea with like and comment!❤️

GBPNZD: Classic Trend-Following Setup Explained 🇬🇧🇳🇿
Hey traders,
From the beginning of February, GBPNZD is trading in a bearish trend on a daily
The pair recently broke a strong horizontal key level, now we see its retest.
On a 4H time frame, the price formed a double top formation.
1.924 - 1.926 is its neckline.
We need a 4H candle close below the neckline to confirm a coming bearish move.
Initial target will be 1.906
If the price sets a new higher high on 4H the setup will be invalid.
❤️Please, support this idea with like and comment!❤️

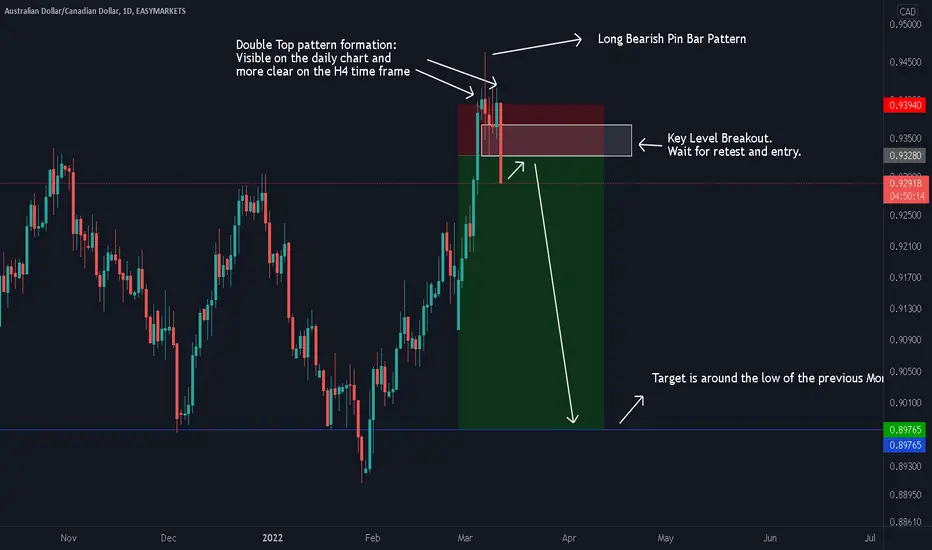
AUDCAD SHORT As we can see with the pair, price has been moving in a bullish direction for several day. The current price behaviour seems to suggest that we might be in for a short term
bearish correction. Price is showing signs of exhaustion shown by a potential break of market structure which further suggestion a change from a bull to a bear market in the
short term. By looking at the Daily chart we can see a double top pattern formation and when we drop down H4 chart, this pattern becomes much more clearer. We can also
see a long bearish pin bar pattern which formed around the high of the current month. With that be said, we will be waiting for price to breakout and close below our key level
as confirmation of the trade setup .Once this breakout occurs we will than wait for the retest of this key level before looking for any entries. Our target area is located around
the low of the previous month of Feb. The potential risk reward for this particular trade currently stands at around 5.33 to 1. We plan to hold this until target is reach or until
price behaviour suggest otherwise and close the trade manually as per our trading plan.
AUDUSD SHORTList of confluences:
1: Double Top/ M Pattern at high.
2: Bearish engulfing candle stick pattern
3: Key Level Breakout
Risk reward for this trade is a around: 3.62:1

Learn Trend Analysis | Impulse & Retracement Legs 📈
Hey traders,
As you asked me, in this educational post we will discuss some price action basics.
No matter whether you are a fundamental trader or a technical trader you should be able to execute trend analysis.
You should always know where the market is going; if it is bullish or bearish.
One of the simplest ways to execute trend analysis is to perceive a price chart as a sequence of impulses and retracements.
➖The impulse leg is a trend-following move.
It is characterized by heightened movement dynamics and speed.
Usually the completion point of the impulse:
sets a new lower low in a bearish trend,
sets a new higher high in a bullish trend.
➖A retracement leg is a correctional movement within the trend.
Its’ initial point is the completion point of the impulse or retracement leg and
its completion point might be an initial point of a new retracement leg or of a new impulse leg.
Usually, a retracement leg is characterized by a slow zig-zag movement.
Usually the completion point of the impulse leg:
sets a lower high in a bearish trend,
sets a higher low in a bullish trend.
Perceiving the price chart as the set of impulses, one can easily and objectively identify a global, mid-term and short-term market trend, price action trend-following, reversal and correctional patterns.
What do you want to learn in the next educational articles?
❤️Please, support this idea with like and comment!❤️

EURGBP Potential Bearish Reversal, SHORT!The pair has been in an uptrend for a while but as we can see we have recently broke structure to the downside showing that bears are stepping in. In this week i will be looking for a short-term selling opportunity around 0.83838

EURAUD GOING DOWN ?Already seen the price action just wait for bearish engulfing before entering this trade :)

EURAUD GOING DOWN ? Already seen the price action just wait for bearish engulfing on the zone before entering this trade :)

EUR/USD could dive to 1.0350, the 2017 low“We see the EUR weakening to the 1.06 level in the coming weeks, while a ramp-up in Russian aggression and signs of depressed growth in the bloc (possibly a recession ahead) could see the EUR aim for the ~1.0350 low of early-2017.”

Ideas for EUR USDLooking to short, but will need to wait for a 4H close below the level to ensure that we can continue with the selling.

Trading Price Action in Volatile TimesHey Guys!
The world markets are on a wild ride at the moment. With urgent news being released by the day. Traders around the world are trying to guess the next fundamental news to be released and further guess how the markets will react.
The world markets become a huge guessing game arena.... Now, that's fine if that's your cup of tea. The adrenaline rush or even the pure intellectual rush one gets from contemplation(speculation) is exceedingly addictive.
For me however, what happens in the world really is not of consequence to how I trade. Price action trading reads price and simply acts on its messages on a day to day basis. Whether the markets are in the wild west, or if it's peaceful like a calm lake. It's all the same.
Some say that the world of business is all about people. If you understand people, you'll do fine. In trading, its all about price. If you understand how to read price , you'll do fine.
Trading Price Action takes away the stress that comes from a turbulent and constantly changing world by exponentially diminishing the "guessing" aspect of trading. To me, that's a huge merit in terms of my quality of life.
Just a thought! Have a great day guys!
Ken

EURUSD: Classic Trend-Following Trading Setup 🇪🇺🇺🇸
Hey traders,
As you know I am very bearish biased on EURUSD.
I was patiently waiting for a retest of a recently broken key structure.
Yesterday the price finally approached that.
On hourly time frame, the pair formed a double top formation and then broke its neckline.
Now I have my sell limit order on a retest.
Bearish trend continuation is expected.
Local goals:
1.0945
1.086
❤️Please, support this idea with like and comment!❤️

How to Find Legitimate Head and Shoulder PatternsHey Guys!
I just wanted to post a quick tutorial on how to find legitimate Head and Shoulder patterns.
In this lesson, I explain the 5 rules that a Head and Shoulders pattern must abide for it to be legitimate.
Here's the rules:
#1 Both necklines must be parallel.
#2 The main neckline cannot be broken out of surpassed before the right shoulder's price level is reached.
#3 The Head and Shoulders must be relatively flat.
#4 The top neckline can only be adjusted to a wick between the main pivot and the last correlating major pivot.
#5 The prior trend must be in the opposing direction. (which is up in the case of a "short" Head and Shoulders Pattern )
That's it! I hope this helps!
Have a great day!
Ken

NZDUSD: Time to Grow? 🇳🇿🇺🇸
Hey traders,
NZDUSD is taking off from strong structure support.
The price formed an inverted h&s pattern on a 4h time frame
and just broke and closed above its horizontal neckline.
I expect a bullish continuation to
0.6918
0.697
❤️Please, support this idea with like and comment!❤️

EURJPY: Reversal Pattern to Watch🇪🇺🇯🇵
Hey traders,
EURJPY dropped to key weekly structure support.
On that, the price formed an inverted head and shoulders pattern on hourly time frame.
To buy the market with a confirmation you need a bull breakout of its neckline.
125.55 - 125.95 is the zone that must be broken.
Then buy aggressively or on a retest with the goal 126.9
❤️Please, support this idea with like and comment!❤️

NZDUSD: Classic Range Trading 🇳🇿🇺🇸
NZDUSD is stuck within a horizontal trading range.
Approaching its support the price formed a tiny double bottom formation and broke its neckline.
I expect a bullish move to 0.684
❤️Please, support this idea with like and comment!❤️

Mandatory Price PatternsHey Guys!
When it comes to price patterns, there are many. I mean, look up "price patterns for trading" on google and you'll find countless variations. Just like in the movie "A Beautiful Mind", where Russel Crowe's character locates patterns in Russian Codes; a price action trader, can find endless variations of patterns on their charts.
However, these variations actually deter the trader from their sole purpose of trading. Which is to make money. Period.
With so many patterns multiplied by the different time frames that a trader utilizes in their trading, it is bound that there will always be multiple price patterns on the chart at any given time. What does that do? It confuses the heck out of the trader.
That said, price patterns are a foundational element of price action trading, and is necessary to trade at higher levels. But it is not the amount of patterns that a price action trader must master. If the price action trader can master the Double Top/Bottom, and the Head and Shoulders patterns at the initial level. Out of my experience, these 2 patterns alone are more than enough to extract consistent profits from the markets.
Simply put, it's about quality over quantity.
That's it! Hope this provided some insight into price patterns!
Have a great day!
Ken

GBPJPY ShortThe Pound has been showing some serious weakness for weeks now coupled with the ongoing crisis, investors tend to put their money in safer places like the Yen. So, I will still be expecting bearish prices on GJ but I will wait for a pullback for safer entries. That being said, the market can go wherever it pleases but let's watch and see what happens.

AUDUSD: Potential Pullback Trade Explained 🇦🇺🇺🇸
AUDUSD is approaching a strong structure resistance.
On that the price formed a double top formation.
To catch a pullback you should wait for a bearish breakout of its neckline.
You need an hourly candle close below 0.723 - 0.725 area.
Then shorting on a retest your goals will be 0.7185 / 0.7145
If the price sets a new high, the setup will be invalid.
❤️Please, support this idea with like and comment!❤️

AUDJPY LONG SETUPEntry if the price didnt touch the quasimodo first
wait for pullback to the strong demand
RR 1:2.5
keep your risk management strict
priceaction

Gold May not stop before $1975.Gold is on fire and aiming to test its near-term swing high zone of $1970/1975.
Gold's near-term support 1930/1932. As long as above $1930, it is possible to test the $1970/1975 price zone. Fundamental, technical, and market sentiment still suggests more upside bias.
But we may see some correction at the $1970/1975 price zone.
On the other hand, if xau/usd breaks below the $1930, it may test its another trendline support level of $1900/1910 price zone.
I remain bullish on gold-based of all three types of analysis. But of course, remember profit-taking factors and overbought conditions of gold.
