XAUUSD Bearish Setup! OB Rejection + FVG + 61.8% Fib PremiumGold (XAUUSD) | 4H Chart – High-Probability Bearish Setup
XAUUSD is setting up for a bearish move as price taps into a premium zone confluence, including an Order Block (OB), Fair Value Gap (FVG), and a 61.8% Fibonacci retracement. Smart Money Concepts (SMC) traders will recognize this setup as a textbook scenario for a bearish continuation toward a Weak Low target.
🔍 SMC Breakdown:
Market Structure:
The market has shifted bearish after breaking the previous low and forming a lower high. The internal structure confirms bearish order flow, giving us confidence in continuation to the downside.
Liquidity & Inefficiency Play:
Recent sweep of buy-side liquidity above minor highs.
Rejection at premium pricing indicates Smart Money has triggered sell programs.
Internal liquidity pools were engineered and swept, confirming manipulation.
Entry Confluence Zone (Kill Zone):
🔴 Order Block (OB):
3,372 – 3,380 — bearish OB formed before strong impulse move.
🟣 Fair Value Gap (FVG):
Perfect overlap with the OB, leaving a gap that price has now rebalanced into.
📐 Fibonacci Levels from Swing Low to High:
61.8% = 3,373
70.5% = 3,377
79% = 3,380
This entire zone aligns with institutional premium pricing — the high-probability reversal range.
📉 Bearish Projection:
Expecting price to reject from OB/FVG zone and move toward the discount zone, targeting unmitigated lows and imbalance fills.
Key Downside Targets:
50% = 3,368
Full Extension = 3,333 (Aligned with Weak Low)
This level also sits near the 0.00% Fib level — a clean liquidity magnet.
🧠 Chart Ninja Entry Plan:
🔹 Entry: 3,373 – 3,380 (OB + FVG + Fib Premium)
🔻 Stop Loss: Above 3,381 (invalidate OB)
📉 Take Profit: 3,333 (Weak Low + Fib Completion)
⚖ RRR: ~1:4+ — high-confluence sniper setup
💬 Ninja Wisdom:
You're not trading random candles — you're trading intentional liquidity shifts.
This setup screams Smart Money footprint: OB rejection + inefficiency fill + premium pricing.
Be the sniper — not the trigger-happy retail trader. 🥷🎯
📍 Save this setup before it plays out — backtest and learn from it!
🔁 Drop your analysis below – agree or see it differently?
👣 Follow @ChartNinjas88 for daily institutional-grade setups on Gold & more!
Priceactiontrading

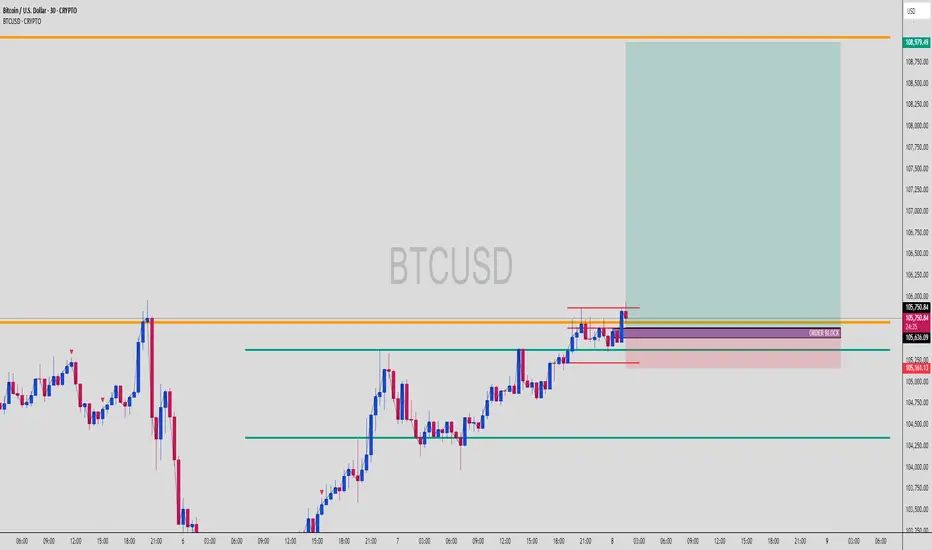
BTC Short Setup! OB + Fair Value Gap + Trend Channel ConfluenceBitcoin (BTCUSD) | 30-Min Chart – High Probability Sell Setup
Bitcoin continues to respect bearish structure inside a descending trend channel, creating prime opportunities for Smart Money traders to strike at optimal levels.
🔍 Trade Breakdown:
Bearish Market Structure
Price is forming lower highs and lower lows
Channel structure is being respected with multiple taps on both the upper and lower bounds
Liquidity Sweeps & Internal Range
Multiple yellow-highlighted zones show liquidity engineering — both buy-side and sell-side have been swept
Recent sweep + demand failure confirms bearish intent
Premium Entry Zone Setup:
🔴 Order Block Zone (OB): 105,200 – 105,400
🟣 Fair Value Gap (FVG): Overlapping with OB – perfect imbalance correction
📐 Fib Levels:
61.8% = 104,987
70.5% = 105,298
79% = 105,388
🔺 This is the kill zone — premium retracement + inefficiency fill = high confluence
Bearish Continuation Expectation:
BTC likely to react at OB zone and continue bearish leg
Projection into discount fib levels:
-27% = 104,000
-62% = 103,800
-100% = 103,727
Channel Respect = Structure Confidence:
Every key swing is aligning with channel resistance/support
Blue arrow shows expected path: liquidity sweep ➝ OB/FVG tap ➝ drop to channel low
🧠 Chart Ninja Entry Plan:
🔹 Entry Zone 105,280 – 105,388 (OB + FVG + 70.5–79% Fib)
🔻 SL Above 105,400 (above OB)
📉 Target 103,727 (channel + -100% Fib extension)
⚖️ RRR Over 1:4 — sniper-grade RR setup
💬 Ninja Wisdom:
You're not chasing moves — you're waiting where liquidity pools.
Fair Value Gaps + OB + Trend Channels = institutional signature.
Trade like Smart Money. Let retail chase candles. 🥷💸
📍 Save this setup before the market plays out
🔁 Share your thoughts below – entry, TP, SL?
👣 Follow @ChartNinjas88 for more sniper BTC setups daily

BTC Long Triggered from OB, Smart Money Played This Perfectly!BTCUSD | 30-Min Chart – Long Setup Execution
Bitcoin has just activated a clean long entry from a well-defined bullish Order Block at a key structural level. This move follows textbook Smart Money Concepts (SMC) — the kind of play institutional traders thrive on.
🔍 Setup Breakdown:
🔹 Order Block (OB):
Identified near 105,636 — aligned with previous support
Precise reaction zone after consolidation, showing institutional interest
OB respected after fakeout below short-term liquidity
🔸 Liquidity Sweep:
Quick wick below 105,250 acted as a stop hunt for early shorts
Price reclaimed the OB immediately after → classic Smart Money trap
🟩 Entry Zone (OB Zone):
105,636–105,250 range
Confluence with minor bullish imbalance and structure support
Price barely tapped the zone before launching higher
📈 Upside Target:
TP marked at 108,979 — prior liquidity pocket and untested highs
Large green zone shows ideal RR (approx. 1:6)
First obstacle: minor resistance at 106,750, but momentum looks strong
🟥 SL Placement:
Safely below OB at ~105,161
Below liquidity sweep zone = strong invalidation
🧠 Why This Setup Works:
✔ Price moved impulsively into the OB
✔ OB lines up with previous structure support
✔ Rejection + strong bullish candle = confirmation
✔ No significant resistance until higher liquidity zones (108K+)
This is classic SMC execution: trap, sweep, OB tap, and send. Let retail panic — we follow footprints.
💬 Ninja Wisdom:
"Smart Money doesn’t chase price — it traps and collects."
This was a clean confirmation of a bullish continuation after reclaiming control from liquidity grabs.
📍 Save this chart – this setup could explode into a full bullish swing
💬 Drop your thoughts: Are we headed to 109K or pausing at resistance?
👣 Follow @ChartNinjas88 for more sniper-level BTC/ETH/Gold plays
06.06.25 Morning ForecastPairs on Watch -
FX:EURUSD
FX:AUDUSD
FX:USDJPY
FX:AUDCAD
A short overview of the instruments I am looking at for today, multi-timeframe analysis down to what I will be looking at for an entry. Enjoy!

05.06.25 Morning ForecastPairs on Watch -
FX:AUDUSD
OANDA:XPTUSD
A short overview of the instruments I am looking at for today, multi-timeframe analysis down to what I will be looking at for an entry. Enjoy!

04.06.25 Morning ForecastPairs on Watch -
FX:EURUSD
FX:USDJPY
FX:GBPCHF
OANDA:XPTUSD
A short overview of the instruments I am looking at for today, multi-timeframe analysis down to what I will be looking at for an entry. Enjoy!

BTCUSD Bear Trap Loading – Premium OB Sell Setup ActivatedBTCUSD | 1H Smart Money Rejection Play – Premium Repricing Before Breakdown
The king of crypto is looking shaky. Smart money isn’t buying the pump. Here’s why BTCUSD might be gearing up for a steep dump from a premium order block reaction 🩸👇
📌 1. Market Context:
After a clean bearish leg, BTCUSD is now retracing into a premium zone — above the 70.5% Fib
Price is climbing into a high-probability reversal OB (highlighted in purple/red)
This area aligns with the 70.5%–79% golden retracement zone — where institutions love to load shorts 🧠📉
💎 2. Key Levels to Watch:
🔺 Premium OB Zone (Sell Zone): 108,378.95 – 109,276.15
🟣 Golden Rejection Zone: Fib 70.5% – 79%
🔽 Target Weak Low: 103,121.59
⛔ Invalidation/SL Above: 109,276.15
🎯 RR Potential: 1:4+ sniper-grade
Price is expected to tap this premium zone, sweep liquidity, and collapse into the weak low for a full market cycle completion 🔁
🧠 3. Smart Money Flow:
This move smells like a liquidity grab trap – taking out late longs before a drop
No bullish BOS from HTF – market structure still bearish
OB overlaps with inefficiency (FVG), making it ripe for rejection
Strong high is intact — unbroken = more confluence for downside
🎯 4. Execution Strategy (Entry Tips):
⚔ Wait for:
M5–M15 shift in structure (BOS) from bullish to bearish inside the OB
Sharp rejection wick or engulfing candle for confirmation
Ideal entry = wick entry near 109.2 with tight SL just above OB
Target = weak low for full mitigation and profit harvesting
This is surgical precision territory. The sniper must be patient before pulling the trigger 🥷
🔥 5. Why This Short is GOLD:
✅ OB + Fib + FVG confluence = high-odds reversal zone
✅ Price is in premium – not discount = perfect for shorts
✅ Weak low = magnet
✅ No bullish confirmation = no reason to long
This is not a guess — this is the blueprint for institutional execution 📐
📉 Drop “BTC Dump Mode 🚨” in the comments if you’re watching this setup too
🔁 Save this setup for your playbook
⚔ Follow @ChartNinjas88 for more institutional-level trade ideas like this one

03.06.25 AUDUSD Trade Recap (Breakeven Manual Close)A long position taken on AUDUSD for a breakeven manual close, full explanation as to why I made this decision in the recap and my current thoughts on this pairs next move

03.06.25 Morning ForecastPairs on Watch -
FX:EURUSD
FX:GBPAUD
FX:AUDUSD
FX:AUDCAD
A short overview of the instruments I am looking at for today, multi-timeframe analysis down to what I will be looking at for an entry. Enjoy!

02.06.25 Morning ForecastPairs on Watch -
FX:AUDUSD
FX:USDJPY
FX:EURGBP
A short overview of the instruments I am looking at for today, multi-timeframe analysis down to what I will be looking at for an entry. Enjoy!

AUDUSD BULLISH RUNAUDUSD is expected to buy to complete the Deep crab pattern. With higher than expected CPI figures AUD is expected to bully the green-back which is struggling with low interest rate figures as a result of declining inflation figures nearing its 2024 inflation target of 2% and global trade wars.
expecting AUDUSD to hit around0.66000 psychological level

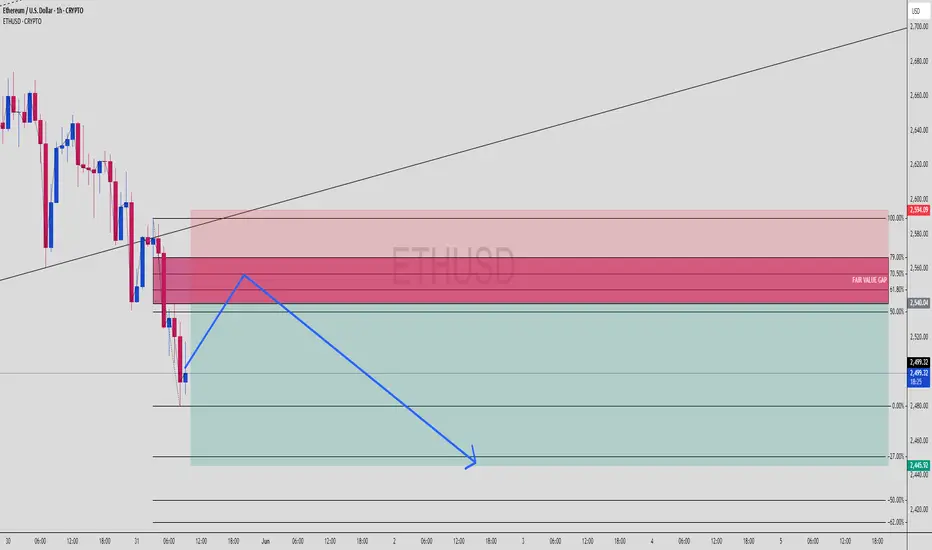
ETHUSD Bearish FVG Play | Premium Rejection Loading?Ethereum (ETHUSD) 1H Smart Money Bearish Setup | FVG + Fib Confluence
Textbook short scenario lining up on ETHUSD as it retraces into a premium zone filled with imbalance. Let’s unpack the key ingredients of this setup for the squad.
🔍 1. Trade Idea Summary
Price dumped sharply, leaving a clean Fair Value Gap
Retracement into premium (Fib 61.8%–79%) zone
Confluence of:
✅ FVG Supply
✅ Fib retracement zone
✅ Internal structure breaker
Targeting sell-side liquidity near 2,445 for a smooth RR 1:3+ setup.
📊 2. Key Zones on Chart
Entry Zone: 2,540 – 2,590 (FVG + 61.8%–79% Fib)
Strong High for Sweep (if needed): 2,594
TP Zone (Sell Side Liquidity): 2,445
SL: Above 2,600
🧩 3. Smart Money Concept Breakdown
Market made a lower low ➝ bias shifts bearish
Now retracing into the last up candle before the dump (FVG zone)
Expecting:
Premium rejection
Lower time frame CHoCH
Push to sell-side liquidity
⚙️ 4. Execution Plan
Let price enter FVG zone
Wait for M5 or M15 bearish break of structure
Confirm with:
OB rejection
Entry confirmation candle
Ride it down to TP or trail SL at midpoint
💡 5. Trader Tips:
Watch volume drop as price enters FVG — sign of weak buyers
Don’t force entry — let structure confirm
⚔️ Comment "ETH Breakdown 🔪" if you're eyeing this short
📈 Save this setup & follow @ChartNinjas88 for real-time sniper breakdowns
🎯 DM “TRADE” for access to my sniper SMC playbook
EURGBP Bullish Structure Analysis – Channel Breakout + Target🧱 1. Market Structure Breakdown
EURGBP has been trading within a descending channel, forming consistent lower highs and lower lows, which indicates a short-term bearish trend. However, price action recently broke out above the upper boundary of this channel, suggesting a potential bullish reversal or trend correction.
This breakout marks a significant structural shift in market behavior.
🔵 Old Structure: Bearish, confined within the channel
🟢 New Structure: Bullish breakout above trendline + key resistance zone
🧩 Implication: Change in directional bias; potential for long opportunities
📍 2. Breakout Confirmation
The breakout was confirmed by:
A strong bullish impulse candle that closed above the descending trendline
Price sustaining above previous resistance (~0.8405)
Increase in bullish volume at the breakout point (if volume indicator is used)
This suggests that the breakout is genuine, not a false spike or liquidity grab.
🌀 3. Retest Phase – The Critical Zone
After breaking out, the market is now pulling back to retest the previous structure. This is a textbook price action move:
🔄 What’s Being Retested?
✅ Upper boundary of the descending channel
✅ Major horizontal support/resistance zone (~0.8405–0.8415)
✅ Broken trendline from previous lower highs
✅ QFL base (Quasimodo level that was swept)
✅ 50% Fibonacci retracement of the breakout move
This zone forms a multi-level confluence area, making it a strong support for potential long entries.
🔍 4. Key Technical Observations
Element Description
📐 Descending Channel Defined the prior bearish structure. Breakout invalidates this bias.
🧱 Trendline Retest Acts as dynamic support; price currently sitting on it.
🔃 SR Flip Zone Old resistance (~0.8405) turned into support—critical level.
📊 Fib 50% Retracement Provides technical alignment with potential buying interest.
📌 QFL/Order Block Zone Historical demand was swept and now being respected again.
🎯 5. Target Levels & Trade Plan
If the structure holds and the price responds bullishly from the current zone, the next levels of interest are:
✅ Primary Target – 0.8460
A clear supply/liquidity zone from previous structure highs
Also aligns with psychological round number and Fib extension
⚠️ Interim Target – 0.8430
Previous intra-channel resistance level
May serve as a short-term reaction point
❌ Invalidation Level
A clean break and close below 0.8390 would invalidate the breakout structure
This would reintroduce bearish pressure and signal a potential fakeout
🧠 6. Trade Idea (Not Financial Advice)
Entry: Around 0.8405–0.8415 on bullish confirmation (e.g., engulfing candle, pin bar, break of minor downtrend)
Stop-Loss: Below 0.8390 (beneath structure & invalidation point)
Take-Profit 1: 0.8430
Take-Profit 2: 0.8460
This offers a high R:R opportunity if managed with proper confirmation.
🧭 7. Risk Management & Considerations
Avoid entering prematurely without a bullish signal (e.g., pin bar, engulfing, RSI divergence).
Monitor macroeconomic news—especially from BoE or ECB—as they can disrupt technical setups.
Scaling into the position or using a split TP strategy can help protect profits.
✅ Conclusion
This EURGBP setup is a textbook case of market structure trading:
A well-defined channel breakout
Followed by a clean pullback to structure
With confluence across horizontal, diagonal, and Fibonacci levels
If price respects this zone, bulls could drive toward 0.8460, offering a solid opportunity for traders who understand structure-based setups.
📌 Always wait for confirmation—structure gives us context, but entries need price action signals to minimize risk.

EURJPY SHORTwith safe haven assets expected to be bullish, i expect JPY to be strong against risk on currency like euro. EURJPY is expected to fall to complete a triange formation in the coming weeks before the bullish impulsive leg.

29.05.25 Morning ForecastPairs on Watch -
FX:AUDCAD
FX:EURUSD
TVC:USOIL
FX:GBPJPY
A short overview of the instruments I am looking at for today, multi-timeframe analysis down to what I will be looking at for an entry. Enjoy!

28.05.25 Morning ForecastPairs on Watch -
OANDA:AU200AUD
FX:GBPAUD
A short overview of the instruments I am looking at for today, multi-timeframe analysis down to what I will be looking at for an entry. Enjoy!

27.05.25 Morning ForecastPairs on Watch -
FOREXCOM:COFFEE
FX:GBPAUD
A short overview of the instruments I am looking at for today, multi-timeframe analysis down to what I will be looking at for an entry. Enjoy!

26.05.25 Morning ForecastPairs on Watch -
FOREXCOM:COFFEE
FX:GBPAUD
FX:EURAUD
A short overview of the instruments I am looking at for today, multi-timeframe analysis down to what I will be looking at for an entry. Enjoy!

"GBPUSD Ready for the Kill After Premium Zone Reaction!"⚡ GBPUSD Analysis - 1H Timeframe | April 28, 2025
📈 What's Happening:
GBPUSD just tapped deep into the Premium Zone while simultaneously reacting off a clean Fair Value Gap (FVG).
Signs of bearish rejection are stacking up — Smart Money might be preparing for the kill shot! 🎯
🚨 Key Levels Highlighted:
Strong High = Major invalidation (~1.34317).
Premium Zone = Where sellers ideally step in.
Fair Value Gap (FVG) = Where price imbalance triggered a reaction.
Weak Low = Major liquidity target (~1.32036).
🧠 Key Observations:
Price filled the FVG and immediately showed a reaction = sign of Smart Money stepping in.
Strong High untouched = still valid for bearish play.
Weak Low + Sell Side Liquidity = magnets below.
🎯 2-SCENARIO PLAN:
Plan A — Short Setup (Primary Bias):
✅ Look for bearish confirmation via M15 or M5 structure shift.
✅ Ideal entry around Premium/FVG zone.
✅ TP1 = Minor structure lows around 1.33000. TP2 = Full Weak Low sweep (~1.32036).
✅ SL = Above Strong High (~1.34317).
Plan B — Invalidated if:
✅ Strong High is broken impulsively = setup failed. No chasing!
📊 Risk Management Tip:
"Fair Value Gap reactions inside Premium = sniper-level setups. Focus on confirmations, not assumptions."
🧘♂️ Summary:
✅ Premium Tap ✅ FVG Fill ✅ Bearish Reaction ✅ Weak Low Target
Patience = Power.
This could be the sniper setup you've been waiting for! 🔥
➡️ Save this playbook.
➡️ Comment "SNIPE THE GAP" if you're setting the trap! 🎯

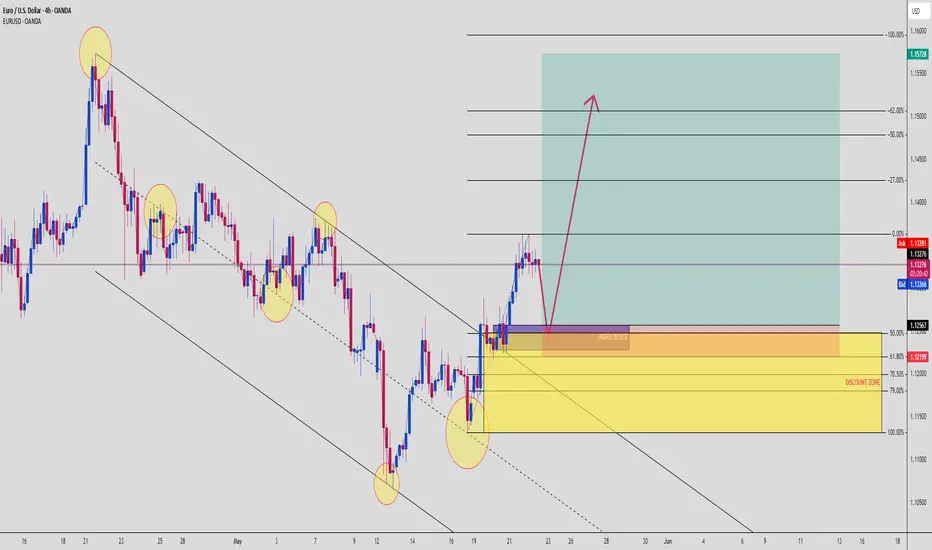
EURUSD Bounce Incoming? Smart Money Reversal BrewingThis EURUSD setup is a case study in smart money accumulation after a liquidity sweep + channel break. Price action is aligning like clockwork for a long setup, and the confluences are hard to ignore.
🧠 Breakdown:
🔻 Bearish Channel Structure: Market has respected this descending channel since early May — multiple taps, respected diagonals
🟡 Reversal Clues: Clean sweep of liquidity at the channel bottom with bullish engulfing candle
💰 Order Block + Discount Zone:
OB marked inside the 50%–79% retracement range
🔹 OB top: ~1.12567
🔹 Key entry: Between 1.12567 – 1.12199
🔹 SL: Below 1.1180 (clean under discount zone)
📈 TP zone: 1.15728 — previous market structure high and fib -100% level
✅ Risk-Reward: 1:5+ if played with precision
🔍 Why this setup is 🔥:
✅ Channel break = structure shift
✅ OB + Fib 61.8%–79% = strong demand confluence
✅ Liquidity below equal lows already taken
✅ Sharp bullish move after sweep = signs of big players entering
✅ Price likely to pull back to mitigate before exploding
🧠 Institutional Logic:
“Liquidity fuels price. Structure guides it. Confluence confirms it.”
The market swept lows, flipped structure, and now is likely returning to fill orders before the next leg up. This is a classic bullish mitigation play.
📊 If price taps into the OB and shows bullish confirmation — this is a sniper zone.
Set alerts. Wait for the wick. Enter on the flip. Let the market work for you, not the other way around.
23.05.25 Morning ForecastPairs on Watch -
FX:CADJPY
FX:AUDCAD
A short overview of the instruments I am looking at for today, multi-timeframe analysis down to what I will be looking at for an entry. Enjoy!

22.05.25 Morning ForecastPairs on Watch -
FX:EURUSD
FX:EURGBP
FX:GBPJPY
A short overview of the instruments I am looking at for today, multi-timeframe analysis down to what I will be looking at for an entry. Enjoy!

EURUSD | Bullish Pennant Breakout – Retest Before the Target📊 EUR/USD (1H Timeframe)
The EUR/USD pair has shown a textbook example of a bullish pennant formation, which typically occurs during strong uptrends and signals a continuation of the bullish momentum. The price had an impulsive rally prior to the formation of the pennant, indicating a strong underlying bullish sentiment.
Following the rally, the market entered a period of consolidation where price action began to coil between two converging trendlines – this is the pennant structure, marked by lower highs and higher lows.
This tightening price action typically suggests that market participants are pausing to digest the previous move, often leading to another breakout in the same direction – in this case, bullish.
📐 Key Technical Elements Highlighted:
Bullish Pennant Formation:
Characterized by a sharp move up (flagpole) followed by a tight consolidation range (the pennant).
Volume generally contracts during consolidation and expands on breakout, confirming momentum.
Breakout and Retest:
Price has broken above the upper resistance line of the pennant.
Now pulling back for a retest, a healthy technical behavior often seen in strong setups.
This pullback offers a second chance for entry for traders who missed the initial breakout.
Support & Resistance Zones:
SR Interchange Zone (previous resistance turned into potential support).
Minor Resistance Zone above, now likely invalidated by breakout.
These zones are critical in evaluating potential price reaction and risk control.
Projected Target:
Based on the measured move from the pole height of the pennant added to the breakout point, the projected target stands near 1.14315, a level of prior structural interest.
🎯 Trade Plan – Technical Strategy
⚠️ This is a hypothetical scenario for educational purposes. Always manage your risk.
Entry Zone: On confirmation of a successful retest (bullish price action at trendline support)
Stop Loss: Below the pennant’s lower trendline or the SR interchange zone (1.1245 – 1.1260 region)
Target: 1.14315 (based on breakout projection)
Risk-Reward Ratio: Approx. 1:2 to 1:3 depending on entry precision
🔍 Psychological & Market Structure Notes:
A bullish pennant is a sign of accumulation after a strong rally – it tells us that buyers are resting, not gone.
The retest shows institutional behavior: smart money often allows price to come back to a breakout level before driving it higher again, to shake out weak hands and trap late sellers.
Momentum traders and breakout traders often wait for confirmation on the retest to pile in with higher confidence.
📚 Educational Takeaway:
This setup serves as a great case study in:
Continuation patterns (Bullish Pennants)
Breakout-retest behavior
Measured move target projections
Trend confirmation techniques
Market psychology and structure
If you're learning technical analysis, this is a high-probability pattern that occurs across many asset classes including forex, crypto, and stocks.
