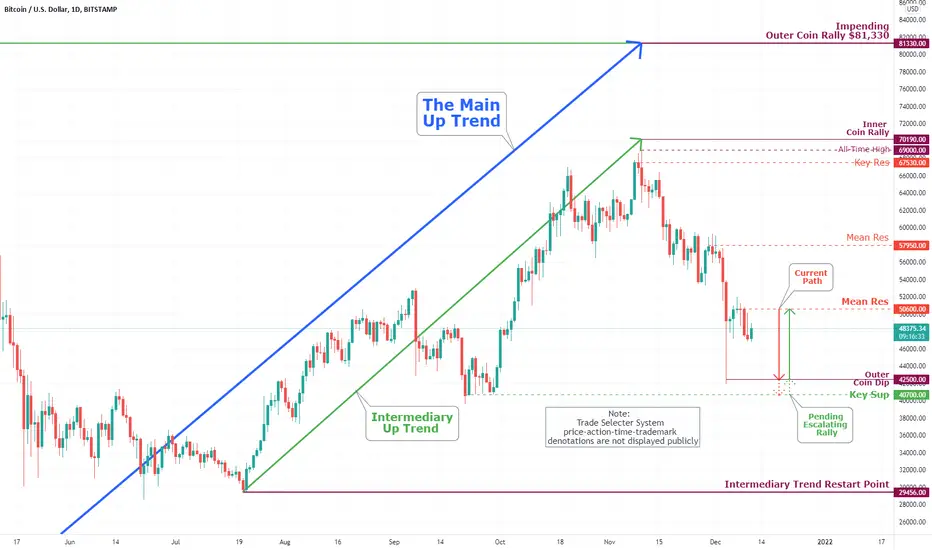
Bitcoin (BTC/USD) Daily Chart Analysis For December 18, 2021Technical Analysis and Outlook:
Thus, as a famous saying goes: ''Buy when there's blood in the streets''. Aggressive buy makes the grade at Outer Dip $42,500 and at Key Sup $40,700. The upside bias after it retests completed above prices is Mean Res $50,600, and beyond - stay tuned.
Priceanalysis

S&P 500 Daily Chart Analysis For December 17, 2021 Technical Analysis and Outlook
The continuous downtrend is pending by obsoletion of Mean Sup 4615; If confirmed, the Spooz is on its way to Outer Index Dip 4555 with the incentive of hitting Key Sup 4510. So, with go-between buying hit and run (Rapid fire trading) opportunities, there are unseen sup/res developments - Stay tuned.

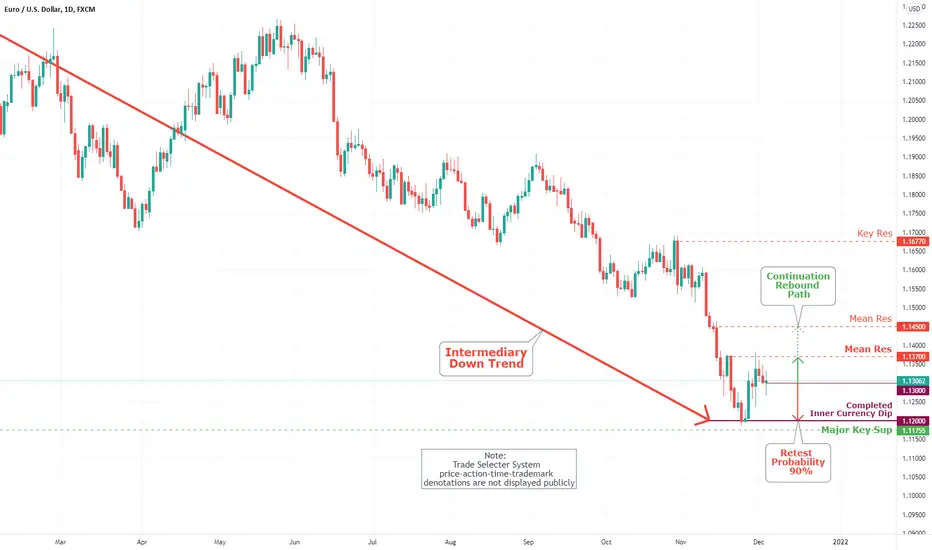
EUR/USD Daily Chart Analysis For December 17, 2021Technical Analysis and Outlook:
After three weeks of chopping and heading to our designated retest, the Euro Dollar found a foothold. Completed Inner Currency Dip and hitting hard the major Key Sup 1.1175. On the upside, the primary targets are Mean Res 1.1340, Mean Res 1.1370, and Outer Currency Rally 1.1410 outcome levels.

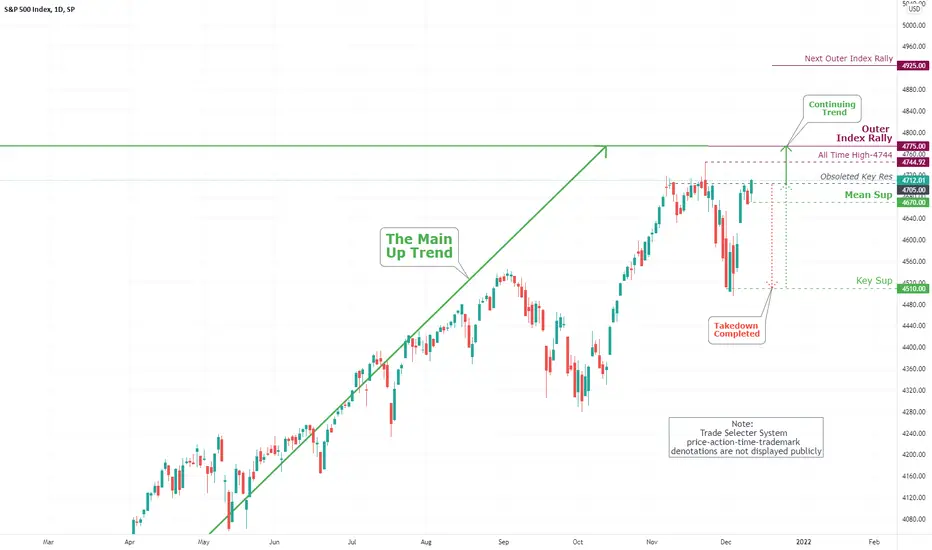
S&P 500 Daily Chart Analysis For December 11, 2021 Technical Analysis and Outlook
The Main Trend is currently reignited - with obsoletion of Key Res 4705; the Spooz is on its way to Outer Index Rally 4775 with the incentive of takeout all-time high 4744. The Mean Sup 4670 go-between buying opportunity.
Bitcoin (BTC/USD) Daily Chart Analysis For December 11, 2021Technical Analysis and Outlook:
The Bitcoin is trapped in a downtrend with no apparent upside bias until it retests our completed Outer Coin Dip of $45,500 and possibly hit the Key Sup $40,700. Mean Res lays at $50,600.
EUR/USD Daily Chart Analysis For December 11, 2021Technical Analysis and Outlook:
The Euro Dollar cannot find a foothold when bears and the bulls fight within the current consolidation pattern - Mean Sup 1.1265 and Mean Res 1.1370 levels.

EUR/USD Daily Chart Analysis For December 4, 2021Technical Analysis and Outlook:
We have substantial Inner Currency Dip 1.1200 completion (Validated with Trade Selecter System BARC). Hence, as stated on the November 27 chart analysis, a strong bounce transpired to Mean Res 1.1370. Consequently, the Euro is bound in a trading range between these price scales. A healthy run towards Major Key Sup is expected.
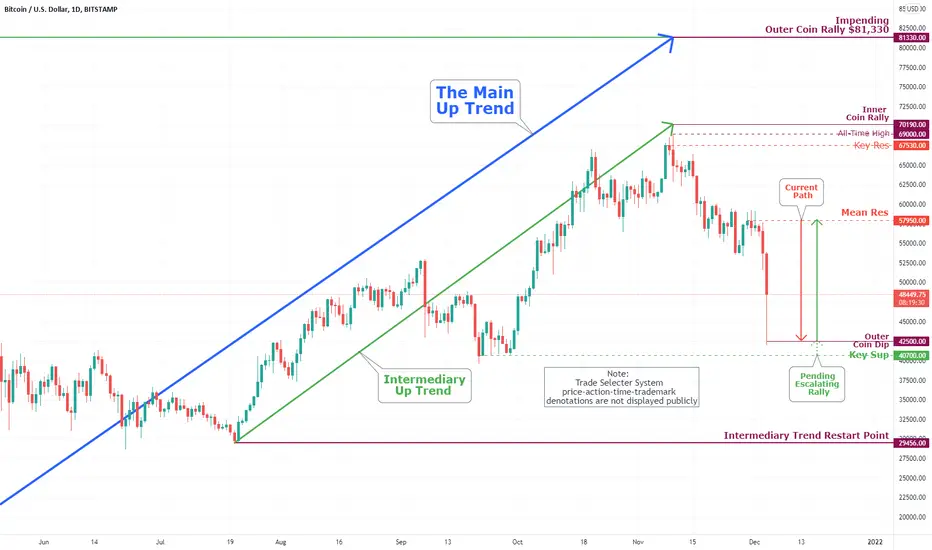
Bitcoin (BTC/USD) Daily Chart Analysis For December 4, 2021Technical Analysis and Outlook:
BANG! The bitcoin price has plummeted by around $15,000 over the 24 hours. As of 08:16 GMT today, it was trading at approximately $47,580, down 16.14%, having plummeted by 31.6% from this year's all-time high of $69,000, which it attained on November 10 this year.
We are looking at this significant bitcoin market pullback as a "breather" following reaching this low-level price. Notwithstanding, it is possible to see an escalating rally pending Outer Coin Dip 42,500 confirmation (Trade Selecter System BARC) and Key Sup $40,700, which is the potential leading platform (or sooner) for the considerable rebound.
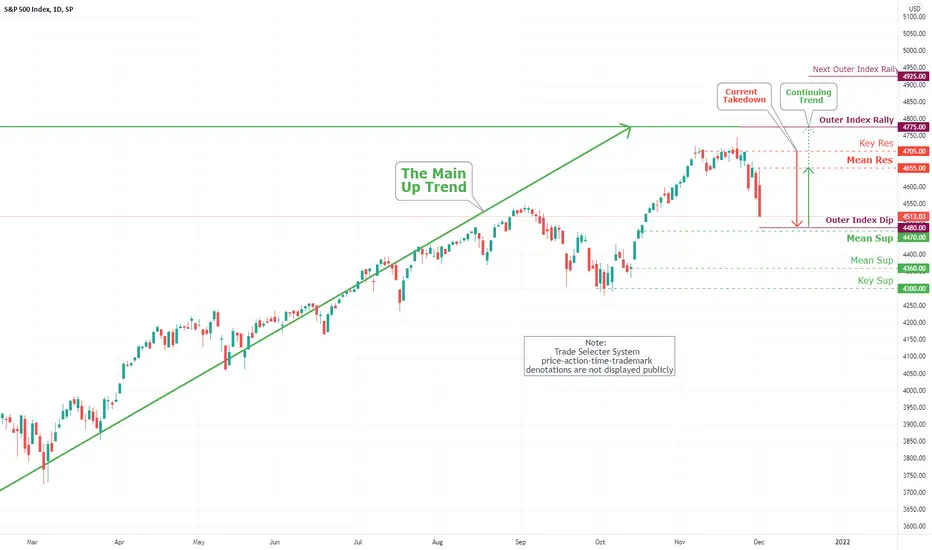
S&P 500 Daily Chart Analysis For December 2, 2021Technical Analysis and Outlook
The Main Trend is currently interrupted - the Outer Index Dip notes price outcome 4480 in progress with underlying Mean Sup 4470. However, once the dying market breaks down, be prepared for this mentally and with your wallet; otherwise, it will be a rough ride supporting two primary supports: Mean Sup 4360 and Key Sup 4300.
S&P 500 Daily Chart Analysis For November 28, 2021 Technical Analysis and Outlook
The present model shows solid Outer Index Dip completion marked at 4586. The next (moderate probability) destination is marked at Mean Sup 4545. Both Outer Index Dip completion and Mean Sup signify major
upside boost trend.

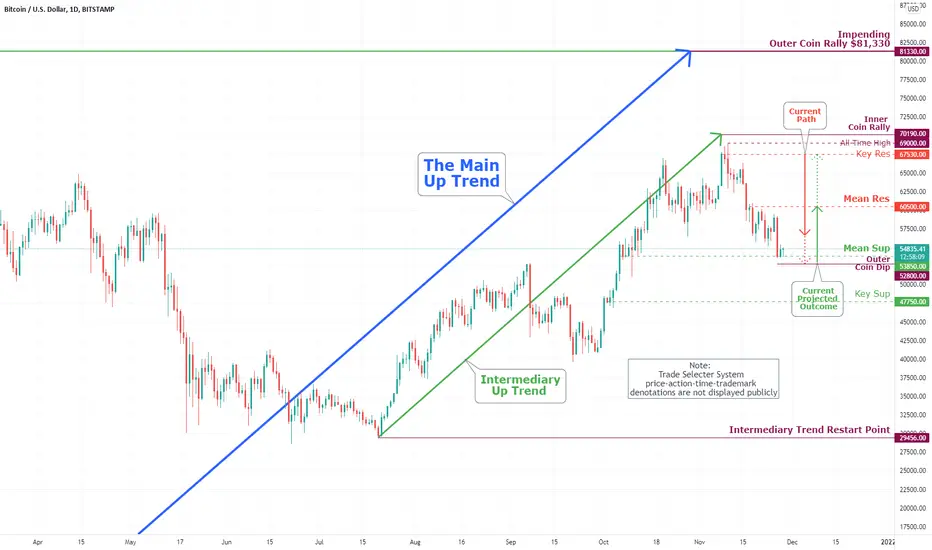
Bitcoin (BTC/USD) Daily Chart Analysis For November 28, 2021Technical Analysis and Outlook:
Bitcoin is currently resting at our Mean Sup $53,850 as we have a viable takedown awaiting to happen - Outer Coin Dip $52,800 target and remote probability - Key Sup $47,750. The upside move is anticipated to retest our Mean Res $60,500 with a vengeance.
EUR/USD Daily Chart Analysis For November 27, 2021Technical Analysis and Outlook:
When you view this price chart, you can observe that we had substantial completion, so it makes sense to experience a strong bounce eventually. Consequently, we may make a healthy run towards Mean Res 1.137 and possibly even the 1.145 level.

EGLD/USDTcoin = EGLD/USDT
buy zone = now price
sell at = 515
almost 9% profit
i am 90% confirmed our this signal was hit soon
target hitting time with in 1 day to 2 days
pls like my signal * -___- *

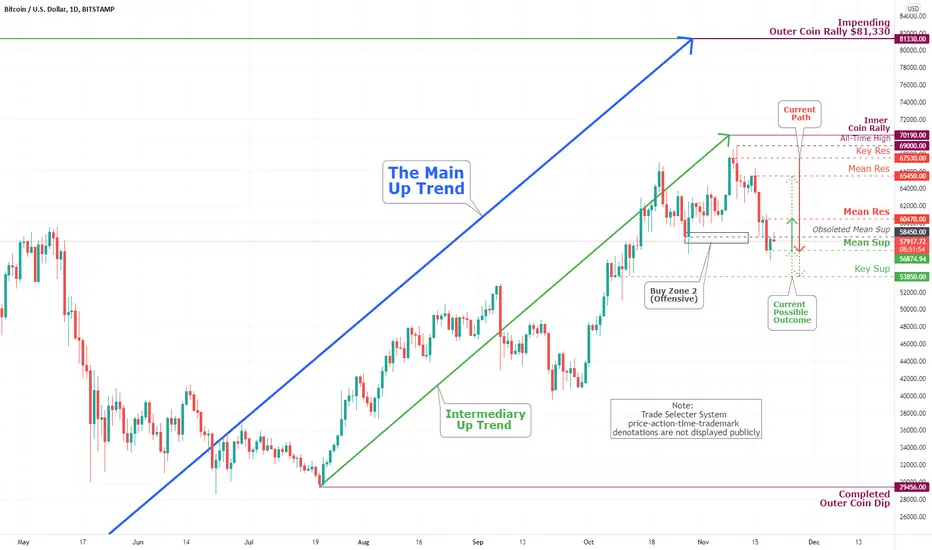
Bitcoin (BTC/USD) Daily Chart Analysis For November 20, 2021Technical Analysis and Outlook:
Bitcoin is currently resting at our Buy Zone 2 (Offensive) as we have a possible takedown to Key Sup $53,850 target. The upside move is anticipated to retest our Mean Res 60,470 and 65,450.
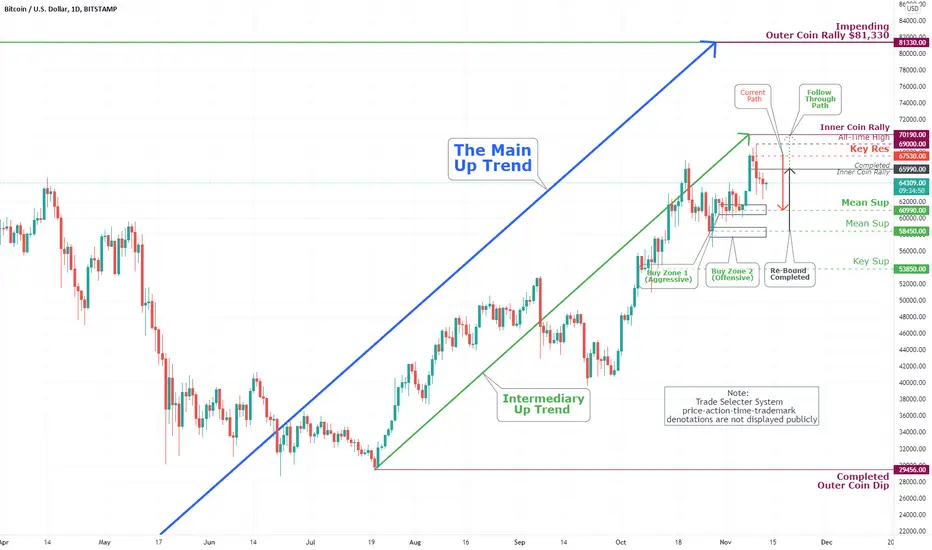
Bitcoin (BTC/USD) Daily Chart Analysis For November 13, 2021Technical Analysis and Outlook:
Bitcoin has completed our Inner Coin Rally 65,990, as we have newly developed Key Res 67,530 target to be revisited following takedown to Mean Sup 60,990, along with the Inner Coin Rally 70,190, and an all-time high of 69,000 marks.
EUR/USD Daily Chart Analysis For November 16, 2021Technical Analysis and Outlook:
The Euro is currently in completion mode with our Inner #2 Currency Dip 1.1407 and Inner #1 Currency Dip 1.1367. BARC (Trade Selecter System Proprietary Symbol) confirmation is required to initiate buying opportunity - intermediate downtrend halt. The aggressive (High-risk takers) may buy currently fluctuating prices around Inner #1 Currency Dip for short-term gains. Low-risk traders stand by.

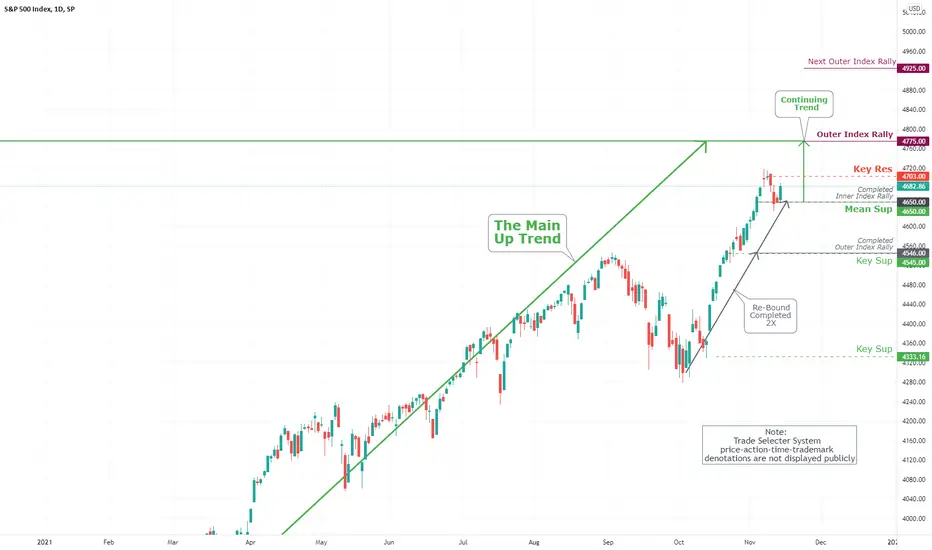
S&P 500 Daily Chart Analysis For November 13, 2021Technical Analysis and Outlook
The present model shows two rebound stages completed with a newly developed significant Key Res 4703. The next destination is marked at Outer Index Rally 4775. The Mean Sup 4650 signified a high-quality buying point.
EUR/USD Daily Chart Analysis For November 13, 2021Technical Analysis and Outlook:
The Euro Dollar, intermediate Stage 1, is completed at the Mean Res 1.1611 mark - On the downside, Stage 2 is in progress advancing to the Inner #2 Currency Dip 1.1407, while Inner #1 Currency Dip 1.1367 is resting below

Bitcoin (BTC/USD) Daily Chart Analysis For November 8, 2021Technical Analysis and Outlook:
Bitcoin has been moving upwards since Nov 6th by breaking out from a Mean Sup 60,990 accumulation line. The target is Key Res 65,990 is completed as of Nov 8th with an extension to an All-time high of 67,016 and Inner Coin Rally 70,150. Two buy zones stand as Mean Sup 60,990 and mean Sup 58,450.

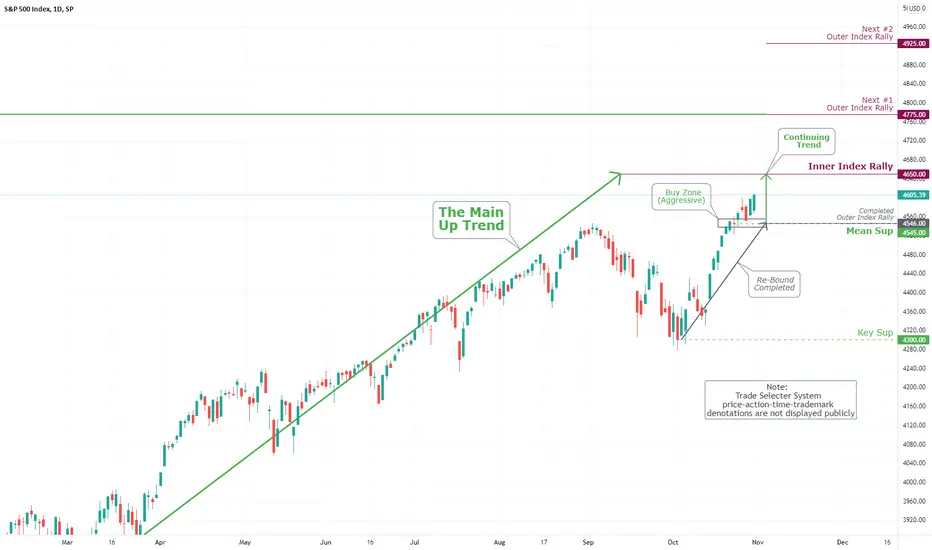
S&P 500 Daily Chart Analysis For Nvember 8, 2021 Technical Analysis and Outlook
The present fractal model suggests that the next significant target of interest will be the Inner Index Rally marked at 4,775, along with the future Next Outer Index Rally 4,925. The Mean Sup 4,545 is high quality and significant buy point.

EUR/USD Daily Chart Analysis For November 8, 2021Technical Analysis and Outlook:
The Euro Dollar, intermediate downtrend price action (Stage 1), is completed at the Key Res 1.1677 mark - this is high merit and significant sell point. On the downside, there is a remaining Stage 2 starting at the Key Sup 1.153 while the Inner #2 Currency Dip 1.1498 is resting below.


S&P 500 Daily Chart Analysis For October 30, 2021 Technical Analysis and Outlook
Simply put, the Index is advancing to our designated Inner Index Rally target of $4650 as projected on Chart Analysis For October 23, 2021. A new buy zone is established at Mean Sup $4545.