BTC/USD Pivot Bear or Bull?Hello Friends,
Most of my TA can be seen on this chart. Just like to add that we are in a descending price channel that has a bear flag within this channel. What this tells me is that we are going to be bearish before we return to a bullish move (price channel).
We may not reach the bear flag target but we will be testing supports on the way down imo. The first of which is the mid dotted trend line that intersects the last support line. Here I can see that this will be a deciding factor for where BTC will go. If support holds, then we can expect a test for upper resistance but if support fails, we could see a move as far down as the bear flag would have it.
On a positive note , remember that descending price channels are bullish by nature. The depth of the channel could match a measured move up between 14.5k and 15k .
Details on the Chart.
This is my viewpoint and my opinion. I am not giving advice but only sharing what I see. Do not enter a trade on my TA but do your own homework.
Cryptocurrency is volatile and very risky. Never invest what you can't afford to lose and always educate yourself and continue to do so when making any kind of investment.
If you find this information helpful, then please hit the like button. Your support is appreciated. Thank you!
CYA on the next one...until then, the trend is your friend. Buying on the dip and selling on the hype.
Cheers!
Price Channels

BQX/BTC 3x+ P.P.Hello Friends
I had trouble identifying any sort of pattern on this chart because of the spikes and whip saws. Previously I charted a failed Inverse head and shoulders pattern which had been of great disappointment but upon further investigation, I had noticed a pattern within the RSI.
Looking at the relative strength index in conjunction with the daily candles I had noticed that after BQX had spiked an unusual high it would quickly reverse and slowly retrace to oversold conditions (one exception after the ATH of late). The time frames are 6 to 7 weeks for this correction and oversold conditions would stay oversold for about 3 weeks before BQX would make a climb upward towards its high. The time frame from its low point to its high point is about 5.5 weeks. This has been happening ever since we have entered into this price channel, (nearing 10 months) August 2018 to this current point in time.
We have had 3 highs and 4 lows. The pattern is every second high is the highest high of the highs and what proceeds that is every second low is the lower low of the lows. The lowest lows seems to trigger the next higher high. The lower the low the higher the high will be. This fact can be seen on this chart. The last low/high was a low of 2530 to a high of 8728 sats. That is 344% return in profit "under perfect conditions".
Now my point, we are currently at a lower low and won't remain here for much longer "according to the pattern". I believe that the time has come for BQX to make an about face and take a slow climb upward to a higher high. My thoughts can be seen on this chart.
Details on the Chart.
This is my viewpoint and my opinion. I am not giving advice but only sharing what I see. Do not enter a trade on my TA but do your own homework.
Cryptocurrency is volatile and very risky. Never invest what you can't afford to lose and always educate yourself and continue to do so when making any kind of investment.
If you find this information helpful, then please hit the like button. Your support is appreciated. Thank you!
CYA on the next one...until then, the trend is your friend. Buying on the dip and selling on the hype.
Cheers!

MANA/BTC 300% to 600% P.P.Hello Friends,
Here is another tricky chart that shows nothing but a continuous channel. All it does is stay within the confines of this channel rarely breaking above the upper channel or below the lower channel. There has been 4 incidences when we saw a spike pass through the upper channel, 3 of which did so in a dramatic fashion and quickly reversed back into the channel. Now we have seen something new on two occasions. The lower channel has been breached and for the first time MANA is oversold.
What does all this mean? If we look underneath the lower channel, we can see several arched green arrows that spans a distance from one high to the next high. Notice how there is a pattern within the arches? The first high touched the upper channel, the next 2 highs were extreme spikes. That is 1,2,3 then the pattern repeats. 1 touches the upper channel, then the following 2 will breach the upper channel. If the pattern holds, then we are due for a spike "if it happens", we are at a 3 count within this crazy pattern idea.
Now let's look at this chart in a realistic way. MANA has never been oversold just as it hasn't breached the lower channel, this tells me we can expect a powerful move upward because we are oversold and had a breach of the lower channel. The indicators for TDS is at a 9 (signal) and there has been a continuous buy signal coming from Bill Williams Fractal ever since MANA became oversold. Fractal says only to buy and not sell. TDS is past the 9 count and in limbo. We are at rock bottom and what goes down must come up at some point. I think we are at that point now.
The other point is that this is a price channel and is on the bullish side of the tracks. The channel itself has not been able to maintain the predictable move up even though on 3 occasions, MANA has surpassed channel expectations. There is a possible chance this time around that when MANA moves to the measured expected move up "seen on this chart as channel target" that it will maintain this position as support in the near future. The biggest advocate is BTCs bull market of late, which has a great influence upon most ALT coins.
Details on the Chart.
This is my viewpoint and my opinion. I am not giving advice but only sharing what I see. Do not enter a trade on my TA but do your own homework.
Cryptocurrency is volatile and very risky. Never invest what you can't afford to lose and always educate yourself and continue to do so when making any kind of investment.
If you find this information helpful, then please hit the like button. Your support is appreciated. Thank you!
CYA on the next one...until then, the trend is your friend. Buying on the dip and selling on the hype.
Cheers!

EUR INDEX - A big Uptrend soon with HEAD AND SHOULDER patternA Forecast is always 50/50 percent.
3 things for probability increase a Buy:
- The price channel (Support)
- RSI
- MACD

Gold Long Bullish Price ChannelGold is in a price channel. It is set to go even higher. This is a certainty.


Wait for Long sellBreakaway candle stick appear in Month chart. As a result, I decided to sell for long term. Waiting for retest and sell. Enjoy!!!

AUDUSD Bearish ContinuationPrice has not yet reached price target following the double top. Recent false break out of the price channel and pin bar forming on the daily chart signals renewed sell signal following recent price strength to top of the channel.
T1= Price Channel support
T2 = Final price target fulfilling projection from double top

EURAUD - short at Weekly price channelWeekly (I), (II) (III): Uptrend, is at wave (IV) to (V)
Daily I, II, III: Uptrend, is at the wave II to III.
H4 (1), (2), (3): Uptrend, is at the wave (6) to (7).
* EURAUD has the Overbought RSI and the Price Channels.
* Waiting for a reversal signal at the smaller time frame.
Note: Daily and H4 group wave is still valid for an uptrend.

Stellar’s (STRUSD) bear channelMarch 18, 2018 till present date is captured in this 4hr tf analysis for Stellar (STRUSD) with a bear channel currently active since ~April 28, 2018.
The summary of this post is that no buying should occur until the bear channel gives way to bullish momentum that should see Stellar (STRUSD) breakout of the current bear channel.
Failure to break out of the channel could see Stellar (STRUSD) test the bottom of the channel at ~0.1502. The width of the channel shown by the vertical blue arrow can be used to calculate the price level where Stellar (STRUSD) is expected to encounter a wall of sellers should price break above ~0.2231.

Bitcoin Price Channel Idea - Where is the Bottom?
Looking at the previous (2014) and recent (2017) bubble movements of Bitcoin, we can see three apparent price channels that dominate the cycles:
1) Base
2) Breakthrough
3) Pop
Here the chart is logarithmic to linearize the growth rate (price channel), assuming the cycles are predominantly exponential.
In the previous cycle we can see the Base price channel was broken and first Breakthrough price resistance was around 200. Later on, the Breakthrough channel ends as the price reaches to 1000 as second Breakthrough channel resistance, and we enter the downwards Pop channel. Pop channel ends when the price reaches to the first Breakthrough price resistance of 200, and we enter the next bubble's Base price channel.
In the recent bubble, again Base price channel was broken and this time first Breakthrough price resistance was around 3500. Second Breakthrough resistance is around 5000. Lastly the Breakthrough channel ends as Bitcoin reaches 20000, and we are now in the Pop price channel.
With these I will speculate and predict the real bottom range for Bitcoin as 3500-5000 and we will hit there around January 2019 - that will be the beginning of the next Base price channel.
Furthermore, we can see that the recent Base price channel was broken (beginning of the Breakthrough channel) when the price reached to the previous all-time-high value of 200. By the same token, Bitcoin will enter Breakthrough channel when it reaches 20000 USD in July-August 2020.
Aside from market cycles, the fundamentals are much different today than of the year 2014. Rate of adoption and visibility is increasing. Therefore I believe the idea I presented here is the worst case scenario.
Thanks for reading - let me know what you think.

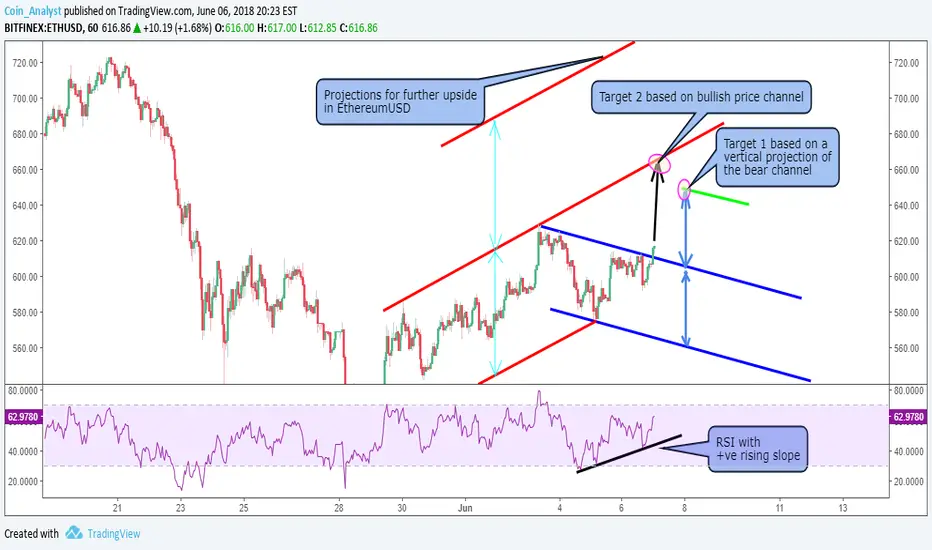
Bullish bias for Ethereum (ETHUSD) using chart patternsThe 1hr tf chart of Ethereum (ETHUSD) as shown here captures the market action for Ethereum (ETHUSD) ever since price bottomed at ~ $511.64 on May 28, 2018.
The pink line is derived as a vertical projection of the top line (red) of the bullish channel. Further break to the upside past target 2 as shown on the chart could see Ethereum (ETHUSD) target the upper region of the pink line at ~$736.80.
Target 2 is based on price returning to the upper region of the current bullish channel and target 1 which is the most conservative is based on a vertical projection of the bear channel shown in blue.
RSI (relative strength index) as shown here has a positive rising slope and therefore implies further upside Momentum for Ethereum (ETHUSD)
Cardano’s (ADABTC) resumption of bear channel: 4hr tfMy previous post for Cardano (ADABTC) can be found here:
It was mentioned in the previous post that Cardano (ADABTC) had broken out of its bearish channel which therefore had possible bullish implications for Cardano (ADABTC). Possible points of entries (POE1 and POE2) were also given as price levels to enter a bullish trade to avoid picking price bottoms which can be very challenging.
It was mentioned in the previous post that Cardano (ADABTC) had broken out of its bearish channel which therefore had possible bullish implications for Cardano (ADABTC). Possible points of entries (POE1 and POE2) were also given as price levels to enter a bullish trade to avoid picking price bottoms which can be very challenging.
Cardano (ADABTC) completed a sideways move instead that was followed by more selling. The lines for the previous bearish channel have been adjusted to indicate the continuation of the bear channel for Cardano (ADABTC).
Price action is currently close to the support region mentioned in the last post and a break below this region should see the selling continue for Cardano (ADABTC). Lines of the current bear channel have been extrapolated so that any break below the support region could see Cardano (ADABTC) target ~0.00001834 (bottom of the current bear channel).
A breakout from the bearish channel implies potential resumption of bullish momentum in Cardano (ADABTC). Safer points of entry (POE) into a bullish trade are POE 1 and POE 2. POE2 is more conservative that POE1
POE1 in this case is ~ 0.00003040 and POE2 = ~0.00003247.

Ethereum (ETHUSD) bullish price channel update:4hr tfEthereum (ETHUSD) as mentioned in the last post collapsed to Support A instead of returning to a price target area between ~$858.46 and $885.75 to maintain its current bullish momentum.
A break of the channel at ~$739.81 on May 10 does suggest a bearish bias for Ethereum. Price action on the other successfully testing Support A (~$685.23 and $646.08) indicates a bullish scenario for Ethereum.
In order to avoid trying to pick the bottom and also waiting for the current move off of support A to indicate more bullish upside, it is best to wait for an area of consolidation in the current bullish move and then buy an upside breakout from the consolidation. It makes the picture of a bullish flag come to mind.
Green arrows on the chart show a likely price trajectory for Ethereum (ETHUSD) for a long position. The least price target for Ethereum (ETHUSD) based on this bullish scenario is the previous high made of ~$820.00 on May 5, 2018.
Failure of price to maintain its current move off of Support A could lead to price testing Support B and a break below that could send Ethereum (ETHUSD) back to the low $500’s

Cardano(ADABTC) bull to bear channel: 4hr tfCardano (ADABTC) broke out of its bullish channel and also moved past Support 1 as mentioned in the previous post given in the link below:
Support 2 also given in the previous post is currently being tested and is shown in this post as the horizontal blue dotted lines between ~0.00003073 and 0.00002953. Cardano (ADABTC) breaking out of its previous bullish channel and also through Support 1 (previous post) does suggest a change of trend from bullish to bearish.
A downtrend (bearish) channel is shown in the post to capture the price action of Cardano (ADABTC) from its previous high of ~0.00004069 till present. ~0.00002354 and 0.00002515 is the region that is expected to offer support if further selling ensues as the horizontal green lines (technical support) coincide with the bottom of the channel as extrapolated.
A downtrend (bearish) channel is shown in the post to capture the price action of Cardano (ADABTC) from its previous high of ~0.00004069 till present. ~0.00002354 and 0.00002515 is the region that is expected to offer support if further selling ensues as the horizontal green lines (technical support) coincide with the bottom of the channel as extrapolated.

Bitcoin bullish reversal or bearish continuation?Bearish pullback patterns:
Tweezer Tops = 0.000
3BarPullback = 0 .236
3OutsideDown = 0.382
Tweezer Tosp/Top Fractal = 0.500
Forecast: What will happen, a bullish reversal in the demand zone (strong support) or a breakthrough?
***This information is not a recommendation to buy or sell. It is to be used for educational purposes only.***

Cardano (ADABTC) testing the bottom of its bullish channelCardano’s (ADABTC) price action was capture in a bullish channel in my previous post which can be found here:
Cardano (ADABTC) at the time of this post is testing the upper region of Support 1 at ~0.00003547, which also coincides with the bottom of the price channel.
A break below the bottom of Support 1 could likely trigger a sell off to Support 2.
Cardano (ADABTC) successfully holding the bottom of the channel could see price reach the new target area between ~0.00004782 and 0.00004639
The relative strength index (RSI) is also shown here for the 4hr tf and it currently has a negative slope with implies that it is better to be patient to see how price action transpires before initiating a long (buy) position. A possible point of entry (POE) as indicated on the chart is on a breakout above ~0.00003769.
This ensures helps to avoid trying to pick the bottom in case of further downside momentum for Cardano (ADABTC).

Ethereum (ETHUSD) bullish price channel update: 4hr tfMy previous post on the bull channel for Ethereum (ETHUSD) can be found here.
It was mentioned in the previous post that the next target for Ethereum (ETHUSD) to indicate a continuation of its current bullish momentum was ~ $737.36 and $763.47. Besides, Ethereum (ETHUSD) also reached Support 1 (~ 627.68 and $597.18 ) mentioned in the previous post before resuming the current bullish leg that has seen Ethereum (ETHUSD) advance towards $800.
Due to price action breaking the previous trendline and reaching support 1 mentioned in the previous post, the channel boundaries have been redrawn again to reflect a valid bullish price channel for Ethereum (ETHUSD).
The new target for Ethereum (ETHUSD) therefore is the upper region of the channel, which is ~ $818.71 and $839.68.
Any retracement from the upper region of the channel would likely reach the bottom of the channel at ~$712.98 as indicated by the downward red arrow.
A break below the bottom of the channel should find support A between ~$674.52 and $646.24. A lower support (i.e. support B between $623.62 and $597.60) on a break below support A is another region that Ethereum could possibly target on a break below its channel.
A breakout above the upper line of the channel should be followed by a consolidation in the price of Ethereum (ETHUSD) before going long and/or adding to already established long positions. This ensures avoiding a possible fakeout breakout.

ADABTC (Cardano) price channel: 4hr tf analysisThe recent bullish action in Cardano (ADABTC) from ~0.00002389 on March 21, 2018 till present date is captured in this analysis using a price channel. Price move upwards thus appears limited as shown by the upward red arrow as the upper target of the channel is ~ 0.00004324.
Any consideration of a long position (i.e. buy) would require patience for Cardano (ADABTC) to successfully test the bottom of its channel which in this case is ~0.00003617.
A slight break below the channel should meet with Support 1 (i.e. between 0.00003547 and 0.00003380) or Support 2 (i.e. 0.00003088 and 0.00002953) as shown in the chart. A break below support 2 could result in price of Cardano (ADABTC) further declining.
Alternatively, a breakout above the upper line of the channel followed by a consolidation in price = more upside momentum for Cardano (ADABTC).


ENJIN is coming for 5th Elliot Wave!Target is 0.00003000
RSI looks nice.
Moving Averages are being support line.
Good entry point.

Potential Long Position for EUR/GBP_Trade Plan 2017.06.28
Legend for price level, trend line, and rectangle:
Dark Gray > Weekly Level
Blue > Daily Level
Red > H4 / H1 Level
Green > M15 / M5 Level
Yellow > M1 Level
D1 and H4 are both showing the overall trend is still up with price is holding above MA200 and major D1 support area 0.87353 - 0.87874.
For the last 1-2 weeks, price is moving and forming Rising Price Channel with currently in H1 price is moving down slightly below this channel lower line.
Trade Plan 1:
If price pull back to the confluences of support area 0.87607 - 0.87763 (H1 nearest support area, D1 support, Price Channel Lower Line) and rejected back up, can consider to long the market to follow the major uptrend.
With Stop Loss 29 pips and Target Profit 58 pips, the potential trade offers 2.00 Reward-To-Risk Ratio.
As an alternative, if price is still moving up with good momentum, Target Profit can be expanded to 85 pips offering 2.93 Reward-To-Risk Ratio.
Keep in alert if price continue moving back down below D1 support area 0.87353 - 0.87874 massively, this Trade Setup will be invalidated.
