EURAUD – Bearish Flag Breakdown OpportunityThe EURAUD pair is showing signs of trend continuation via a classic bearish flag pattern formation. After a sharp decline, the market has entered into a tight consolidation channel, climbing steadily inside a sloped flag structure. Price is now testing a critical resistance area near 1.7830–1.7840 while hovering just below the 200 EMA.
This setup offers a high-probability sell opportunity — but only after confirmation.
1. Structure Overview
The initial sharp downtrend is followed by a consolidation channel — a textbook bearish flag.
Price is approaching major resistance (1.7830–1.7840) and 200 EMA, acting as a ceiling.
A breakdown from the rising support of the flag is expected to trigger a continuation toward the downside.
2. Trade Plan – Bearish Flag Breakdown
✅ Entry Plan:
Wait for a breakdown of the green support trendline (flag support).
Then, wait for a re-test of the broken support (now resistance).
Enter short only after a bearish candlestick confirmation (e.g., bearish engulfing or rejection wick) on the 15-min or 1-hour chart.
🛡️ Stop Loss:
Place the stop loss just above the major resistance zone, around 1.7835–1.7840.
🎯 Target Zones:
Target 1 (TG1): 1.7755
Target 2 (TG2): 1.7718
Final Target: 1.7632
Risk/Reward Ratio: 1:2, 1:4, 1:9.4+
3. Why This Trade Makes Sense
Bearish Flag is a reliable continuation pattern in strong downtrends.
Price is failing to break above key resistance and 200 EMA.
The flag offers a tight SL and large downside potential — ideal conditions for R:R setups.
Confluence of structure, pattern, and trend all align for short bias.
4. Trade Management Tips
Scale out partial profits at TG1 and TG2, and trail stop for final target.
If breakdown fails, avoid chasing price — re-evaluate bias if price breaks above 1.7840.
5. Final Thoughts
This EURAUD chart is a textbook case of pattern + price action + resistance confluence. The flag structure is well-defined, and the reward-to-risk ratio is significantly favorable if the breakdown confirms.
📌 Watch for:
Breakdown of rising support
Retest and bearish candle
Entry only on confirmation
High-probability setups don’t require prediction — they require preparation.
=================================================================
Disclosure: I am part of Trade Nation's Influencer program and receive a monthly fee for using their TradingView charts in my analysis.
=================================================================
Pricemovement

ACC Trade Setup for the Week(14–18 July 2025) – Uptrend ChannelACC Ltd. (NSE: ACC) has been trading inside a clean uptrend channel for the past few weeks, bouncing consistently between rising support and resistance. Now, it approaches a critical inflection point — the lower support of the channel.
While no breakdown has occurred yet, the structure is weakening, and a bearish opportunity may soon present itself. Let’s explore how to trade this if the setup confirms.
1. What’s Happening on the Chart?
ACC is trading close to the channel support zone (~₹1975).
The resistance zone near ₹2000–₹2020 has held strong.
A potential breakdown below the rising green support trendline could trigger a bearish move toward the ₹1910–₹1920 demand zone.
But nothing is confirmed yet — this is a watchlist setup.
2. Trade Setup – Conditional Bearish Opportunity
✅ Trade Plan:
Wait for breakdown of the rising support line.
After breakdown, wait for a re-test of the broken support zone (~₹1975–₹1980).
Look for bearish confirmation via a candlestick pattern (engulfing or strong rejection) on the 15-min or 1-hour timeframe.
🚨 Entry Trigger:
Only enter short if re-test holds and price starts reversing.
📉 Stop Loss:
SL should be above the re-test high (around ₹1990–₹1995).
🎯 Target:
Profit booking zone: ₹1910–₹1920.
Potential R:R: 1:2, 1:3, or even 1:4 depending on entry.
3. Why This Setup Matters
Trend exhaustion is visible near the upper resistance of the channel.
A clean breakdown + re-test gives a low-risk entry.
The 200 EMA lies near the target zone, providing confluence for mean reversion.
4. What If There’s No Breakdown?
If price respects the support and bounces again, no trade should be taken on the short side.
In that case, look for possible bullish reversal signals back toward channel resistance — or stay neutral.
5. Final Thoughts
This is a highly conditional setup — and patience is the key. Don’t jump the gun. The best trades happen after confirmation.
🔔 What to watch this week:
Breakdown below ₹1975 support
Re-test and rejection from ₹1975–₹1985
Confirmation candle (bearish engulfing)
Only then consider a short trade toward ₹1910 with a well-placed SL.
Plan your trade. Wait for structure. Trade only when the market shows its hand.

#SENSEX Intraday Support and Resistance Levels - 14/07/2025Sensex is likely to open slightly gap-down, reflecting weakness carried over from the previous session. The index is currently trading near the 82450 zone. A breakdown below the 82400 level may trigger further downside movement, with potential support targets at 82200, 82100, and 82000. This zone should be monitored closely for continuation or reversal.
On the upside, any strong recovery above the 82600–82650 level could push the index higher, with resistance targets at 82800, 82900, and 83000+. Sustaining above this range may indicate buying interest returning in the market.
If Sensex spikes toward the 82950–83000 zone and faces resistance, a reversal from there could create shorting opportunities with targets at 82800, 82700, and 82600. However, a clear breakout above 83000 would negate this short setup and shift the bias to bullish.
The index is currently in a consolidation zone, and price action around 82600–82400 will be critical to determine the day’s direction.

LTTS Weekly Trade Setup(14th-18th July 2025) – Parallel ChannelThis week, L&T Technology Services (LTTS) is showing a potential breakout opportunity that requires patience and precision. As the stock approaches a key resistance zone near ₹4445, traders should resist the urge to jump in early and instead wait for a breakout and confirmed re-test before entering any long positions.
Let’s break this down.
1. Why the Breakout is Important
- LTTS has been consolidating within a parallel channel between ₹4280 (support) and ₹4445 (resistance). Breakouts from such structures often trigger significant moves — but only when confirmed.
- A false breakout can trap early traders. Hence, waiting for the price to break above ₹4445 and then re-test this level is critical.
2. The Strategy – Wait and React
📌 Step 1: Watch for Breakout
Monitor price action as it approaches and breaches the ₹4445 resistance.
Look for strong bullish candles with volume to validate the breakout.
📌 Step 2: Wait for Re-test
After breakout, price may pull back to test the previous resistance.
This re-test acts as a confirmation that bulls are defending the breakout.
📌 Step 3: Look for Confirmation
Enter only when you see a bullish candlestick pattern (like a bullish engulfing or hammer) near the re-test level on 15-min or 1-hour charts.
🛡️ Stop Loss:
Place your stop below the swing low of the re-test.
This protects you if the breakout fails.
🎯 Target:
Profit booking zone is near ₹4580–₹4600.
Risk/reward ratio: 1:2, 1:3, 1:4+
3. Why Re-test Entries are Powerful
They allow low-risk entries with a tight stop loss.
You avoid chasing price and reduce emotional trading.
Confirmation helps you filter out false breakouts.
4. Final Words
In trading, discipline often beats speed. This LTTS setup is all about timing and structure.
🔔 Watch for the breakout.
🧘♂️ Wait for the re-test.
🎯 Enter only with confirmation.
If executed properly, this trade offers a clean, high R:R opportunity with a clearly defined setup.

EURAUD Weekly Trade Setup(14 to 18th July 2025) - Head&ShoulderThis week, EURAUD (Euro/Australian Dollar) has entered a critical price zone, providing a textbook technical opportunity for traders. A clear Head & Shoulders pattern has formed on the 4-hour chart, pointing toward a potential trend reversal from bullish to bearish.
Let’s explore how to trade this intelligently from both bullish and bearish perspectives.
1. Bearish Setup – Head & Shoulders Pattern Breakdown
This is the primary trade idea for the week.
✅ Trade Logic:
Price has completed a classic Left Shoulder → Head → Right Shoulder formation.
The neckline (support) will be tested.
The current price is will pulling back to retest the right shoulder resistance zone, offering an ideal short opportunity.
🔻 Entry Plan:
Wait for bearish reversal confirmation (candlestick rejection or bearish engulfing) on the 1H or 4H timeframe.
Enter short once confirmation appears near 1.7850–1.7900.
📉 Stop Loss:
Place SL above the right shoulder high, adjusting for volatility and swing high (around 1.7950).
🎯 Targets:
Target zone: 1.7450–1.7500 (profit booking zone marked on the chart)
Potential Risk/Reward Ratio: 1:2, 1:3, or even 1:4+
2. Alternative Bullish Setup – Reversal at Neckline (High Risk)
This setup is for experienced or aggressive traders who spot early reversals.
✅ Trade Logic:
Price may bounce from the neckline and 200 EMA support area.
If this happens, a temporary bullish reversal may push price back toward the right shoulder zone.
🔺 Entry Plan:
Wait for bullish confirmation (reversal candle) near the neckline and EMA support (around 1.7700).
🚨 Stop Loss:
SL must be below the neckline swing low (around 1.7650).
🎯 Targets:
Resistance zone (right shoulder): 1.7850–1.7900
R:R setups of 1:2 or 1:3 possible
⚠️ This is considered a counter-trend trade and should be traded with caution.
3. Technical Confluence and Indicators
Pattern: Head & Shoulders (bearish reversal)
EMA 200: Price reacting around the long-term trend line
Support/Resistance: Cleanly defined horizontal zones
Reversal zones: Highlighted in red (supply) and green (demand)
4. Final Thoughts
This week’s EURAUD setup is a strong example of structure-based trading. With a well-formed head and shoulders pattern and a clean neckline break, the market signals a shift in momentum.
Safe Approach: Trade the short side after resistance rejection.
Risky Approach: Try a long on neckline bounce with tight SL.
Always confirm with your system and maintain strict risk management. Trade what you see, not what you feel.
Ready to trade? Save this setup, monitor price action, and execute only with confirmation.
=================================================================
Disclosure: I am part of Trade Nation's Influencer program and receive a monthly fee for using their TradingView charts in my analysis.
=================================================================

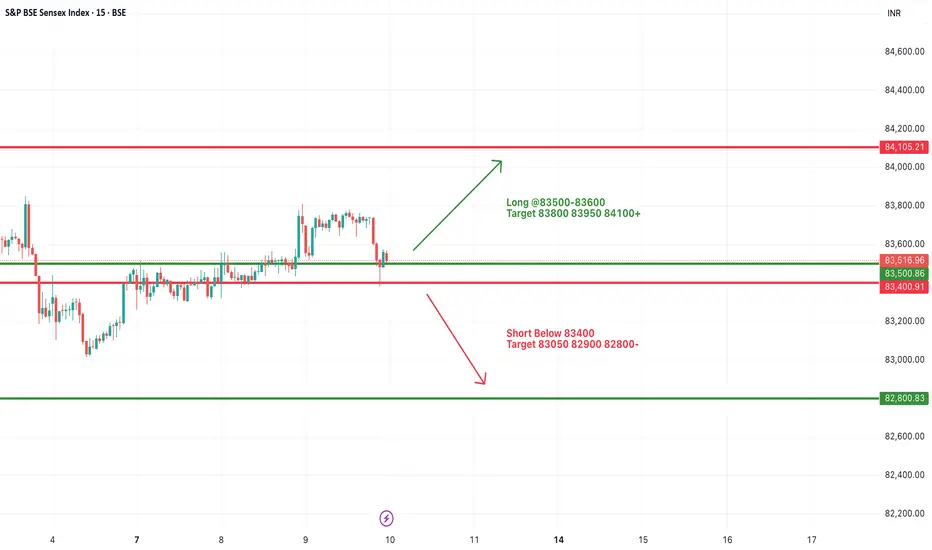
#SENSEX Intraday Support and Resistance Levels - 10/07/2025Sensex is expected to open flat today, continuing the consolidation observed in the past few sessions. The price action remains range-bound with key support near 83400 and resistance around 83600 levels.
Currently, Sensex is hovering near its critical range with buyers and sellers struggling for control. A breakout above the 83500–83600 zone may trigger fresh bullish momentum with targets at 83800, 83950, and 84100+. Sustained movement above 84100 could signal a stronger trend reversal.
On the downside, a breakdown below the 83400 level could lead to weakness, with immediate targets at 83050, 82900, and 82800-.
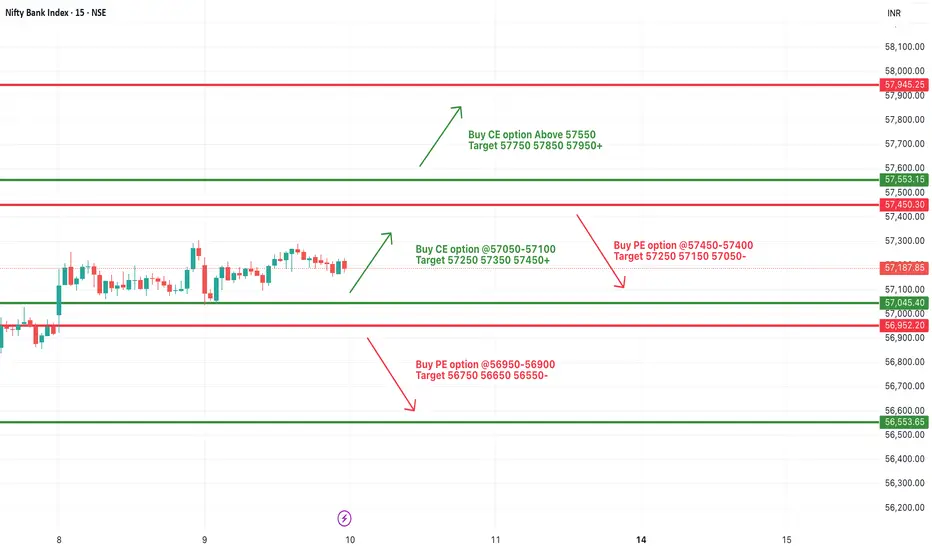
[INTRADAY] #BANKNIFTY PE & CE Levels(10/07/2025)Bank Nifty is expected to open flat today due to the continued consolidation seen over the last few sessions. The index is trading within a tight range between 57450 on the upside and 57050 on the downside, indicating indecision in the market.
A sustain above the 57050–57100 zone could initiate fresh buying momentum, potentially pushing prices towards the targets of 57250, 57350, and 57450+. Sustained move above 57550 may further lead to an extended rally toward 57750, 57850, and even 57950+ levels.
On the other hand, if the index breaks below the 56950–56900 level, it may invite fresh selling pressure. In such a scenario, downside targets are seen at 56750, 56650, and 56550-.
Until a decisive move happens beyond the upper or lower bounds, expect sideways action within the current consolidation range. Traders are advised to wait for a breakout from the range for directional trades.
#SENSEX Intraday Support and Resistance Levels - 09/07/2025Sensex is expected to open slightly gap up near the 83500–83600 range, showing positive momentum as it breaks out from its recent consolidation zone. A sustained move above this level could trigger further upside, with immediate targets seen at 83800, 83950, and 84100+ levels. This zone will act as a crucial resistance-turned-support for the session.
However, if the index fails to hold above 83500 and slips below 83400, it may enter a corrective phase. A breakdown below 83400 could lead to a downward move toward 83050, 82900, and possibly 82800-. Overall, trend remains positive above 83600, and traders should watch for confirmation in the opening session.

#NIFTY Intraday Support and Resistance Levels - 08/07/2025Nifty is expected to open flat with no major change in the overall levels compared to the previous session. The index continues to hover near a crucial resistance zone around 25450–25500. A breakout above 25550 will indicate bullish strength and may lead to an upward move toward 25600, 25650, and even 25750+. This zone has been tested multiple times, and a decisive break can attract further buying.
On the downside, the support remains at 25450. A break below this level can invite selling pressure, with immediate targets at 25350, 25300, and 25250-. The market is clearly respecting this consolidation band, so any directional move will depend on a confirmed breakout or breakdown from these levels.
Traders should remain cautious and avoid early entries unless a clean move is seen beyond the 25550 or below the 25450 levels.

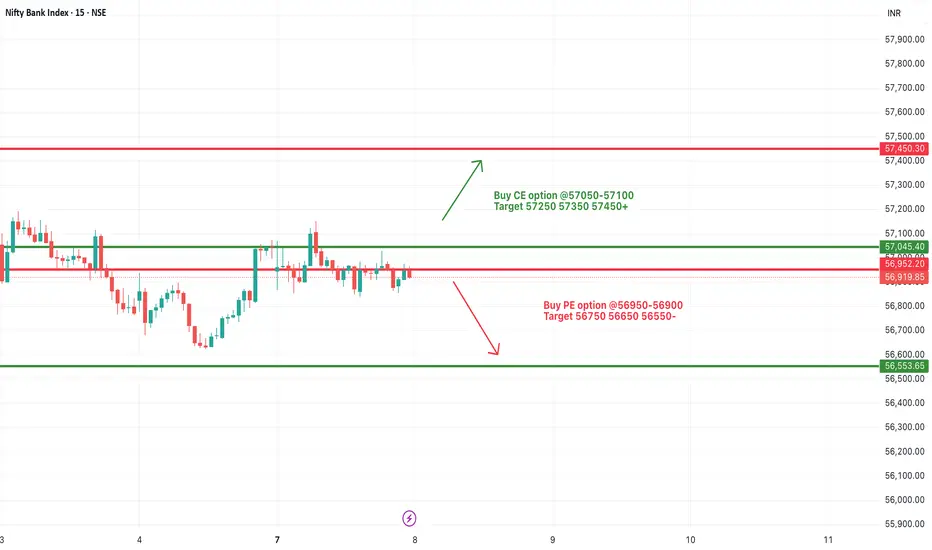
[INTRADAY] #BANKNIFTY PE & CE Levels(08/07/2025)Bank Nifty is expected to open flat with no significant change in levels compared to the previous session. The price action continues to remain within a consolidation range between 56950 and 57050. A breakout above the 57050 level could trigger bullish momentum, with potential upside targets at 57250, 57350, and 57450+. This resistance zone has been tested multiple times, and a clean breakout could attract fresh buying interest.
On the other hand, if Bank Nifty slips below the 56950–56900 support zone, it may lead to fresh selling pressure. In that case, we may see targets of 56750, 56650, and 56550 being achieved on the downside.
Since the market is currently range-bound and trading near the breakout/breakdown zones, traders are advised to stay cautious and wait for a confirmed move above 57050 or below 56950 for directional trades. Risk management is key, especially in this narrow consolidation phase.
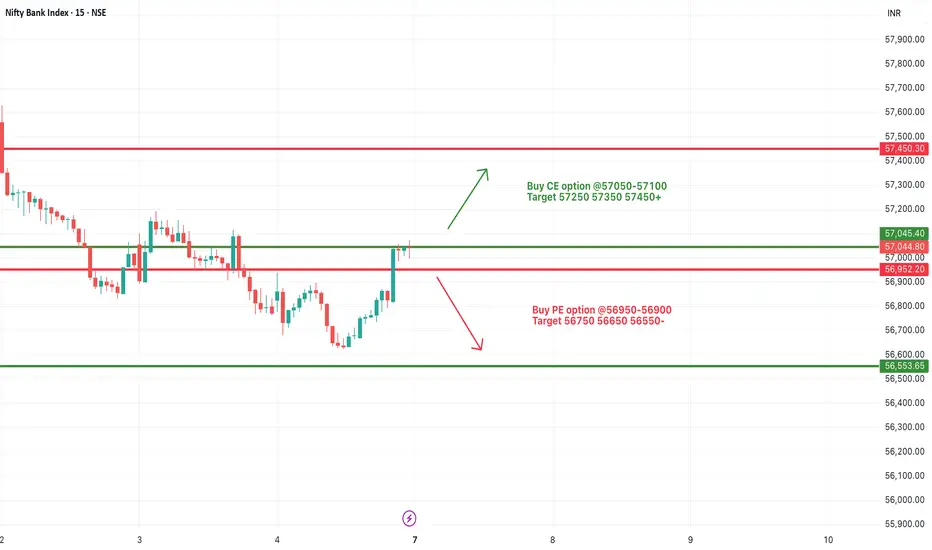
[INTRADAY] #BANKNIFTY PE & CE Levels(07/07/2025)Bank Nifty is expected to open flat near the 57000 mark, which coincides with a crucial resistance level. If the index manages to sustain above the 57050–57100 zone, it may trigger bullish momentum, pushing prices toward immediate targets of 57250, 57350, and potentially 57450+. This breakout zone holds significance as it marks a clear shift in sentiment from recent downtrends to potential reversal.
On the downside, if Bank Nifty faces rejection from current levels and slips below the 56900–56950 zone, it may indicate fresh weakness. In such a scenario, we can expect downward movement with targets at 56750, 56650, and 56550. The 56900 level will act as a short-term support, and a breakdown below it may resume the bearish momentum from the past sessions.
Traders should be cautious near the 57000–57050 zone and wait for a clear directional move. Whichever side breaks first, the movement is likely to gain momentum, so manage positions with strict stop losses and partial booking at each target.
[INTRADAY] #BANKNIFTY PE & CE Levels(04/07/2025)Bank Nifty will open with a gap-up near the 56950 zone, placing it close to an immediate resistance area. If the index sustains above the 57050–57100 level, it indicates bullish strength and could trigger a further upward move toward 57250, 57350, and potentially 57450+. This level acts as a breakout zone for upside momentum. On the other hand, if the price faces resistance around 56950–57000 and starts reversing, a short opportunity opens below 56950–56900, with targets placed at 56750, 56650, and 56550.
In case Bank Nifty falls further and breaches the 56450 mark, it may signal a strong breakdown and continuation of the downtrend, leading to lower targets around 56250, 56150, and 56050. However, if the index takes support at the 56650–56600 zone and shows signs of reversal, it can provide a buying opportunity for a bounce back toward 56750, 56850, and 56950.
Overall, the day’s strategy should be reactive to these key levels, with trades initiated only upon proper price action confirmation. Use trailing stop-loss to protect profits and exit partially at key target levels.

Gold Price Analysis July 3GOLD Technical Analysis - D1 Frame
On the D1 frame, the uptrend is still being maintained with momentum towards the price gap zone. During the European session, selling pressure started to appear around the resistance zone of 3365 - showing that this is the area where the sellers are making counter-moves.
On the chart, the gold price is accumulating and forming a triangle pattern, indicating the possibility of a strong movement phase.
If the price breaks the upper border of the triangle (above the 3363 zone), it will likely open up an opportunity to approach the next resistance at 3388.
On the contrary, if it breaks the lower border (below the 3330 zone), the correction trend may be triggered, heading towards deeper support zones.
Important Zones:
Resistance: 3363 – 3388
Support: 3330 – 3311 – 3297 – 3277
Trading Strategy:
BUY Breakout: When price breaks above 3363
SELL Breakout: When price breaks below 3330

[INTRADAY] #BANKNIFTY PE & CE Levels(03/07/2025)Bank Nifty is expected to open flat near the 56,970 level. After a strong downward move in the previous session, prices are attempting to recover from the 56,950 support zone. This level may act as an immediate base in early trading hours.
If Bank Nifty sustains above 57,000–57,045 levels, we may see a short covering rally toward 57,250–57,450. However, any rejection near 57,000 can again drag the index toward 56,750 and 56,550. Since the price is opening near a key decision zone, it's advised to wait for directional confirmation before entering any trade.

GBP/AUD Range-Bound Structure – Support Retest in ProgressThe GBP/AUD pair is currently trading inside a well-defined horizontal range channel, bounded by resistance around 2.1050–2.1100 and support near 2.0600–2.0650. Price has been moving in a sideways rhythm since late April, oscillating between the two levels with several clean swings.
As of now, the market is heading toward the ascending support trendline, indicating a possible short-term bounce or a larger directional move depending on how price reacts there.
🔄 Scenario 1: Bullish Rebound from Support
If the price finds buying interest near the 2.0650–2.0700 zone and bounces with strong bullish candles, it may signal the beginning of another swing toward the resistance zone at 2.1100. This would maintain the current range-trading behavior, offering traders a buy-low, sell-high opportunity.
Buy Entry: Near 2.0650–2.0700 (after confirmation)
SL: Below 2.0580
TP: 2.0950 / 2.1100
⛔ Scenario 2: Bearish Breakdown from Support
However, if price decisively breaks below the support zone with momentum, it would invalidate the current range and may trigger a larger corrective leg to the downside. This could lead to levels around 2.0400 or even 2.0200, aligned with previous demand zones.
Sell Entry: On breakdown below 2.0600 with retest
SL: Above 2.0700
TP: 2.0400 / 2.0200
🧭 Technical Outlook Summary
Pattern: Horizontal range with slight ascending base
Bias: Neutral – Watch for bounce or breakdown
Support to watch: 2.0650–2.0600
Resistance to watch: 2.1050–2.1100
Next Action: Wait for reaction at support before taking directionally biased trades
=================================================================
Disclosure: I am part of Trade Nation's Influencer program and receive a monthly fee for using their TradingView charts in my analysis.
=================================================================

Gold price analysis July 2As expected, after the D1 candle showed the return of buying power, yesterday's trading session saw the price continue its upward trend and reach 3357.
Currently, the market is in an accumulation phase with a fairly wide range, fluctuating from 3328 to 3344. This is an important price zone, acting as a "sideway box" waiting for a breakout.
The priority strategy at this time is still trend trading - activated when the price breaks out of the above accumulation zone.
BUY orders will have a high probability of success if the price adjusts and retests the Support or Resistance zones that have just been broken, then forms a confirmation signal.
Meanwhile, SELL orders around resistance should only be considered a recovery strategy in an uptrend - requiring strict risk management and short-term profit expectations.
Breakout Range: 3328 – 3344
Support: 3310 – 3298
Resistance: 3368 – 3386

#NIFTY Intraday Support and Resistance Levels - 01/07/2025Nifty is expected to open with a slight gap up near the 25,550 level, which lies close to a minor resistance zone. If the index manages to sustain above this region, we may see a continuation of bullish momentum with potential upside levels at 25,600, 25,650, and 25,700. Holding above 25,550 would signal strength, supported by recent recovery attempts from lower levels.
However, if the index fails to hold above 25,550 and starts slipping below 25,450, weakness may creep in. A fall below 25,450 could open the door for downside targets of 25,350, 25,300, and possibly 25,250. Traders should stay cautious around the 25,550–25,600 zone for a clear directional move, with strict stop losses on both sides.

[INTRADAY] #BANKNIFTY PE & CE Levels(01/07/2025)Bank Nifty is expected to open slightly gap up near the 57,450 level, which lies close to an important resistance zone. If the index manages to sustain above this level, a further upside movement may be seen toward 57,750, 57,850, and 57,950. Strength above 57,500 could indicate bullish momentum continuation and may attract fresh buying interest.
On the flip side, if Bank Nifty fails to hold above the 57,450–57,400 zone and shows signs of reversal, a decline toward 57,250, 57,150, and 57,050 is possible. A breakdown below 56,950 will likely trigger further downside levels toward 56,750, 56,650, and 56,550. It is advised to observe price action around the 57,450–57,500 level for directional clarity in today’s session.

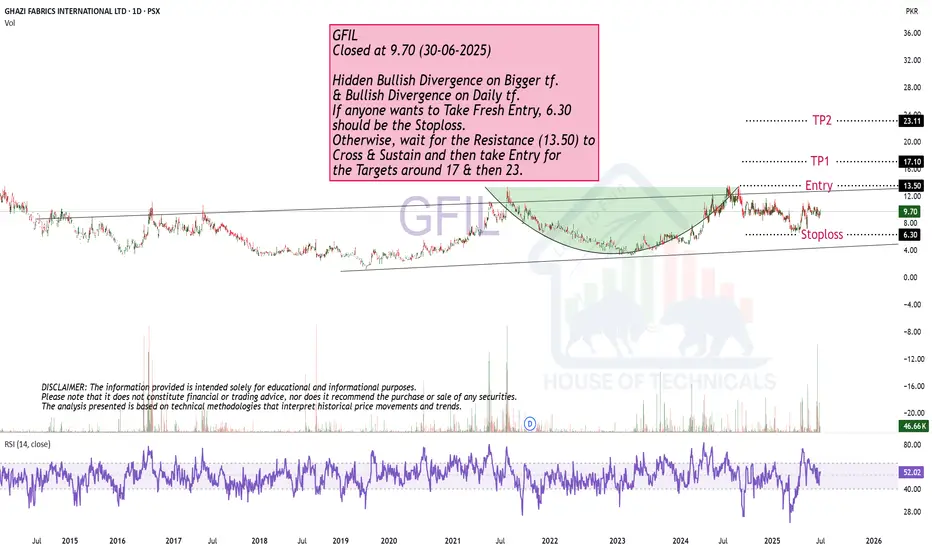
Cup & Handle Formation.GFIL
Closed at 9.70 (30-06-2025)
Hidden Bullish Divergence on Bigger tf.
& Bullish Divergence on Daily tf.
If anyone wants to Take Fresh Entry, 6.30
should be the Stoploss.
Otherwise, wait for the Resistance (13.50) to
Cross & Sustain and then take Entry for
the Targets around 17 & then 23.
GBP/AUD Falling Wedge Pattern – Reversal or Breakdown?The GBP/AUD pair is currently trading inside a well-defined falling channel on the 15-minute timeframe. The price has been making lower highs and lower lows, respecting both the descending resistance and support trendlines. This setup suggests a short-term bearish structure, but the most recent bounce from the lower boundary raises the possibility of a bullish reversal from support.
🔁 Key Technical Levels
Resistance Zone: Around 2.0995–2.1005 (top of the channel)
Support Zone: Around 2.0930–2.0940 (bottom of the channel)
🔼 Bullish Reversal Scenario
The pair recently bounced strongly from the support zone, indicating buying interest near the channel bottom. If the price breaks above the descending resistance line with a strong bullish candle and follow-through, it would suggest a breakout from the falling channel. That could open upside potential toward 2.1020–2.1050, especially if volume supports the move.
🔽 Bearish Continuation Scenario
If the resistance holds and price starts to fall again, the pair could continue the downward structure, retesting the 2.0940–2.0930 support. A breakdown below that level would confirm a bearish continuation with possible targets near 2.0900 or lower.
🎯 Trade Plan Outline
Buy Setup:
Entry: On confirmed breakout above resistance (~2.1005)
SL: Below 2.0980
TP: 2.1030 / 2.1050
Sell Setup:
Entry: On rejection at resistance or confirmed breakdown below 2.0930
SL: Above 2.1000
TP: 2.0910 / 2.0885
=================================================================
Disclosure: I am part of Trade Nation's Influencer program and receive a monthly fee for using their TradingView charts in my analysis.
=================================================================

USD/JPY Consolidation Triangle – Breakout WatchThe USD/JPY pair is currently trading inside a well-formed symmetrical triangle pattern on the daily chart. This structure typically forms when the market is in a phase of consolidation, with neither buyers nor sellers able to break the range. Price is compressing between a horizontal resistance zone (~146.50) and a rising support line (~143.50), indicating that a breakout in either direction may be imminent.
This triangle has formed after a sharp downtrend, followed by a broad base formation. Such setups often precede a decisive move, especially if accompanied by volume.
🔼 Upside Breakout Scenario
If price breaks and closes above the resistance zone (above 146.50–147.00) with bullish confirmation, we can expect momentum to shift in favor of buyers. A confirmed breakout would open the path toward 150.00+, possibly even retesting the highs of 2024 near 152.00. This would be seen as a bullish reversal after a prolonged downtrend.
🔽 Downside Breakdown Scenario
Alternatively, if price fails to hold the rising trendline and breaks below the 143.00–142.50 support zone, it may confirm a bearish breakdown. This would suggest a continuation of the earlier downtrend with fresh bearish momentum targeting 140.00 and lower levels.
🧭 Trade Strategy Consideration
Bullish Plan: Buy breakout above 147.00 with SL below 145.50 and TP near 150.50–152.00
Bearish Plan: Sell breakdown below 142.50 with SL above 144.00 and TP near 140.00–138.00
Neutral Bias: Wait for breakout confirmation; no trade inside the triangle
This is a tight volatility setup where breakout traders should stay alert. The longer the consolidation, the stronger the breakout move tends to be.
=================================================================
Disclosure: I am part of Trade Nation's Influencer program and receive a monthly fee for using their TradingView charts in my analysis.
=================================================================

#NIFTY Intraday Support and Resistance Levels - 30/06/2025Nifty is expected to open on a flat note near the 25,630 zone. The market has shown strong bullish momentum in recent sessions, and prices are now hovering near the upper resistance band of 25,750. If Nifty manages to break and sustain above the 25,750 level, a fresh upward move can be expected, with targets around 25,850, 25,900, and 25,950+. This could offer good long opportunities, especially above the 25,750–25,770 breakout range.
On the downside, if Nifty faces resistance around 25,750 and starts to reverse from that level, a short opportunity could emerge in the 25,750–25,700 zone. In such a case, reversal targets can be seen at 25,650, 25,600, and 25,550. Support at 25,550 will act as a crucial level to watch.

[INTRADAY] #BANKNIFTY PE & CE Levels(30/06/2025)Bank Nifty is expected to open on a flat note near the 57,400 zone, with price action currently hovering around a key resistance level of 57,450. If Bank Nifty sustains and breaks above this resistance zone of 57,450–57,500, a bullish breakout is likely. Traders can consider buying CE options in the 57,550–57,600 range with potential targets at 57,750, 57,850, and 57,950+. This move would signal continued upward momentum in the index.
However, if the price faces rejection from this resistance and slips below 57,450, a short-term reversal is possible. In that case, traders may look for PE opportunities in the 57,400–57,450 zone with targets at 57,250, 57,150, and 57,050. The lower support level remains around 57,050, which should act as a key zone for reversal or bounce-back scenarios.
