[INTRADAY] #BANKNIFTY PE & CE Levels(02/04/2025)Today will be slightly gap up opening expected in index near 51000 level. After opening it will face strong resistance at this level and expected reversal direction towards the 50550 level. This downside rally can extend for further 400-500+ points in case banknifty starts trading below 50450 level. Any bullish side rally only expected if banknifty starts trading and sustain above 51050 level.
Pricemovement

#NIFTY Intraday Support and Resistance Levels - 01/04/2025Flat or slightly gap down opening expected in nifty. After opening if nifty starts trading below 23450 level then possible strong downside rally upto 23250 level. Any upside movement only expected if nifty sustain above 23500 after opening session. Upside 23750 will act as strong resistance for today's session.

[INTRADAY] #BANKNIFTY PE & CE Levels(01/04/2025)Today will be flat or slightly gap down opening expected in index. After opening important level for banknifty is around 51500. If banknifty starts trading below 51450 level then expected downside movement upto 51050 level in today's session. Similarly if banknifty starts trading and sustain above 51550 level then there will be upside bullish rally upto 51950+ level possible.

#NIFTY Intraday Support and Resistance Levels - 28/03/2025Gap up opening expected in nifty. After opening if nifty starts trading and sustain above 23800 level then possible upside rally continue upto 24000+ level. 23550-23750 zone is the consolidation zone for nifty. Any major downside expected below 23450 level.

Asian session GJ trade, This is not financial advice just education. Idea is strictly based on price action

#NIFTY Intraday Support and Resistance Levels - 27/03/2025Flat opening expected in nifty. After opening if nifty starts trading and sustain above 23550 level then expected upside movement upto 23750+ level in today's session. Major downside expected below 23500 level. This downside rally can goes upto 23250 in today's session.

[INTRADAY] #BANKNIFTY PE & CE Levels(27/03/2025)Today will be slightly gap down opening expected in index. After opening possible banknifty consolidate in between the 51050-51450 level in today's session. Any upside rally only expected if banknifty starts trading and sustain above 51550 level. Major downside expected in index if it's give breakdown of 50950 level. This downside rally can goes upto 50550 level.

[INTRADAY] #BANKNIFTY PE & CE Levels(26/03/2025)Today will be slightly gap up opening expected in index. After opening if banknifty sustain above 51550 level then expected upside movement upto 51950+ level in opening session and this rally can extend for further 400-500+ points in case banknifty starts trading above 52050 level. Any major downside expected below 51450 level.

Gold Price Analysis March 25The D1 gold candlestick confirmed a clear decline. Some late-day buying pressure around 3000 pushed the gold price a bit.
H4 has formed a bearish wave with an important price of 3028. If H4 cannot break 3028 today, there will likely be a strong sell-off of gold at the end of the day.
Trading scenario. Gold is pushing up from the 3015 price zone. Target in the European session is 3027-3028. If this zone cannot be broken at the end of the session, SELL and hold at 3008. If the US confirms a break of 3008, hold at 2983. In case of a break of 3028, the sellers are weak. Be careful of false break of 3028. If the break is real, wait for 3035 to SELL today.
Gold does not push up to 3027 but closes below 3015, then SELL to 3008. At the end of the session, if it breaks 3008, hold to 2983. If it doesn't break, then BUY again to the 3008 area, target 3028.

+120 pips in profit and still running !!!I sent in this setup before the New York session and told you all the reason for the entry and as always, it's the same strategy i always use even for my previous trade ideas i share on here.
Price is still bearish until the trendline liquidity is taken and that's still quite far which means price is still bearish.

[INTRADAY] #BANKNIFTY PE & CE Levels(25/03/2025)Gap up opening expected in today's session. Expected opening above 52000 level. After opening if banknifty sustain above 52050 then expected strong upside rally upto 52450+ level in opening session. Downside 51550 level will act as a strong support for today's session. Any major downside only expected below 51450 level.

#NIFTY Intraday Support and Resistance Levels - 25/03/2025Today will be gap up opening in nifty. Expected opening near 23750 level. After opening if nifty starts trading above 23800 then this bullish rally can extend for further 150-200+ points upto 24000+ level in today's session. Any major downside only expected below 23500 level.

Gold Price Analysis March 24Fundamental Analysis
Meanwhile, the US Dollar (USD) is struggling to capitalize on a three-day rally from multi-month lows amid expectations that a tariff-driven US economic slowdown could force the Federal Reserve (Fed) to resume its rate-cutting cycle soon. This, coupled with geopolitical risks, acted as a non-yielding driver for Gold and helped limit downside momentum. Hence, it would be prudent to wait for a strong follow-through before confirming that XAU/USD has topped out in the near term and positioning for any meaningful corrective slide.
Technical Analysis
Friday's D1 saw strong selling pressure with the sharpest drop from 3046 to 3000. Late in the day, bulls pushed the price back 50% of the D candle. This shows that bears have entered the market but the downtrend will take some time.
The h4 structure is quite nice to see the buy and sell wave structure.
Scenario 1: In the 3026 zone of the European session, selling pressure has appeared. If the price pushes up to break the 3026 zone at the end of the session, it will give a BUY signal, break 3026, target 3037. When the US session breaks 3037, keep the order until 3045. The 3045 zone gives a good SELL signal for today if the price finds it. When the price reaches 3037 and cannot break this zone when the US enters, it can SELL to 3026, further than 3018. Scenario 2: The price does not break 3026 but falls, then wait for support around 3013 and support 3003.

[INTRADAY] #BANKNIFTY PE & CE Levels(24/03/2025)Today will be gap up opening in banknifty. After opening expected upside rally upto 50950+ level in today's session. This upside rally can be extend for further 400-500+ points in case banknifty gives breakout and starts trading above 51050 level. Any major downside move only expected below 50450 level.

GBP/USD LONGHi !
Based on the current price action and I have prepared 2 trades for next week.
First is a long position from 1.287 where is VAL , price has respected this area, making it a good level for initiating a smaller long position with limited risk.
Forward I am looking at 1.3 area and looking to scaling in after confirmation above 1.302 ensures that I participate in the trend continuation without overexposing prematurely.
Step 1: Small Entry at 1.287
Entry: Long position at 1.287.
Stop Loss: Below 1.2800.
Take Profit: Partial profit near resistance at 1.3000, or hold until breakout confirmation.
Step 2: Scale In After Breakout
Entry Trigger: Wait for price action to break and hold above 1.302 (confirmed by strong candlestick close or volume spike).
Entry Price: Enter larger position at 1.302.
Stop Loss: Below recent breakout level (~1.295).
Take Profit Levels:
First Target: 1.3200.
Second Target: 1.3400.
FX:GBPUSD

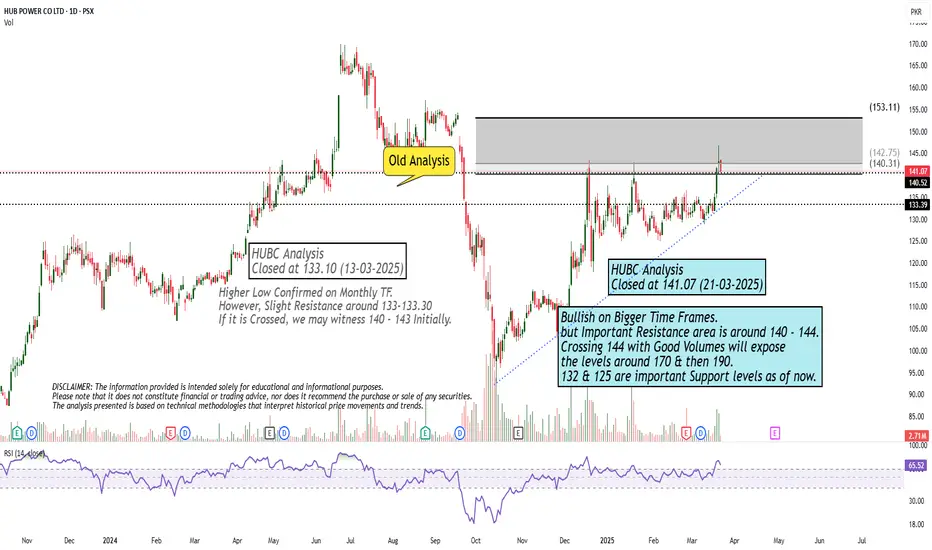
Bullish on Bigger Time Frames.Bullish on Bigger Time Frames.
but Important Resistance area is around 140 - 144.
Crossing 144 with Good Volumes will expose
the levels around 170 & then 190.
132 & 125 are important Support levels as of now.
Bullish on Bigger Time Frames.Bullish on Bigger Time Frames.
Immediate Resistance is around 126 - 127.
Potential to touch 200 is 127 is Sustain on
Monthly Basis.
On the flip side, 101 - 111 is the Support level
(if it takes pressure now.
Now it should not Break 89.

#NIFTY Intraday Support and Resistance Levels - 21/03/2025Flat opening expected in nifty. Expected opening near 23200 level. This level will act as an immediate resistance for nifty. Any downside reversal expected from this level. Downside 23000 level will act as a strong support for today's session. Any downside movement can revers from this support level. Strong upside rally expected if nifty starts trading above 23250 level. This rally can be 200-250+ points in today's session.

#NIFTY Intraday Support and Resistance Levels - 20/03/2025Gap up opening expected in nifty above 23000 level. After opening if nifty sustain above this level then expected strong upside rally upto 23250+ level in today's session. Any downside movement only expected below 22950 level. Downside 22750 level will act as a strong support for today's session. Any major downside only expected below this support level.

[INTRADAY] #BANKNIFTY PE & CE Levels(19/03/2025)Today will be gap up opening in index. Expected opening above 49500 level. After opening if it's sustain above this level then this upside rally can goes upto 49950+ level in opening session and it can be extend for further 400-500+ points in case banknifty starts trading above 50050 level. Any downside possible below 49450 level. Downside 49050 level will act as strong support level for today's session.

[INTRADAY] #BANKNIFTY PE & CE Levels(18/03/2025)Today will be gap up opening expected in index. After opening if banknifty sustain above 48550 level then possible strong upside rally upto 48950+ level and this rally can be extend for further 400-500+ points in case banknifty starts trading above 49050 level. 48950 level will act as a resistance level for upside rally. Expected reversal from this level. Any major downside only expected below 48450 level.

#NIFTY Intraday Support and Resistance Levels - 17/03/2025Expected gap up opening in nifty near 22500 level. After opening this is an important level for nifty. If nifty starts trading and sustain above 22550 level then expected upside rally upto 22700+ level. Downside reversal expected if nifty not sustain above level and starts trading below 22500. Downside 22350 level will act as a strong support for today's session.

#NIFTY Intraday Support and Resistance Levels - 13/03/2025Flat opening expected in index. After opening if nifty starts trading above 22500 level then expected upside rally upto 22650+ in today's session. 22650 level will act as an immediate upside resistance. Expected reversal from this level. Major downside expected if nifty not sustain above 22500 and starts trading below 22450 level.
