USDJPY Symmetrical Triangle – Be Ready for Breakout or BreakdownUSDJPY is currently squeezed inside a well-formed symmetrical triangle, indicating a breakout is imminent. This consolidation pattern is nearing its apex, and price action is getting tighter. A sharp move in either direction could unfold soon. Here's how to prepare:
🟢 Bullish Breakout Setup:
Entry Trigger: 1H candle close above 148.70
Stop Loss: Below last higher low or triangle support (~148.15)
Targets:
TG1: 149.20
TG2: 149.60
Final TG: 149.95–150.00
Bias: Favors trend continuation (previous uptrend)
🔍 Confirmation: Strong breakout candle with momentum and/or volume.
🔴 Bearish Breakdown Setup:
Entry Trigger: 1H candle close below 148.15
Stop Loss: Above triangle resistance (~148.70)
Targets:
TG1: 147.60
TG2: 147.20
Final TG: 146.80
Bias: Reversal or failed trend continuation
🔍 Confirmation: Clean breakdown with bearish candle close + possible re-test rejection.
⚠️ Avoid premature entries inside the triangle. Wait for a confirmed breakout or breakdown with candle close and rejection follow-up.
🎯 Tip: Triangle breakouts often result in fast directional moves. Plan your lot size based on volatility and stick to your risk parameters. This is a high-probability setup — trade with discipline.
=================================================================
Disclosure: I am part of Trade Nation's Influencer program and receive a monthly fee for using their TradingView charts in my analysis.
=================================================================
Priceprediction

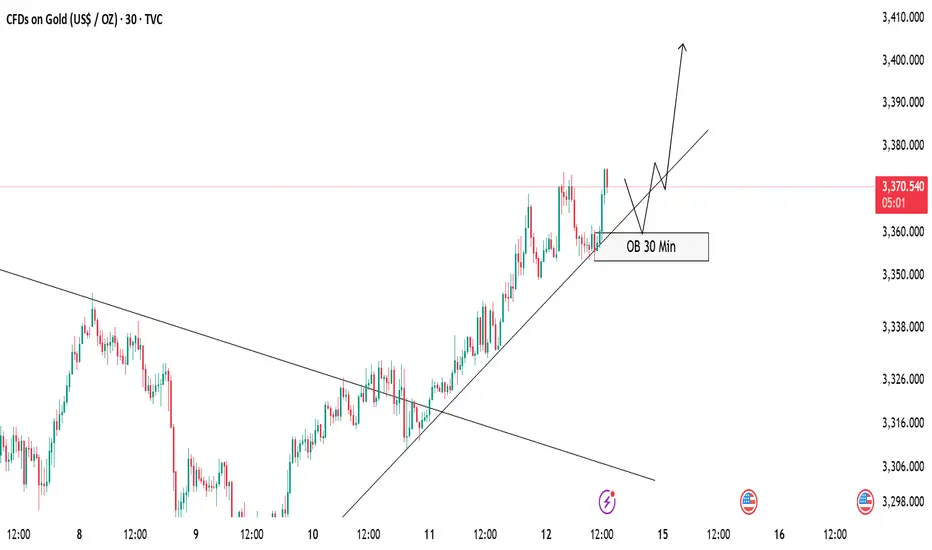
GOLD Buy Setup – OB Zone in FocusCurrently, gold is respecting the ascending trendline and maintaining a bullish structure 🟢. Price hasn’t tapped into the 30 Min Order Block (OB) yet, but we are expecting a potential pullback into this OB zone 📍.
✅ Our Plan:
We will wait patiently for price to mitigate the OB.
After the tap, we will look for bullish confirmation (rejection wick, bullish engulfing, or break of minor structure) before entering a buy position 🚀.
As long as the trendline holds, we remain bullish on gold.
📝 Invalidation:
If price breaks and closes below the trendline and OB zone, we will stay out or re-evaluate the setup ❌.
Stay disciplined and follow the plan! 💪
EURAUD – Bearish Flag Breakdown OpportunityThe EURAUD pair is showing signs of trend continuation via a classic bearish flag pattern formation. After a sharp decline, the market has entered into a tight consolidation channel, climbing steadily inside a sloped flag structure. Price is now testing a critical resistance area near 1.7830–1.7840 while hovering just below the 200 EMA.
This setup offers a high-probability sell opportunity — but only after confirmation.
1. Structure Overview
The initial sharp downtrend is followed by a consolidation channel — a textbook bearish flag.
Price is approaching major resistance (1.7830–1.7840) and 200 EMA, acting as a ceiling.
A breakdown from the rising support of the flag is expected to trigger a continuation toward the downside.
2. Trade Plan – Bearish Flag Breakdown
✅ Entry Plan:
Wait for a breakdown of the green support trendline (flag support).
Then, wait for a re-test of the broken support (now resistance).
Enter short only after a bearish candlestick confirmation (e.g., bearish engulfing or rejection wick) on the 15-min or 1-hour chart.
🛡️ Stop Loss:
Place the stop loss just above the major resistance zone, around 1.7835–1.7840.
🎯 Target Zones:
Target 1 (TG1): 1.7755
Target 2 (TG2): 1.7718
Final Target: 1.7632
Risk/Reward Ratio: 1:2, 1:4, 1:9.4+
3. Why This Trade Makes Sense
Bearish Flag is a reliable continuation pattern in strong downtrends.
Price is failing to break above key resistance and 200 EMA.
The flag offers a tight SL and large downside potential — ideal conditions for R:R setups.
Confluence of structure, pattern, and trend all align for short bias.
4. Trade Management Tips
Scale out partial profits at TG1 and TG2, and trail stop for final target.
If breakdown fails, avoid chasing price — re-evaluate bias if price breaks above 1.7840.
5. Final Thoughts
This EURAUD chart is a textbook case of pattern + price action + resistance confluence. The flag structure is well-defined, and the reward-to-risk ratio is significantly favorable if the breakdown confirms.
📌 Watch for:
Breakdown of rising support
Retest and bearish candle
Entry only on confirmation
High-probability setups don’t require prediction — they require preparation.
=================================================================
Disclosure: I am part of Trade Nation's Influencer program and receive a monthly fee for using their TradingView charts in my analysis.
=================================================================

ACC Trade Setup for the Week(14–18 July 2025) – Uptrend ChannelACC Ltd. (NSE: ACC) has been trading inside a clean uptrend channel for the past few weeks, bouncing consistently between rising support and resistance. Now, it approaches a critical inflection point — the lower support of the channel.
While no breakdown has occurred yet, the structure is weakening, and a bearish opportunity may soon present itself. Let’s explore how to trade this if the setup confirms.
1. What’s Happening on the Chart?
ACC is trading close to the channel support zone (~₹1975).
The resistance zone near ₹2000–₹2020 has held strong.
A potential breakdown below the rising green support trendline could trigger a bearish move toward the ₹1910–₹1920 demand zone.
But nothing is confirmed yet — this is a watchlist setup.
2. Trade Setup – Conditional Bearish Opportunity
✅ Trade Plan:
Wait for breakdown of the rising support line.
After breakdown, wait for a re-test of the broken support zone (~₹1975–₹1980).
Look for bearish confirmation via a candlestick pattern (engulfing or strong rejection) on the 15-min or 1-hour timeframe.
🚨 Entry Trigger:
Only enter short if re-test holds and price starts reversing.
📉 Stop Loss:
SL should be above the re-test high (around ₹1990–₹1995).
🎯 Target:
Profit booking zone: ₹1910–₹1920.
Potential R:R: 1:2, 1:3, or even 1:4 depending on entry.
3. Why This Setup Matters
Trend exhaustion is visible near the upper resistance of the channel.
A clean breakdown + re-test gives a low-risk entry.
The 200 EMA lies near the target zone, providing confluence for mean reversion.
4. What If There’s No Breakdown?
If price respects the support and bounces again, no trade should be taken on the short side.
In that case, look for possible bullish reversal signals back toward channel resistance — or stay neutral.
5. Final Thoughts
This is a highly conditional setup — and patience is the key. Don’t jump the gun. The best trades happen after confirmation.
🔔 What to watch this week:
Breakdown below ₹1975 support
Re-test and rejection from ₹1975–₹1985
Confirmation candle (bearish engulfing)
Only then consider a short trade toward ₹1910 with a well-placed SL.
Plan your trade. Wait for structure. Trade only when the market shows its hand.

BTCUSD - 1H. TECH.In this trading idea, we are reviewing the last price movement of Bitcoin/USD
I hope this video analysis will have a good and positive effect on your trading perspectives!
Wishing you profits in your trades.

Huge Ready BTCAs we learn at start, trend is your friend... :)
Here is our friend, singing as some good song.
Thank you.
Wishing you great week! :)

GBPUSD TECH.Hello everyone.
First of all, in this week, I feel so bearish :D
The market may seem very soon so bearish, if after we will have some downfall very soon...
I hope we will get in some profit situation, if the price will enter this "white break lined colored" channel... Because after that, the price may move many times there in that channel...
So, what we can wait in this situation is when the price will go down and starts making some sideways trend and will get horizontal trend...
Thank you!
Have a Profitable Day! ^^

BTC, where we can setup our sell positions.Hello, dear traders! It's Nika again.
I want to share this beautiful pattern and tell you some about its meaning...
---
So, as we see here, we have this "triangular-shaped uprising pattern".
We got this pattern with its own few supporting and formatting levels.
Almost all of them are marked on our chart!
---
The "usage" of this may be something like this...
First, we may see the price testing an important price level of pattern 96,000,00 very soon...
---
After, if the price continues checking support levels below, we may also see the 91 & 89 K price levels.
You will profit from this price movement only if the price goes this way. :)
---
Wishing you a happy trading day and much more success in your trades!
---
If you have any questions, please comment or send a message.
Thank you!

Gold Pullback Entry Opportunity Gold resumed its rally, sparked by recent tarrif news. Price is pulling back at the moment and has entered an sweet spot where we can confidently take our first low risk Buy.
BUYING HERE BECAUSE
1. We're entering into a low volume area, which is also in line with an FVG on the 1hr chart
2. When a new uptrend starts, i like to buy first 2 instances price pullback to bounce from my trend cloud indicator We didn't get a perfect bounce as it has broken below it, but i'am still buying regardless due to my first reason above about the low volume gap.
PROFIT TARGET
Setting my profit target to my trusted Exofade peak. As long as the uptrend continues, Exofade peaks will ALWAYS get taken out. That why i love this indicator, and its free. It's my gift to y'all :) . Just search for it in trading view indicators.

Bull market scenario LITECOINAt this period, I'm speaking about LITECOIN, which currently has one of the strongest bull-looking charts on cryptocurrency!
We may see the price testing Fibo's higher levels very soon...
A bull market may begin, so I recommend focusing on higher price markings...
On another market, like BTC, Ethereum, or Pepe, we do not have vivid bull pictures.
That was one of the reasons for making this trading analysis...
Enjoy!

EUR JPY TECHHello dear traders :) It's time to share my new tech!
As we see here we have many reasons to think its ok position to open Long EURJPY
We got a strong uptrend here. We have 16 days LONG strong up channel in this pair. also a nice support point inside.
Our trades price target is near +60 pips (Take Profit).
If you have any Questions? Ask me!
FxCROWN :)
Thank you

BTC Price SpeculationUpdating my projections that I about 1 year ago. Here is my new speculative outlook on the BTC price over the remainder of 2025

[INTRADAY] #BANKNIFTY PE & CE Levels(17/04/2025)Today will be gap down opening expected in index. After opening if banknifty starts trading below 52950 level then downside movement possible upto 52550 level. 52550 level will act as a strong support for today's session. Any downside rally can be reversal from this level. Upside rally expected if banknifty starts trading and sustain above 53050 level. This upside rally can goes upto 53450+ level.

SOLUSDT | Elliott Wave Projection – Next big Move Incoming 50%+BINANCE:SOLUSDT
The chart is probably currently developing a five-wave impulsive structure (1)-(2)-(3)-(4)-(5), suggesting a potential bullish movement towards the 174-175 USD resistance zone before a larger correction unfolds.
📈 Bullish Setup:
- A corrective A-B-C structure seems complete, with a potential impulsive wave (1)-(5) forming.
- Price is reacting at a strong demand zone, initiating Wave (1) upwards.
- Possible target for Wave (5) lies near **174-175 USD**.
📉 Bearish Continuation Afterwards
- After reaching the projected high, expect a sharp rejection and reversal.
- The final bearish target lies within the "End of Bear" zone (~108-109 USD).
---
### 🔹 Key Levels to Watch:
✅ First Bullish Target: ~174-175 USD
⚠️ Critical Support Zone: 108-109 USD
---
### 📌 **Trading Plan:**
1️⃣ Long Opportunity: If price respects the current support, target Wave (3)-(5) completion near 174 USD.
2️⃣ Short Confirmation: If price rejects at resistance, a larger bearish wave is expected.
3️⃣ Final Bear Target: 108-109 USD zone for possible long-term support.
🚨 Risk Management:
- Stop-loss below 111 USD for longs.
- Wait for confirmation before shorting after rejection.
💬 What do you think? Will SOL hit 175 USD before the final drop? Comment below!

[INTRADAY] #BANKNIFTY PE & CE Levels(02/04/2025)Today will be slightly gap up opening expected in index near 51000 level. After opening it will face strong resistance at this level and expected reversal direction towards the 50550 level. This downside rally can extend for further 400-500+ points in case banknifty starts trading below 50450 level. Any bullish side rally only expected if banknifty starts trading and sustain above 51050 level.

$TON Price Surge: Can Grok AI Drive the Next Breakout?Elon Musk’s confirmation of Grok AI’s integration into Telegram is a game-changer for Toncoin, enhancing the utility of projects built on the CRYPTOCAP:TON blockchain. This news coincides with TON’s recent breakout from a falling wedge, signaling potential bullish momentum as it approaches the critical $4 resistance level. A decisive break above this mark could push the price toward $5.55.
Market sentiment remains optimistic, with Toncoin’s Open Interest reaching $176.23 million. However, liquidation data reveals more long positions being wiped out than shorts, indicating volatility and potential corrections. While bullish sentiment prevails, traders should watch for sustained support above $4 to confirm TON’s continued rally.

Bitcoin’s Next Move: Falling to $79K?This detailed technical analysis of Bitcoin (BTC/USD) on the 1-hour timeframe highlights a Rising Wedge pattern, key support and resistance levels, a trade setup, and projected price movements. The chart suggests a bearish breakdown, and traders can use this analysis to make informed decisions.
1. Understanding the Chart Pattern – Rising Wedge Formation
A Rising Wedge is a bearish reversal pattern that occurs when the price moves upwards within two converging trendlines. The slope of the lower trendline is steeper than the upper trendline, indicating weaker bullish momentum and an increasing probability of a downside breakdown.
📌 Key Observations:
The black solid trendlines outline the wedge pattern.
The price action remained inside this wedge from March 11 to March 26, 2025.
A breakdown has now occurred, confirming bearish momentum.
🔺 Why is this Bearish?
Rising Wedges are considered distribution patterns, meaning buyers are losing strength, and sellers are gradually taking control.
The price fails to make aggressive new highs and instead grinds upward weakly.
Once support is broken, a strong sell-off usually follows.
2. Key Chart Levels – Support & Resistance Zones
🔵 Resistance Level (Upper Bound of Wedge & Supply Zone)
The red arrow marks a strong rejection at $88,500 - $89,000, which acted as a major resistance level.
This zone has seen multiple failed breakout attempts, signaling that sellers dominate this area.
Stop-losses for short trades should be placed above this resistance zone.
🟢 Support Level (Lower Bound of Wedge & Demand Zone)
The wedge's lower boundary previously acted as strong support until it was breached.
The blue highlighted box represents a demand zone around $81,000, where buyers previously stepped in.
Losing this level could trigger a much stronger bearish move.
3. Breakdown Confirmation & Trading Setup
With the wedge broken to the downside, we now look for a confirmed bearish setup to enter a trade.
📉 Bearish Confirmation:
✅ The price broke below the wedge’s lower boundary, signaling a reversal.
✅ A retest of the broken wedge trendline confirms the breakdown.
✅ The price is now showing lower highs and lower lows, indicating a new bearish trend.
🎯 Trade Setup – How to Play This Move?
🔴 Entry for Short Position:
Enter short between $86,900 - $87,200 after confirming a rejection at the broken trendline.
🔵 Stop Loss:
Place a stop-loss above $89,282 to protect against a fakeout.
If BTC closes back inside the wedge, the short setup is invalidated.
🟢 Target 1: $81,000 – This is a key demand zone, and price might temporarily bounce here.
🟢 Target 2: $79,031 – This is the next strong support level, making it a final bearish target.
⚠ Risk Management Note:
Adjust position size based on risk tolerance.
Be mindful of short squeezes (where price temporarily spikes before continuing lower).
4. Expected Price Movement – Bearish Projection
🔮 The dashed black lines on the chart indicate a likely price pathway:
1️⃣ A breakdown below the wedge, followed by a minor retest of the broken trendline.
2️⃣ A continuation toward $81,000 (support level).
3️⃣ A small bounce before further decline.
4️⃣ The price reaching the final target of $79,031, where buyers may start accumulating again.
📌 If Bitcoin breaks below $81,000 with high volume, the bearish trend will likely accelerate.
5. Market Psychology & Trading Strategy
📌 Why This Setup Makes Sense?
The market exhibited exhaustion at the top of the wedge.
The break-and-retest confirms seller dominance.
The lower highs & lower lows show bearish momentum.
🚀 Alternative Bullish Scenario?
If BTC reclaims the wedge and breaks above $89,000, then the bearish setup is invalid.
A close above $89,500 would signal strong buying pressure and potential bullish continuation.
6. Conclusion – What to Watch Next?
🔎 Key Points to Monitor:
✔ Retest & rejection at $87,000 – $88,000 (confirming bearish momentum).
✔ Break of $81,000 to signal continuation toward the target.
✔ Stop-loss protection above $89,000 to manage risk.
📊 Final Thoughts:
The Rising Wedge breakdown suggests a shift from bullish to bearish sentiment.
This is a high-probability short trade with well-defined entry, stop-loss, and targets.
Traders should wait for price action confirmation before entering trades.
Would you like any refinements, or do you need further trade ideas? 🚀📉

BTC/USD Trading Analysis – Double Bottom & Rising Wedge BreakoutThis BTC/USD 4-hour chart showcases a potential bullish breakout setup based on technical patterns, key support and resistance levels, and price action analysis. The chart suggests a trend reversal following a downtrend, with signs of bullish momentum building up.
Let's break down the full technical analysis, covering the chart structure, key levels, price patterns, and trading strategy.
1. Market Structure & Identified Patterns
A. Double Bottom Reversal – Strong Bullish Signal
A double bottom pattern has formed, which is a bullish reversal signal that indicates the end of a downtrend.
This pattern consists of two significant low points (Bottom 1 and Bottom 2) near the $80,000 - $81,000 support zone.
The pattern confirms strong buying interest at this level, preventing further price drops.
A breakout above the resistance level would confirm the pattern’s validity, signaling a move toward higher targets.
B. Rising Wedge Formation – Potential Bullish Breakout
The price action is consolidating in a rising wedge, forming higher highs and higher lows within a narrowing range.
A rising wedge often suggests a potential breakout.
Since this wedge forms after a double bottom, the breakout is expected to be bullish, rather than a bearish breakdown.
If the price breaks above the wedge’s upper trendline, it will confirm a strong upward momentum.
2. Key Support & Resistance Levels
Support Levels:
Major Support Zone (80,000 – 81,000):
This level has been tested twice, confirming buyer strength.
It serves as the foundation for the double bottom pattern.
Stop Loss Level (72,921):
If the price drops below this level, it would invalidate the bullish setup.
This level is strategically placed to manage risk and protect against potential downturns.
Resistance Levels:
First Resistance Zone (95,000 – 100,000):
This is a critical level, as the price has faced multiple rejections here.
A breakout above this zone would confirm a strong bullish trend continuation.
Take Profit Targets:
TP1 (108,481): The first take-profit target aligns with previous highs and is a logical point for partial profit booking.
TP2 (114,372): This is the second profit target, calculated based on Fibonacci extensions and historical price movements.
3. Trading Strategy & Execution Plan
A. Entry Strategy
To execute a successful trade, we need to wait for confirmation of the breakout.
Ideal Entry: After a strong breakout above 95,000 – 100,000, indicating bullish momentum.
Confirmation Factors:
Increased trading volume → Signals strong buying interest.
Candle close above resistance → Confirms breakout.
Retest of broken resistance as support → Strengthens bullish continuation.
B. Risk Management
Stop Loss Placement: Below 72,921, ensuring limited downside risk.
Risk-to-Reward Ratio: The trade setup aims for a 1:3 or better risk-to-reward ratio.
C. Potential Scenarios
✅ Bullish Breakout:
If BTC breaks and holds above 95,000 – 100,000, we can expect a rally toward 108,481 (TP1) and 114,372 (TP2).
❌ Bearish Rejection:
If BTC fails to break resistance, it could retest 80,000 or drop lower, invalidating the bullish setup.
4. Final Thoughts – What to Expect?
This BTC/USD 4-hour chart analysis provides a high-probability bullish trade setup, supported by:
✅ Double Bottom Formation → Strong Reversal Signal
✅ Rising Wedge Breakout Potential → Momentum Building
✅ Key Resistance Breakout Levels Identified
📌 Conclusion:
If Bitcoin breaks above 95,000 – 100,000, expect a major bullish move toward 108,481 and beyond. However, if resistance holds, we might see a retest of lower support levels. Risk management is essential for a successful trade execution. 🚀

GBP/USD LONGHi !
Based on the current price action and I have prepared 2 trades for next week.
First is a long position from 1.287 where is VAL , price has respected this area, making it a good level for initiating a smaller long position with limited risk.
Forward I am looking at 1.3 area and looking to scaling in after confirmation above 1.302 ensures that I participate in the trend continuation without overexposing prematurely.
Step 1: Small Entry at 1.287
Entry: Long position at 1.287.
Stop Loss: Below 1.2800.
Take Profit: Partial profit near resistance at 1.3000, or hold until breakout confirmation.
Step 2: Scale In After Breakout
Entry Trigger: Wait for price action to break and hold above 1.302 (confirmed by strong candlestick close or volume spike).
Entry Price: Enter larger position at 1.302.
Stop Loss: Below recent breakout level (~1.295).
Take Profit Levels:
First Target: 1.3200.
Second Target: 1.3400.
FX:GBPUSD

#NIFTY Intraday Support and Resistance Levels - 17/03/2025Expected gap up opening in nifty near 22500 level. After opening this is an important level for nifty. If nifty starts trading and sustain above 22550 level then expected upside rally upto 22700+ level. Downside reversal expected if nifty not sustain above level and starts trading below 22500. Downside 22350 level will act as a strong support for today's session.

PEPE/USD Bullish Breakout: Demand Zone Holds, Reversal in Sight?PEPE/USD has been gaining attention as it trades near a critical juncture. With the daily demand zone holding strong and signs of a downside channel reversal, the pair could be on the brink of a bullish breakout. In this analysis, we’ll break down the technical indicators and patterns that suggest PEPE/USD might be ready to reverse its downtrend.
Daily Demand Zone Holding Firm
One of the most significant factors supporting a potential bullish move is the respected daily demand zone. This area has provided strong support, acting as a floor for buyers to step in. A failure to break below this zone increases the probability of an upward momentum shift.
Key Support Levels: Highlight exact price levels in the demand zone.
Volume Analysis: Look for increased buying volume around these levels, which could signal accumulation by bullish traders.
What to Watch For Before Confirmation
While the technical signs are promising, traders should remain cautious. Key events to watch include:
Breakout Above Resistance: Identify the breakout level for confirmation
Retest of the Channel Top: Look for a retest and bounce as confirmation of strength.
Market Sentiment and Volume: Monitor trading volume and broader market sentiment.
Conclusion: A Bullish Opportunity?
The combination of a respected daily demand zone and a downside channel reversal pattern makes PEPE/USD a pair to watch. A confirmed breakout could set the stage for a bullish run, providing traders with an exciting opportunity. As always, use risk management and stay updated with the latest price action.

#NIFTY Intraday Support and Resistance Levels - 03/02/2025Gap down opening expected in nifty near the 23400 level. After opening if it's sustain above 23400 level then possible upside movement in nifty 23600 level. For today's session 23600 will act as a strong upside resistance for nifty. Major downside expected if nifty starts trading below the 23350 level this downside can goes upto 23150 level after the breakdown.

#NIFTY Intraday Support and Resistance Levels - 24/01/2025Today will be slightly gap up opening expected in nifty. Expected opening above 23250 level. After opening if it's sustain above this level then possible upside rally upto 23450+ in today's session. Any further downside movement expected below 23200 level.
