AMD: Is it a buy right now? Let's see what the charts say.Hello traders and investors! Let’s see how AMD is looking today!
First, in the 1h chart, it is doing a good bullish reaction. It seems we have a Rounded-Bottom after a massive sell-off, and this indicates that the bears are starting to get exhausted, and it is trading at discounted levels.
To me, AMD could hit the $ 124 again, however, I’ll set a target at $ 118.60 (the gap area, as evidenced by the yellow square), if it breaks the $ 110.57, and trades above it for a while, consolidating a reversal.
Trading above the $ 110 would be interesting because the market may see the last bullish leg just as a retest of the 21 ema to drop more again, aka Dead Cat Bounce.
What’s more, by breaking the $ 110 it has decent chances of breaking the 21 ema as well.
In the daily chart, we see that AMD is dancing around the 61.8% Fibonacci’s Retracement, and if it closes above it in the next few days, I’ll see it as a sign of strength. The 61.8% retracement is at $ 110 as well, reinforcing our thesis that this is the most important price level to break.
We can see the Gap in the daily chart too, and this is why I think it is a relevant target to work with.
I’ll keep you guys updated on AMD, so remember to follow me to keep in touch with my daily analyses!
Pricetarget

Geberit - GEBN• Triangle formation with a decreasing volume to the end of the formation
• Do we see soon a positive outbreak?
• Slightly increasing RSI but still under 50
• If we see a positive triangle outbreak price target appr. at CHF 656 which is close to the 50% Fibonacci Retracement

Bullish with 23% upside targetDDOG can get hot, and it has the setup to start big move from here.
Initial target = 166
Goal Target = 190
Look for test of downtrend breakout line around 153, if that doesn’t hold it has support around 147-150. Stop loss below 141.
Not Financial Advice or whatever.

Amplitude might be getting ready to breakout. Hello Friends!
Amplitude has declined by 70% from it’s highs. Back in February analyst had a price target of $40 and $60 for 2022. Currently is consolidating and a breakout can have its eye on two price targets.
Target#1: $27.50
Target #2: $33.00
After $33 a gap fill opportunity to $40 might be an option. But at this point, one step at a time.
As always thanks for your follows, likes, and comments. Let’s learn and grow together. Cheers!

Next target 50240ADX breakout will send it over 50k. Stop loss 41000.
Needs to clear some trend line resistance around 4600-4700.
Not advice.

Double Bottom Chart PatternCompany info
Wave Life Sciences Ltd., is a clinical-stage genetic medicine company that designs, optimises and produces novel stereopure oligonucleotides through PRISM. It is developing oligonucleotides target ribonucleic acid to reduce the expression of disease-promoting proteins or restore the production of functional proteins or modulate protein expression.
Both the WVE and AGTC in my other trade idea have the same sector. The main ETF for this sector is the Health Care Select Sector SPDR Fund. However, there is an issue. Both these stocks are near all-time lows while the ETF is near an all-time high. So, the stocks are lagging behind. So, if you are going to trade these stocks be wary that they are going against the general market trend and there could also be other reasons as to why these stocks are not following the market.
Double Bottom Analysis
Type:
Eve and Adam
Length between Valleys:
5 weeks
Volume Trend:
Larger on the left valley
Breakeven Failure Rate:
12%
Throwback Rate:
65%
Average Rise:
50%
Price Target:
3.66
Percentage Change:
51%
The double bottom analysis for this stock is the same as for AGTC. The length between the two valleys is within the ideal range at 5 weeks. Concerning volume , it is larger on the left side but not significantly. There does seem to be a downward trend of volume going from the left valley to the right valley. But this trend begins at the end of the left valley at the price spike that follows. The great thing about this patterns is, the stock is very close to their all-time lows. The left valley low was the all-time low. This means the stock has great upward potential. However, as stated above, the stock is not following the general market trend. Also, the stock has been on a downward trend since its inception. Regardless, the pattern is following all ideals even though the stock isn't. So, the pattern strengths are 3/5.

Double Bottom Chart PatternCompany info
Applied Genetic Technologies Corporation is a clinal stage biotechnology company that develops transformational genetic therapies for patients suffering from rare and debilitating diseases.
Sector analysis for AGTC
Both the AGTC and WVE in my other trade idea have the same sector. The main ETF for this sector is the Health Care Select Sector SPDR Fund. However, there is an issue. Both these stocks are near all-time lows while the ETF is near an all-time high. So, the stocks are lagging behind. So, if you are going to trade these stocks be wary that they are going against the general market trend and there could also be other reasons as to why these stocks are not following the market.
Double Bottom Analysis
Type:
Adam and Eve
Length between Valleys:
5 weeks
Volume Trend:
Larger on the left valley
Breakeven Failure Rate:
12%
Throwback Rate:
67%
Average Rise:
43%
Price Target:
3.79
Percentage Change:
111%
The length between the two valleys is within the ideal range at 5 weeks. Concerning volume, it is larger on the left side but not significantly. There does seem to be a downward trend of volume going from the left valley to the right valley. But this trend begins at the end of the left valley at the price spike that follows. The great thing about this patterns is, the stock is very close to their all-time lows. The left valley low was the all-time low. This means the stock has great upward potential. However, as stated above, the stock is not following the general market trend. Also, the stock has been on a downward trend since its inception. Regardless, the pattern is following all ideals even though the stock isn't. So, the pattern strengths are 3/5.

Double Bottom Chart PatternCompany info
Amazon.com, Inc. is a company that engages in the retail sale of consumer products and subscriptions internationally and North America. It sells merchandise and content purchased for resale from third-party sellers. The company also manufactures a range of electronic devices.
Sector analysis
The main ETF that tracks this sector is the Vanguard Consumer Discretionary ETF. Over the last four months, the ETF has been on a decline. Mainly led by inflation worries. AMZN has also been following a similar pattern. So, I would keep an eye on this ETF. If you see the ETF falling, you can expect AMZN to possibly follow suit.
Double Bottom Analysis
Type:
Eve and Adam
Length between Valleys:
5 weeks
Volume Trend:
None
Breakeven Failure Rate:
12%
Throwback Rate:
67%
Average Rise:
42%
Price Target:
3677.06
Percentage Change:
14%
The length between the two valleys is 5 weeks. This is ideal. As it means the strength of this double bottom could potentially be stronger. There isn’t a volume trend for AMZN between the two valleys. The volume seems to be higher on these two valleys compared to prior price movements but that’s it. Also, just like the stock above, AMZN is near its all-time high which could pose some issues concerning potential upward movement. However, this is a major blue-chip stock. This means two things. The positive is that the stock is are already near the confirmation line and has great volatility to break through and maybe reach the price target. The negative is that you will have to look out for any news concerning this stock to see if there is something that could lead to a throwback or a breakeven. Furthermore, as stated above, the stock has been on a decline along with the ETF, so there could be a rebound upward and this double bottom could be profitable, or the stock could rebound now and fall downwards after hitting the confirmation line that can act as a resistance level. So, I would pay attention to the ETF. Watch any news concerning Amazon and inflationary issues so gauge if the stock will break through the confirmation line and if this chart pattern will work. Henceforth I am giving this double bottom a pattern strength of 2/5

Bitcoin is getting left behind Gold and DXYHello Friends!
Going into the weekend, it can go either way.
On the bullish side, Bitcoin MUST take out $45K 1st. Then I see BTC moving up to test 2 levels ($48.5K and $53K).
On the bearish side, if Bitcoin FAILS $37.7K then I see potentially 3 downside targets ($34.4K,$32.9K, and $29.4K)
As always thanks for your follows, likes, and comments. Let’s learn and grow together. Cheers!
*This information and publication is not meant to be, and do not constitute, financial, investment, trading, or other types of advice. Do your own research.

Double Bottom on Bitcoin Ready to Break!Hey Traders,
As you can see on the Daily Chart of Bitcoin, the price action has formed a price target that gives us a target of $65,000! I think this will break out soon...
Safe trading,
-Pulkanator

***AAPL Price Target Prediction of $230 by Oct 2022***Based on previous price action I see price for aapl to move 40% over the next 180 days after April 8th 2022. Ending at $230 by Oct 2022.
by iCantw84it
02/22/2022

VRM setupHello Friends!
VRM has been on a downtrend for a while. Now it’s oversold on the daily, weekly, and monthly. It’s been consolidating in the $7 to $8 zone. A move past $8.18 with volume might setup a nice move to $9.77 and then $11.64.
Be careful with this trade, especially when their earnings is around the corner (Feb. 28).
As always thanks for your follows, likes, and comments. Let’s learn and grow together. Cheers!

$TSLA bullish momentum confirmation so Tesla started to have huge volatility cause we visited our strong support above the 777$, now if we never visited this level again this will confirm that will see price of Tesla go to all time high, however we have one resistant to confirm our bullish momentum which is at our descending line , and we have to close at least 1h candle above our level, we might see bit of rejection today, if that happens we should hold this time above 884 to confirm that we will break or resistant near the 949$.

Roblox looking good at these levelsHello Friends!
I’m liking Roblox here at these levels. The average analyst PT for 2022 is $105. IMO this is set up nicely for a short term trade and/or long term hold.
My price targets for the short term are…
#1: $71.90
#2: $77.82
#3: $85.96
Support price is $54
As always thanks for your follows, likes, and comments. Let’s learn and grow together. Cheers!

Apple 15M ChartPrevious Double Bottom Pattern (Invalidated)
New Pattern:
Symmetrical Triangle
Price target if breakout to the upside: $168- $169
Price Target if break to the downside: $150- $151
If Price Breaks Above Top of Triangle: Wait for a Retest (to confirm support), Then Enter Long
If Price Breaks Below Bottom of the triangle, Wait for a Retest (to confirm resistance), Then Enter Short
Note:
Tomorrows Fed meeting could have either positive or negative implications for the Market in General.

BTC BREAKOUT PT Expecting a breakout soon.
Double bottom just happened on daily chart. Expecting continuation pattern.
Top of wedge I expect to see ~$74K
Breakout expected and $104k price target end of June - Early July.
Just my personal opinion. Not financial advice. I can’t tell the future.

BITCOIN CUP & HANDLE PRICE TARGETCup and handle pattern forming.
Price heading towards $47,500 around January 15.
Expecting to text the 100 day EMA at $50,446 around the 22nd of January.
Not financial advice, just my thoughts.

Good Time to Sell Sand (Aim $4.2)SAND/USTD is forming a head and shoulder pattern at 1h timeframe, good time to sell sand after confirming the breakout at the neckline and aim for $4.2

40K the price to hold for BTCBitcoin is currently at a pivotal point. If we can hold the 40k lvl, a bullish move upwards is possible. In that case, we should try to gain the previous range (45K).
And a rejection of the previous range is also possible.
if we can't keep the 40k lvl and close a (at least a 4 hour) candle below it, we can see a fast move towards 35/36k.
The VPVR shows that between 45k and 36k very little handles volume has taken place.
Around 36k we see the volume increases drastically, this shows where there may be support and where there is willingness to buy.
Let's wait and see...

VET/BTCDirectional Bias: Bullish
Pattern Type: Non-Directional
This pattern is comprised of three phases and looks a bit simular to a frying pan. There is the Lead-in Phase, the Bump Phase and the Uphill Run. The lead-in phase is the handle of the frying pan before a larger decline. Following the decline, The bump phase forms as the price forms a flat or rounded bottom. The uphill run phase is after the breakout. For this type of formation to be analyzed an arithmetic scale will need to be used.
Volume description: Volume is typically high at the beginning of each phase and decreases throughout each phase.
Measuring technique: The price target is the descending trendline drawn across the hihgs in the lead-in phase.

Bullish so long as 970 is support.My preference: Bullish so long as 970 is support.
My pivot point is 970.
Alternative scenario: the downside breakout of 970 would call for 827 and 743.
Comment:
The RSI is above its neutrality area at 50.
The MACD is positive and above its signal line.
The configuration is positive.
The stock is trading above both its 20 and 50 day moving average,
Stay vigilant -
Advanced_Analyst

Fortescue Metals: as long as 18.17 is support look for 21.54Alternative scenario: the downside breakout of 18.17 would call for 17.2 and 16.29.
My pivot point stands at 18.17.
My preference: as long as 18.17 is support look for 21.54.
Comment:
The RSI is above its neutrality area at 50.
The MACD is positive and below its signal line.
The stock could retrace in the short term.
Moreover, the stock is trading above both its 20 and 50 day moving average (respectively at 18.88 and 16.89).
Trade Safe -
Jimster45

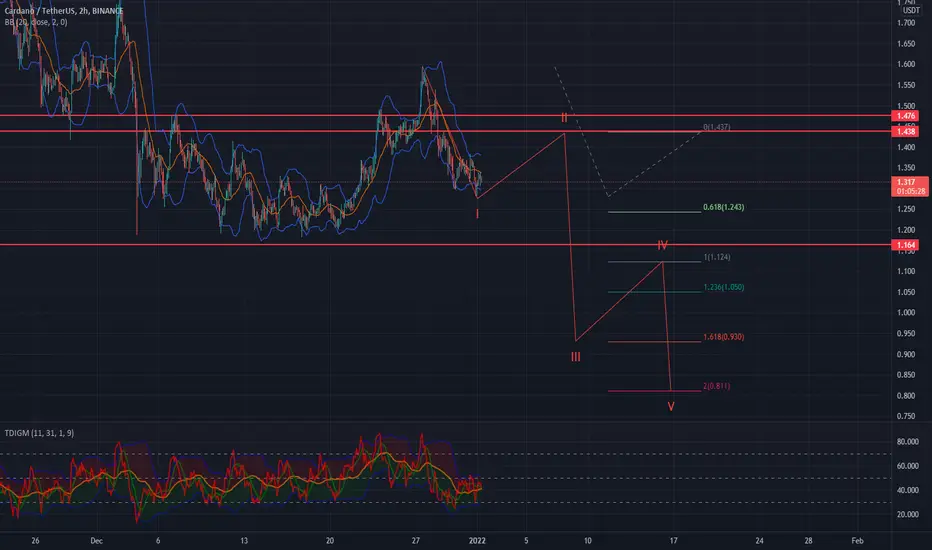
Ada below 1$ After a shallow pump to 1.43 $ the carnage begins ! , bitcoin will drag all alts down soon !