Profile

USDJPY Intraday Strong resistance has changed to good support. Pretty heavy volumes got accumulated around the 113.06 area. Then a really strong buy-on started. When the price makes it back to this level I expect a reaction, because those strong buyers are most likely to defend their buying positions and to push the price upper again. The biggest Volume in chart is your the biggest advantage before BIG players...

AUDJPY Daily support Lot of confirmation for this long level. ( support 1 )
1. There is significant volume cluster
2. So many rejection at history
3. Level was very good support
So price action with Volume profile... Combination what i try explain all my members!

USDJPY long levelsI said it at the beginning of my book – indicators are quite useless. Big institutions don't care about them. Also, standard indicators work only with "price" and "time". For that reason the information indicators provide are always delayed.
Novice traders need to accept the fact that there isn’t a magic combination of indicators that would make good and profitable trading system.
Only Volume profile can show you TRUE Support and resistance. Because combinate more information about how market iniciated moved. Watch my intraday levels from my Members section..
Take profit = 10 pips
Stop loss = 12 pips
Happy trading
Dale

NZD/CAD short from 0. 8767This trade idea is based mostly on a Trend setup. There is a strong downtrend on the NZD/CAD right now. In such case, I look for volume clusters that were created within the downtrend. Such a volume cluster as around 0.8767 shows us that sellers were adding to their selling positions there and that they continued pushing the price lower from this area. When the price makes it back to this area again (pullback), then those sellers are likely to defend their positions and push the price lower.
Another confirmation of this level is as Support becoming resistance Price Action setup. Quite near our short level, there was a pretty strong rejection of this level in the past – marked in blue. This indicates that it was a strong support in the past. When the price went through this support then it became a resistance.
There is one more thing about this level which I like – it is the pinbar candlestick (I marked it in the red rectangle). This pinbar shows us aggressivity of sellers, which again confirms the idea of a short trade from 0.8767.

Trend setup - Volume cluster This trade idea is based mostly on a Trend setup. There is a strong downtrend on the NZD/CAD right now. In such case, I look for volume clusters that were created within the downtrend. On the biggest volume cluster are more likely to respond by correction. This is reason why i wait for returning market to this volume cluster. How i set profit and target can you read in my NEW BOOK.

AUD/CAD short from 0.9616This short trade idea is based on the Volume accumulation setup. I think that a lot of short positions got accumulated in the heavy volume area around 0.9616. I think this because the price shot aggressively downwards from this place. When the price makes it back there I expect that sellers will be defending their selling positions and that they will push the price downwards again.
There is also one more trading setup present there. It is called the “Open-drive” and I write about it in my new book.

Power of VA´s When trading the Value areas, knowing the direction of the price is equal important as where is the volume been stacked...
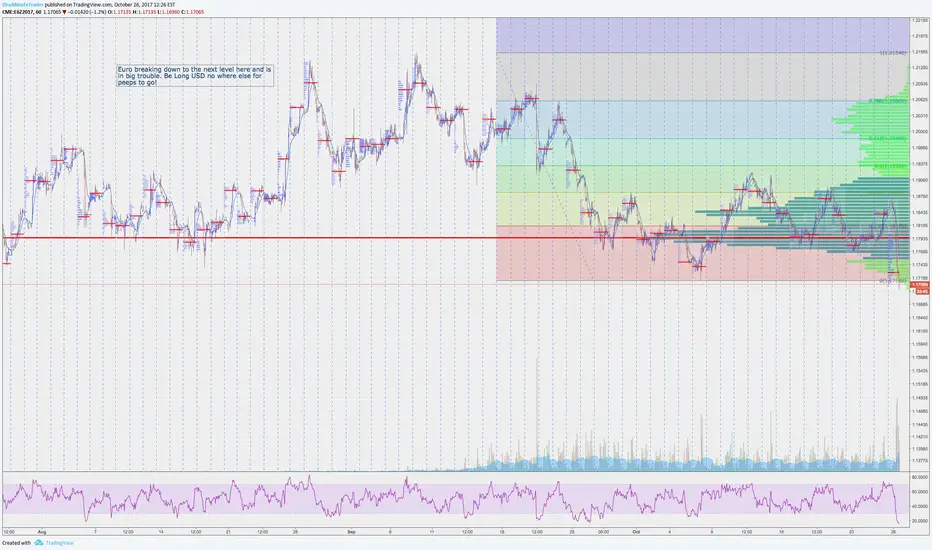
In the following image as we can observe, the developing VAH was broken to the upside the prices supported it self in a HVN (High Volume Node) and at this point the price let know that there was no intention to bring prices down, on the contrary it wanted to test prior swing high and also the 127% Fib extension.
JD

EURUSD long magnet zone You can see strong side way price action after trend up... There was a volume accumulation area from which strong buying activity started. For that reason I think that the volumes accumulated in this area were volumes of strong buyers. I waited for pullback to this area. When market go back to this area strong buyers will be defend their positions. I think EURUSD 0.15% is ready for correction higher. Because we are in the strongest Volume accumulation of THE LAST YEAR!! This is second reason why i want search long position too.

ADA / Bitcoin strong magnet S/R zoneStrong volume cluster is perfect magnet for the market... This is reason why i still wait for attack one of this magnet level for the pullback. Price 0.000022 is so important level for continue uptrend. Therefore do not overlook this level and watch reaction on this STRONG MAGNETO LEVEL!!
BY THE WAY : On side way price action and acumulation zone was excelent oportunity go short at price 0.00002931 ( red line )

EUR/CAD - Experimenting with MPPrice currently forming a Hammer candle at the POC from 3 days worth of data in a High Volume Accumulation region. Looking for longs


USDCHF ShortDescription on the chart. Multi - time frame analysis.Market Profile, Volume , Supply and Demand . This is pre - plan. I have set alarm and will wait how will market makers behave at that level when price arrive there.

EURCHF ShortMulti - time frame analysis.Market Profile, Volume , Supply and Demand . This is pre - plan. I have set alarm and will wait how will market makers behave at that level when price arrive there.

AUDJPY ShortMulti - time frame analysis.Market Profile, Volume , Supply and Demand . This is pre - plan. I have set alarm and will wait how will market makers behave at that level when price arrive there.


$GE Leading the Way againCycles come and go, and no one is talking about where $GE is Really leading us NYSE:GE

AUDCAD LongDescription on the chart. Multi - time frame analysis.Market Profile, Volume , Supply and Demand . This is pre - plan. I have set alarm and will wait how will market makers behave at that level when price arrive there.


EURUSD ShortMulti - time frame analysis.Market Profile, Volume , Supply and Demand . This is pre - plan. I have set alarm and will wait how will market makers behave at that level when price arrive there.

AUDCAD LongMulti - time frame analysis. Using mix of Market Profile, Volume, Supply and Demand, Volume.
This is preplan Im trading. I have alarms in my platform and watching how market makers begave on specific level
When price arive there.