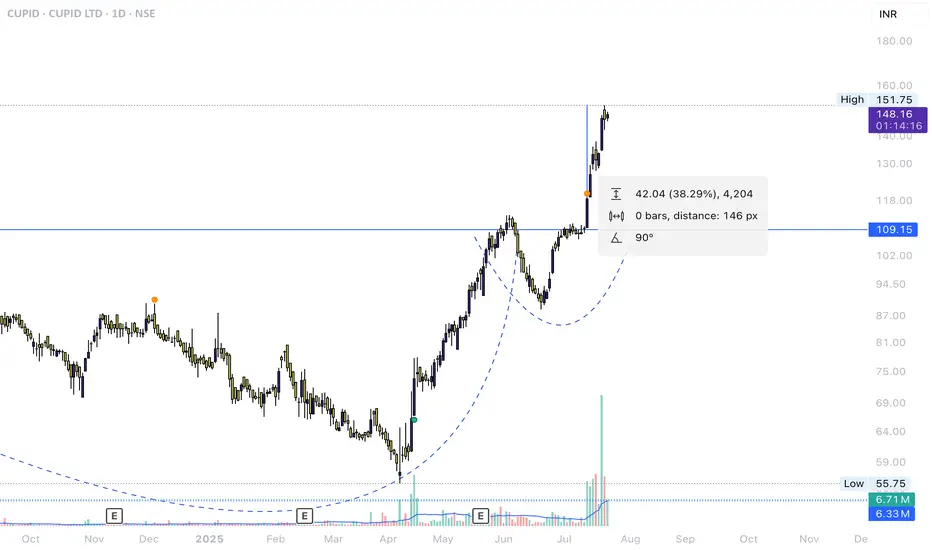
CUPID.NSE ReturnsNSE:CUPID Chart shared idea just 1 week ago.
Breakout trading worked perfectly, More rise can be seen if the stock consolidated near the recent highs and breaksout.
Profitabletrading
Mount Fuji Series- Old runners waking upMount Fuji Series- Old runners waking up -
TARC - started running after 50-70 levels.. hope getting ready again.
Realty company with good land holding. Funda strong company.

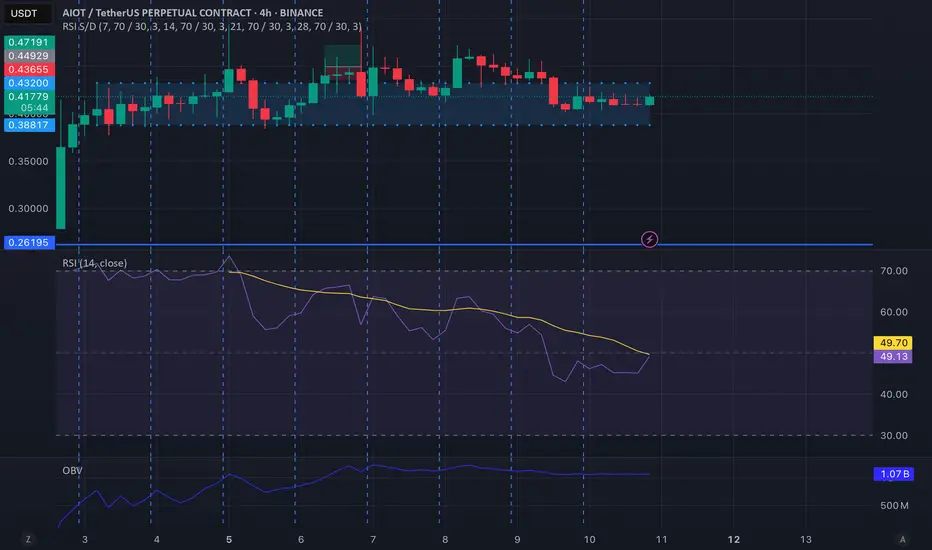
WHAT A GEM!!!AIOT/USDT is ready to take of !!
Sellers try to take over but all of them will be liquidated cause life is unfair...
We though ,we will place ourselves in the right direction and we will open long position..
In case it will drop 20% we will buy more as this coin is on uptrend..
Our price target will be 0.6 with 2X leverage..Hope you will follow as well as we are here to make a fortune for all of us!
We will keep you updated for more!
PARTI IS PREPARING FOR PARTYHi everyone ,
PARTI is about to make a huge party .
Our indicators shows that the coin is undervalued by far and sellers start coming in..
That's mean that this coin is about to explode..
It's a good idea to manage your risk accordingly and be prepared to book your profits at 0.88 area! It might go higher as ALT coins are easy toi be manipulated.
At this point you have to be prepared for a 20% drop and if this happens it will be a perfect timing to buy more!!!
We will keep you updated when our price target will meet, it might go higher!

FLOT 1D Long Investment Trend TradeTrend Trade
+ long impulse
+ T2 level
+ support level
+ 1/2 correction
+ biggest volume 2Sp+?
Calculated affordable stop limit
1 to 2 R/R take profit
Monthly countertrend
"- short impulse
+ volumed T1
+ 2Sp+
+ bigger volume on test"
Yearly context
"+ long impulse
- correction"

EURUSD Potential Shorts (Technical Analysis)Overall Context:
The dollar's been flexing its muscles lately, and EURUSD is feeling the pressure. We saw some crazy gaps when the markets opened on Monday morning – a sign of shaky liquidity, which usually snaps back. But with the trade war rumbling on, who knows?
As traders, we've got to stay prepared, expecting a correction but ready with our contingency plans if it doesn't happen. Let's dive in -
Technical Outlook:
Failure of the previous accumulation cycle - Classic Wyckoff stuff, cycles run their course.
A re-distribution is likely on the horizon, especially if the lower timeframes agree with the bigger picture. (Fractally, we need to see the LTF accumulation fail and for distribution to align with the HTF sentiment and cycle).
Price has broken to the downside and has created multiple lower highs.
Trading below the 200 EMA and has recently tested and bounced of the 50 EMA (at a correlating level of supply)
Keep in mind that USDJPY and EURUSD are inversely correlated and are currently in line - While the inverse correlation is a significant factor, it's not the only thing that influences these currency pairs. Interest rates, economic data, and global events can also play a role and we know how that story looks at present so this is just additional confluence for us.
Potential Scenarios & Probabilities:
Scenario 1 (High Probability) - Price will pull back into the supply and drop from there.
Scenario 2 (Medium Probability) - Price will continue to plummet and break structure to the downside.
Trading Considerations:
If price fills the gap and reaches supply levels above, you should wait for bearish confirmations to get involved.
If price drops past the previous low, identify new levels of supply and trade accordingly. (I'll try to post an update if this happens).
Final Notes:
Strong technical picture but this week has a lot of upcoming economic events (NFP, anyone?).
With the Tariffs imposed so close to the NFP release one can only assume there will be a power play by the Trump administration which we may not see coming.
All we can do for now is follow the money flow to stay in the know!
Disclaimer: This analysis is for informational purposes only and does not constitute financial advice. Trading involves substantial risk and may not be suitable for all investors. Conduct your own research and consult with a financial advisor before making any investment decisions.
OANDA:EURUSD TVC:DXY FX:USDJPY

EURUSD Buying Trade Idea from 1.0230-1.02135EURUSD Buying Trade Idea from 1.0230-1.02135
EURUSD Buying Trade Idea from 1.0230-1.02135 at the price level and the idea more empower when the market strongly break the 1.02722 zone.
In the recent days at Friday after the Gold create new High (All time) the other major pairs fall and now traded at the based price.
Market will cover the opening gap this morning Monday Feb 3rd 2025.
The buying setup;
Buy range: 1.0230-1.02135
Stop Loss: 1.01639
Take Profit L1: 1.03456
Take Profit L2: 1.04320
Take Profit L3: 1.05046
Take Profit L4: 1.06155
Use 1% of your account balance at the risk on the setup.

637% BTC Profit Secured Ride the Crypto Wave with Us !!!!🎉 Profit Alert!
Our BTC Long Position has delivered exceptional returns, booking 637% profit (20x leverage) on a partial exit. If you've been following my insights and trade setups, you’re likely celebrating significant gains by now! 🪙💵
If you haven’t followed us yet, you’re literally missing out on life changing opportunities! i would say 😎
This is the power of disciplined trading and precise analysis. But we’re not done yet! The trade is still active with the remaining position, safeguarded by setting the Stop Loss (SL) at the Breakeven Price, ensuring risk free potential for further gains.
This is what we do consistently identifying opportunities and executing strategies to maximize profits. If you’ve benefitted, it’s time to spread the word! Share our page with your network, boost this post, and help us grow this community of successful traders.
Stay tuned for more high quality setups and actionable insights. The journey to financial success doesn’t end here it only gets better. 🚀
Here is where Traders Thrive
Thank you for your continued trust and support! 💪

Best Intraday stocks technical analysis | 27 Dec 2024Technical Analysis of Moving average stocks (20/Dec/2024)
follow us for more updates and information
message us for any stocks related information.

cup and holder pattern for shibashiba is making an interesting and profitable pattern that u can't miss it.
first of all shiba dumped for 70% and it makes the cup
then dumped again to create a holder. as u can see my trigger I'll enter in there.
here we have 3 kind of tp
1:fibo:u can get ur profit by fibo.
2:measure trding: u can see it.
3: max tp:it can touch the piror high. maybe like FO or ENG but with low possibility.
don't forget to tell me ur idea and boost this post.
bye {;

Best Intraday stocks technical analysis | 20 Dec 2024Technical Analysis of Moving average stocks (20/Dec/2024)
follow us for more updates and information
message us for any stocks related information.

DEC 18 GBPUSD SELL TRADE ACTIVATEDThis is a classic move when you know wyckoff schematics ( supply and demand) . I am checking gbpusd since november, it was only this december that the movement gets slow motion. This was an evidence for me to go bearish once I had a validity in lower timeframe.
FAST FORWARD: Dec 12-16 MOVE was a confirmation for me to look for short trades, If you will notice here in my chart : order block was created (supply). I marked it as my POI , Look for validity and EQH---> sell limit activated with a beautiful 1:5RR.
(check chart for complete details) .
#wyckoffianttrader
#profitablesystem
#psychology.

Best Intraday stocks technical analysis | 19th Dec 2024Technical Analysis of Moving average stocks (19/Dec/2024)
follow us for more updates and information
message us for any stocks related information.

Best Intraday stocks technical analysis | 17th Dec 2024Technical Analysis of Moving average stocks (16/Dec/2024)
follow us for more updates and information
message us for any stocks related information.

Intraday stocks for trading (09/Dec/2024)Technical Analysis of Moving average stocks (09/Dec/2024)
follow for more updates and information

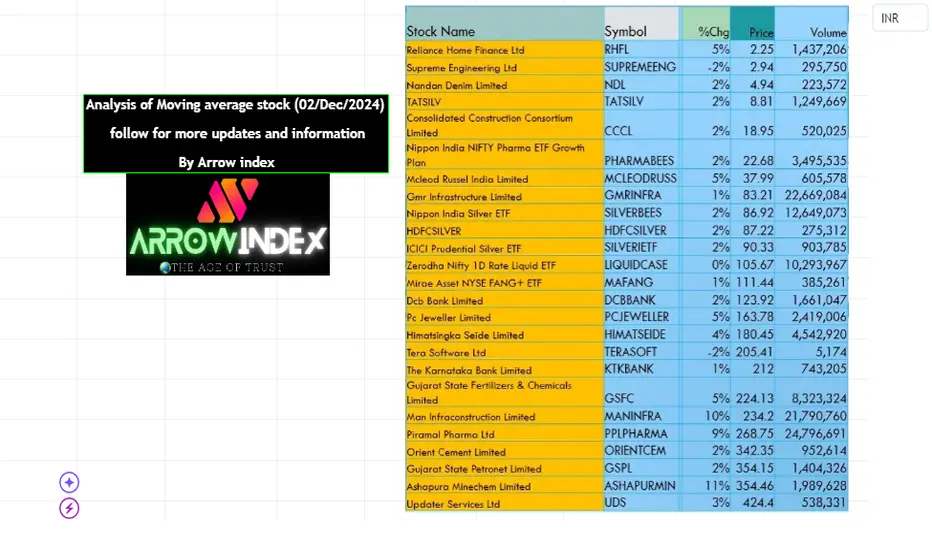
Analysis of Moving average stocks (02/Dec/2024)Analysis of Moving average stocks (02/Dec/2024)
follow for more updates and information
Analysis of Moving average stock for intraday (28/Nov/2024)Analysis of Moving average stock (28/Nov/2024)
follow for more updates and information

Analysis of Moving average stock (25/Nov/2024) Analysis of Moving average stock (25/Nov/2024)
follow for more updates and information

Analysis of Moving average stock (25/Nov/2024)Analysis of Moving average stock (25/Nov/2024)
follow for more updates and information

SPY LOVERS, BE READY ! This week, I decided to remove some objects I had in the chart history as references, which we’ve been analyzing, to make some space and clean up the chart a bit.
After reaching all-time highs, the price has naturally begun a retracement.
But what’s new in technical analysis?
Let’s analyze the price together:
In this case, I added an ascending channel where the price follows an upward sequence, bouncing between support and resistance.
Here’s the million-dollar question: How much further can the price drop?
If we look at the chart, I marked a very important line in red or maroon color at $575.12, which aligns with a resistance pivot and two indecisive candlesticks with identical volumetric bodies.
Often, indecisive levels are key to how the market makes sudden decisions after an indecisive candle. In this case, if we pay closer attention, the indecisive level marked in maroon color is positioned exactly at the support of the ascending channel. This suggests how far the price might fall, and we could potentially see a rebound. For me, this would be the primary scenario.
But...
If the price breaks through this level, my second scenario would be a drop to the order block. Since this level has acted as both support and resistance in the past, I can validate it as my secondary inflection zone or "Inflection Block."
You might wonder: What on earth is an inflection zone?
As I’ve mentioned multiple times and explained in some of my analysis, inflection zones—or points of inflection—represent moments where there’s a significant change in the price’s direction within a trend, whether in a market, an asset, or an economy.
On a trading chart, an inflection point is the spot where the chart changes direction or marks an important decision.
An inflection zone can also be a historical area on a chart. As we can see, my order block is already being considered an inflection zone because the price has historically made key moves within it. and i called it "Inflection Block" (See the white arrows).
Thank you for supporting my analysis.
TRADE SAFE
Best regards!

Tejas Network ? Can it give profits ?Good fundamentals, Great stakeholders, Overall discounted market, Stock near least resistant line. Odds are more that we make money on this trade.

Reversal into downtrend setup taken with DJ30 today explainedIn this video, I walk you through my entire thought process during today's trading session. You'll learn how I selected the pairs and executed three key trades:
* NAS Uptrend Continuation long (BE)
* Silver Parabolic Reversal Short
* DJ30 Reversal into Downtrend
I'll also provide a detailed explanation of the Reversal into Downtrend setup, helping you understand how to apply this strategy in your own trading. Reversal into downtrend is one of my personal A+ playbook setups. Don't miss out on these valuable insights and tips!

Stacey Burke ID Setup taken on WTI, and Silver reversal shortIn this video, I walk you through my entire thought process during today's trading session. You'll learn how I selected the pairs and executed three key trades:
- Silver Reversal Short
- WTI inside day , first red day, short
Inside days are a key best trade setup of Stacey Burke. Don't miss out on these valuable insights and tips!
For details on the Stacey Burke style trading approach see his site and playbook: https://stacey-burke-trading.thinkifi...
