One Swing trading Equity Option -HEROMOTOCOHEROMOTOCO buy above 2437-2460
Target -2500, 2555. 2600, 2640, 2700
SL below 2280/ 2395 as per your risk
Better to create option strategy
Buy HERMOTOCO 2500 CALL along with Sell of 2600 CALL May Expiry
Max loss:-9000
Max. Profit:-19000
Profitabletrading

Everyday with one Equity Intraday Profitable Idea:-RUPARUPA is looking very attractive for intraday. Rupa is trading above channel and it holding above the channel.
Rupa buy above 580
Target 586,591,600
SL 570

One Intraday Trade for everyday:- 06/03/2022Godrejprop buy above 1629 when breaks triangle pattern. Target will be very small.
Target 1637,1642, 1650
SL below 1622
please keep position size small.
If it opens at gap up then avoid buy entry. then you can take sell trade if you get clear rejection on 30 minutes chart.
#Disclaimer :-This is not a buy or sell recommendation. This chart is shared for educational purpose. I'm not a SEBI-REGISTERED analyist.

SHORT TERM POSITIONAL MCXMCX is given breakout on a larger time frame. MCX buy above 1401, CMP 1431. Target-1448, 1467, 1485,115,1537
SL below 1321 or 1355.
As MCX breakouts on smaller timeframe also, you can take position at CMP. If it falls till 1400, then accumulate in triangle pattern. After that wait for target or SL. Novice trader, please keep your position size small.

One Swing trading Equity Option -WIPRO WIPRO Sell below 579
SL 616 on weekly closing basis
Target:- 554, 527, 450
So, we have to initiate a bull put spread -
April Expiry
580 Put buy along with 550 Put sell
If 550 is not achieved in the April expiry then one can again take this trade for next month's expiry provided the trade should be in profit.
(For example:-u can initiate 560 Put buy along with 530 put sell if Wipro would trade at 560.
u can initiate 540 Put buy along with 510 put sell if Wipro would trade at 540.)
Disclaimer: -Views are for ‘’EDUCATIONAL PURPOSE ONLY’’
Trade at your own risk.

ZIL/USDT#ZIL/USDT here ✌️
Lying above strong demand zone
It will pump hard from here 🚀
BUY ORDER < 0.114
SELL ORDER <= 0.143
If u agree & like my trading still give me some like and follow me boss! love all of u !!!
HAPPPY TRADING!!!

MDTUSDTITS a Crazy one! even btc get down sometime it go up! I believe in its Project and how it moves ! if u agree give me some like flow to make a profit together.
dont forget ur sell and buy order!
BUY ORDER < 0.0514
SELL ORDER => 0.060-0.077
HAPPY TRADING!

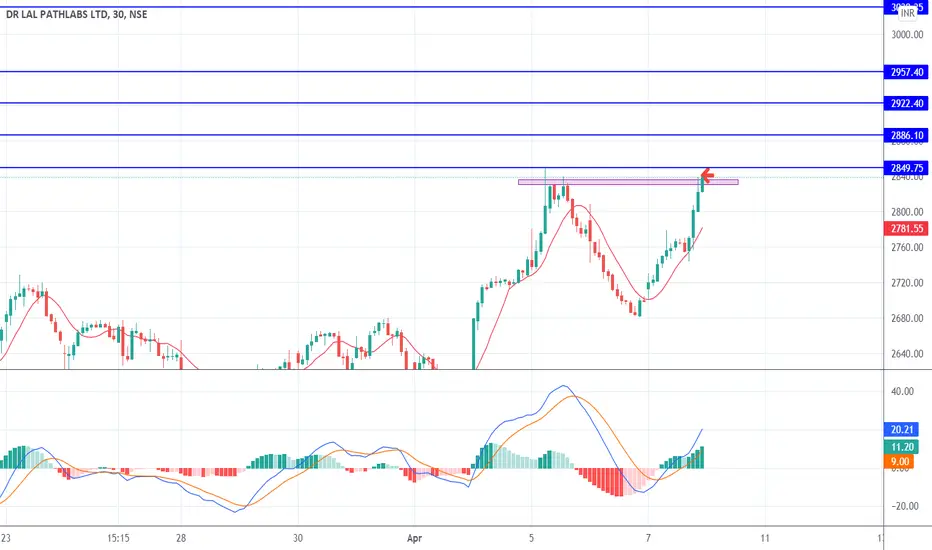
Everyday with one Equity Intraday Profitable Idea:-Dr LalpathlaTrend Analysis is arguably the most important area of technical analysis and is key to determining the overall direction of a security. Trends are based on the principle of higher highs, higher lows (for an uptrend) and lower highs, lower lows (for a downtrend).
Dr.Lal path lab is now in short term bullish mode in corrective wave pattern. and stands in Resistance area. Expecting bullish momentum, when it will cross 2850 with volume. Please initiate trade after breakout and retesting.
Dr all path lab Buy above 2856.
Target 2870,2880,2890,2915
Positional Target :(BTST):- 2950,3000,3050
CELOagain this one has a great project and has a lot of potential. we did already ~ %40 profit lets do the same! BUY ORDER 3.19-3.25 ||| SELL ORDER 4.00 - 5.20

FTMUSDTFTM hat big potential! it is a creasy one, when move unstoppable!!
entry: 1.13->1.20
T1: 1.34
T2: 1.54
T3: 165
T4: 1.98

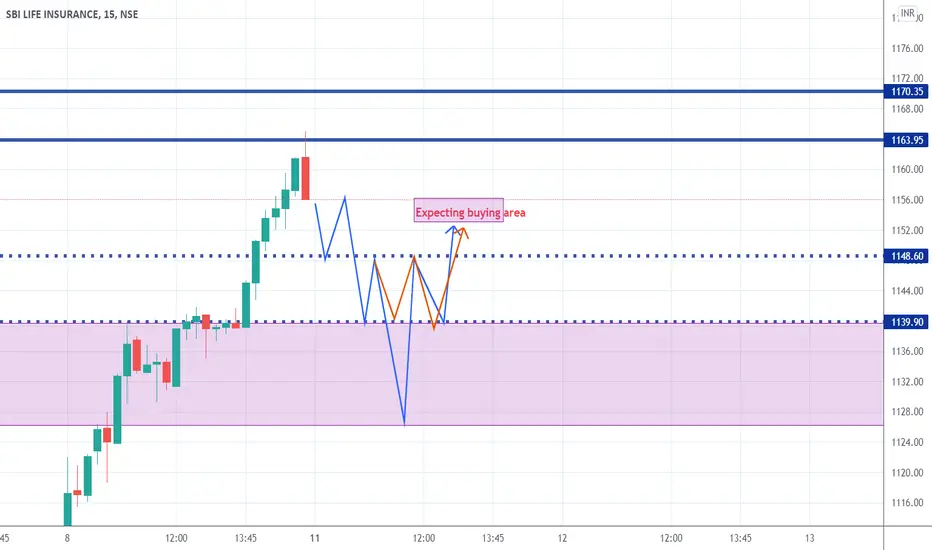
Everyday with one Equity Intraday Profitable Idea:-SBILIFESBILIFE Breakout in the daily timeframe. but it should consolidate in a smaller timeframe. That's why I have drawn two imaginary expected paths of SBILIFE.
Buying area is 1148 to 50. SL 15 points. Target-1164,1170
or you can buy above 1162 for the target of 1172. In this case, the target is very small but the target can be achieved very fast.

Is Forex Profitable?As the world's largest financial market, the forex attracts millions of participants from around the globe on a daily basis. The result is a highly liquid, diverse trading venue that caters to the needs of retail and institutional investors alike. Whether you're a forex market newcomer or professional, the ultimate goal of active trade is the same: sustain consistent profitability.
So, is it possible to actually make money trading currencies on the forex marketplace? The answer is yes. Although succeeding as a foreign exchange trader is not easy, it is done every day by people from all walks of life. Given the proper resources and understanding of risk management, forex trading can be a profitable endeavor.


Gold Technical Breakdown From Weekly to 15MGood Evening again everyone. Hope all is well
Please take a look at my full breakdown of gold and current price action. From weekly analysis all the way down to the 15M
Looking for major break of structure and continuation.

Stock that follows Technical Indicator Perfectly ITC#ITC follows the technical indicator Long and Short rules very perfectly.
Atleast from the last Covid season there is good signal of long and short coming in very systematic way.
Every Blue Candle from its past Black Candle i am gonna SIP the stock to make wealth
What do you think ?
#NSE
#BSE
#SENSEX
#STOCK

AUD/USD BEARISH 4HR ANALYSISThe highlighted red area above price indicates that the market is currently in a bearish structure. The oscillator at the bottom shows both the AUD and the USD index's and as you can see, the USD is increasing upwards and is about to cross the mid line, which shows bearish pressure coming in to play for the AUD/USD pair. I also have a second market structure indicator which is currently indicating BEARISH next to the price level. I also have imbalances on the chart as a potential take profit area to consider. Lastly, I am using Bollinger bands and you can see that price pushed up and touched the top of the band and since that point has failed to push higher, this is another bearish sign.

NZDUSD After 10 hour projectionSo as we observe after 10 hour,
market still goes as we plan which is now NZDUSD market movement are in retracement before going up a bit because in the previous movement we observe that it cant break major reversal zone so its going up and make a retracement before trying to break the ceiling of the reversal zone ,
if it cant break it , then it will goes down as we plan ,
Till next mapping ,
Thats all from me GP XENIX
Happy trade guys , Love u all

EURUSD POTENTIAL DONWFALLON approval of DOUBLE TOP on 1-DAY (1D) time frame we expect the value to go DOWN.
Bear in mind this is not a financial advice to take in, rather an expert option to rely on. Put accurate stop loss and tp ur gain it.
Ifu find it helpful please give review. Thanks, happy trading guys.

GBPUSD 12.55 RISK TO REWARD!!!... 😱 Hi traders
Please see our analysis above on GBPUSD where we are expecting to see further bearish momentum.
Note we are cautious that we may see a deeper pull back however as we are only risking 1% per trade we are happy to take that risk given the risk to reward for this set up.
If this entry fails we will get the deeper correction for an even higher risk to reward.
Either way we want to see this melt to the downside.
Let me in the comments below if you are looking at GU shorts and where you think the most sensible entry is.
Trade safely and have an awesome week!
The Fx Chartist

DID YOU TRADE THAT FREE SIGNAL ???Simple break and retest strategy.
Support zone + 0.38 Fib level = LONG!


GBPUSD My analysis explains for itself, it did the break and retest about 3 times to drop further,so im just following the pattern,and im hoping it drops to my support, if it does go against me,this pair will officially be buying for the upcoming week
