Nifty TodayToday's range of nifty. The US market has turned around in a record way. Take a look at the line, trade, be patient, profit will come.
Keep working hard every day, for that one great day in life.
Profits

+530 Pips Profits + New Weekly Breakdown Video Full SetupsThis is an educational + analytic content that will teach why and how to enter a trade
Make sure you watch the price action closely in each analysis as this is a very important part of our method
Disclaimer : this analysis can change at anytime without notice and it is only for the purpose of assisting traders to make independent investments decisions

Educational: Two ways to take from the marketsOf course there are many ways to take chunks out of the markets. Hundreds of methodologies are out there. And the markets are experts at taking chunks out of you and your account.
In the 4.5 min video I briefly show two types of 'attacks' on the market:
1 - Strategic
2 - Tactical .
Strategic
In the strategic approach (which could be any methodology), you plan very carefully over days. You're a 'sniper', hunkering down in the bush - you make very few movements - you're watching the enemy and waiting for best conditions and opportunity. You suffer sleepless nights. You suffer cold wind, rain, snow, muddy rivers, insects biting you. (These are the scenes from the movies and in realty that are well known - I'm NOT promoting violence or war).
And despite all that, you endure. When it's right, you fire one shot! Your 'kill rate' is so good, that one shot is all you need. So the above analogy in market terms, is similar - waiting planning, suffering, and watching those charts, for that one high precision trade.
Tactical
Right - in this scenario you're at the frontlines doing hand to hand battle with the enemy. You are loaded with armaments, and you use whatever you need. Look - frontline battle is battle - nothing nice about it. In market terms, this is where you get down and dirty - that's why it's called scalping! In scalping you're making short term moves. You're not planning an attack - you're attacking. The enemy - the market - is there to take your heart out (aka your account)! It's either you want to be in that sort of battle or not. But if you're there, you have to have the right knowledge, skills and experience - else you'll be taken out.
Making the money
The money-making is not in the methodology - it is all about you! If your 'knife' doesn't work well, you're to blame. Don't blame the charts or the tools you use.
Can you be both a strategist and a scalper? Of course you can. There is no law saying that a trader can't be both.
Conclusion
As a knife when used carefully can create good things, using it the wrong way can be dangerous to your safety or that of others. How you use the tool, is a matter of skill and experience. Are you fit enough? Do you have the right knowledge, skill and experience? Avoid the Dunnnng-Kruger effect as applied to traders (for reading about on the net).
Disclaimer: This is not advice or encouragement to trade securities or any asset class. This is not investment advice. Chart positions shown are not suggestions intended to assure you of an advantage. No predictions and no guarantees are supplied or implied. The author trades mostly trend following set ups which have a low win rate of approximately 40%. Heavy losses can be expected if trading live accounts or investing in any asset class. Any previous advantageous performance shown in other scenarios, is not indicative of future performance. If you make decisions based on opinion expressed here or on my profile and you lose your money, kindly sue yourself.

600 points in 5 hours - how?In this short video - 3 minutes - I show how small time frames can be useful if following a trend to best completion.
Trend following - the true kind - can deliver far more - than any other system of trading. It depends on your knowledge and skill of course.
The video shows 'you' could have extracted close to 600 points in one go.
Of course you have to be watching a screen or react to alerts that you set on Tradingview charts.
Disclaimer: This is not advice or encouragement to trade securities or any asset class. This is not investment advice. Chart positions shown are not suggestions intended to assure you of an advantage. No predictions and no guarantees are supplied or implied. The author trades mostly trend following set ups which have a low win rate of approximately 40%. Heavy losses can be expected if trading live accounts or investing in any asset class. Any previous advantageous performance shown in other scenarios, is not indicative of future performance. If you make decisions based on opinion expressed here or on my profile and you lose your money, kindly sue yourself.

Wonderful Pay on NASDAQLittle pullback then a chunk of selling will be fulfilled this day be sure to comment you great trades

$MGI Printing on this textbook breakoutOriginal idea posted in NOV at $5.74 up over 60% now , approached nice demand zone and has been running ever since.
Beautiful breakout here, move stops and lock in profits. Approaching overbought on the daily but I think there is a magnet on $10
Let's see if we get a May like move, this one can run


SELL XAUUSDSell gold, further drop expected today. Equal drop as experienced this week. Use proper money management.

BUY GBPCADOANDA:GBPCAD Looks pretty bullish. Looking for long entry at 1.7246 my stops at 1.7200 and targets above 1.7421. Use proper money management. All the best my friends.

BUY USDCADLoonie is presenting a beautiful opportunity for us to go long. My entry is at a lower price 1.2738 when price gets here then I will go long. My stops at 1.2697 and my targets at 1.2969. Use proper money management. All the best to you all.

UKOIL UPDATELooks like out final take profit is a bit far however i still belive that it will be hit. for now place stop losses accordingly.

USOIL UPDATEFantastic bullish movement from usoil all take profits have been it within hours, well done lungu fx team.


GOLD UPDATELooks like we have done beautifully for the bearish outlook on gold, well done Lungufx team.


21/12/28 - Gold started its next bearish impulse Hey Trader,
please see my latest idea on Gold. We finally hit our target from our longs and based on the current price action I am confident with my second scenario for the midterm Gold cycle.
I am very confident that we will see prices way above 2000 Dollars, but before that I am expecting 1750 - 1640 area first in order to grab the liquidity we need for the last wave 5 in Gold in order to hit new all time high's.
I entered my short positions based on the knowledge that wave 2 needs to retrace at least 50% of the first impulse. As I saw this 3 waves pattern building up I decided to not wait and enter there in order to hold my short swing for midterm.
Please keep in mind: This idea represents just my opinion and my technical expertise.
I am open for feedback if its constructive and reasonable. Let me know what you think
For further informations please see below.
RT

Possible Gold Scalp - CHECK THIS OUT!We have a possible gold scalp here. Entries have been made, let's see if this pans out.
like/comment your thoughts

BNB/USDT ( PERP ) LONG RUN Going Long at 578.00
Target 720.00
As the dump of bitcoin pull all the altcoins down now we are looking at a bullish wave so fingers-crossed..!

DXY CAPITULATION PENDING A WEEKLY CLOSEAfternoon people,
Thanks for taking the time to check out my Technical analysis, much appreciated. Constructive comments are always encouraged.
DXY has enjoyed a lot of strength in recent weeks, strangely baffling seeing as since 2020 the supply of USD has increased by 30%+. There is now more Dollars in existence than have ever been, yet according to recent strength it would seem people still trust the Dollar. It seems like a recipe for disaster if you ask me. The dollar is weak, it has been since Nixon unpegged it from the Gold Standard, thus sealing its fate as a fiat currency. History shows us how it ends for "world reserve currencies", the cycle is around every 100 years. Guess how long the Dollar has been in power for ;)
Price attempted to breakout to the upside last week, completing the impulsive move from 94.56 to 96. However the .5 fib held and sellers stepped in causing a considerably big wick. Indicating buyers are struggling to break through the fibonacci levels that are acting as resistance. we closed with a huge wick on the weekly. I'm now waiting for a weekly close below the aforementioned levels to indicate a continuation to the downside. This adds further confluence to my idea posted earlier in regards to Bitcoin. It would seem Bitcoin has found its bottom and we should now be expecting Bitcoin to start moving towards my 233K targets.
Once DXY starts collapsing, the downside targets at the D ext. are 86 & 82 respectively.
It is my belief that we will be seeing the Dollar collapse as Bitcoin goes on its parabolic blow off top phase of the market cycle (something we haven't seen yet).
Regardless of how far Bitcoin goes, it needs a DXY collapse to do so. Similar to 2017. So far Bitcoin is inversely correlated with DXY. Observed today we can see weakness in the DXY has led to Bitcoins price rising and therefore the rest of the crypto market across the board. This is just the beginning. Don't be disillusioned, when Bitcoin does pullback, which it will. This will be a great buying opportunity. Be patient & ENJOY the show.
Remember to take profits as you go and scale out. We don't need to pick tops. No one ever went broke taking profits.
Happy trading,
Big Love

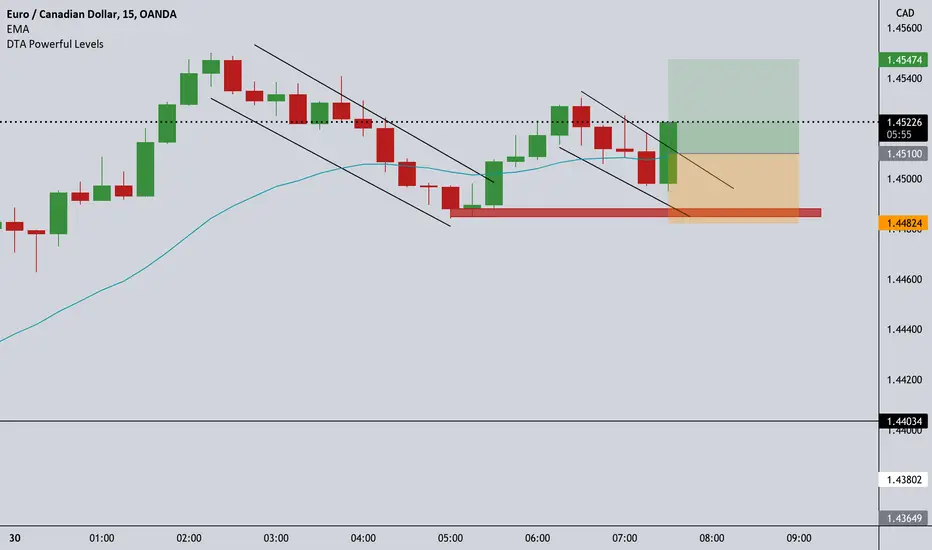
Touched Demand For Bounce?Retest to this demand zone for a long shot?.. This is a pretty clean look.