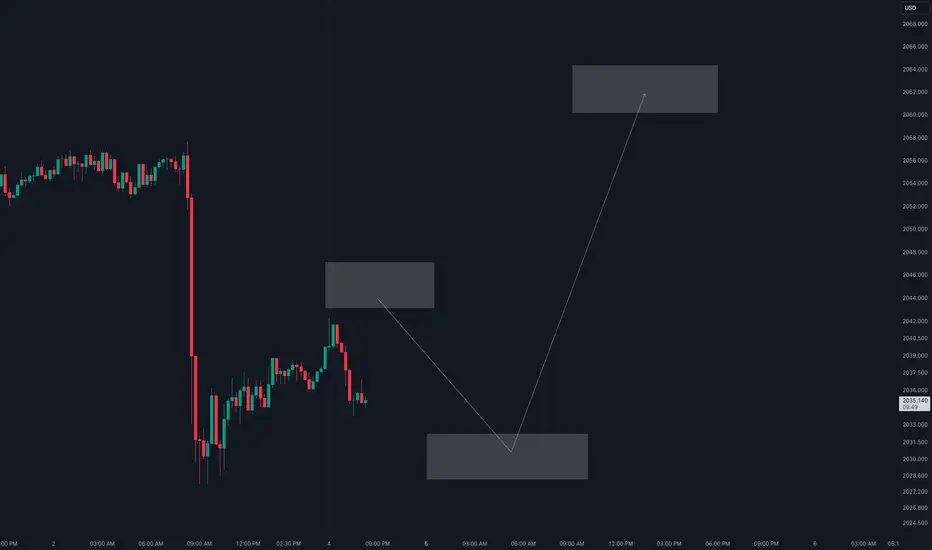
Gold end of week rally UPDATE!Here is an update on the continuation of bullish movement on the final day of the week. Asia Consolidation and London drop into NY longs.
Bullish buy opportunities should present themselves during NY session.
Projection

GOLD LONGS! CENTRAL BANK MADE THE PHONE CALL!!!Welcome to another trading week!
Gold annotations are on the chart, I will be updating as we go like always.
BIG ANNOUNCEMENT:
Guys I love you all... take your trading serious, act now before prices double and be part of a group of likeminded guys who want to win. DM right now, don't wait.
My original idea was deleted by the moderators.... people dont like to see you winning! DM me lets link up
2024 Crypto SUMMER is here! PRICE, TRENDS & FORECASTSIn this video we lay out our short and long-term forecast for the entirety of 2024 Crypto Summer and beyond. Also, we do a little review and take a look at how our forecast stacked up against the eventful 2023 Crypto Spring. As always please feel free to leave your thoughts and ideas in the comments and thanks for watching!

3 Potential Risks & 3 Opportunities in 2024 - What are they?If you ask anyone on the street, 'Do you think living expenses and food prices will be higher in a year or two from now?' 9 out of 10 will likely say 'Yes.' This means inflation is still a concern.
Risk 1, U-turn in inflation.
Risk 2, An expansion in geopolitical tension
Risk 3, A delayed recession in 2024
Comex Gold Futures & Options
Its Minimum Fluctuation
0.10 per troy ounce = $10.00
Code: GC
Micro Gold Futures & Options
Its Minimum Fluctuation
0.10 per troy ounce = $1.00
Code: MGC
Disclaimer:
• What presented here is not a recommendation, please consult your licensed broker.
• Our mission is to create lateral thinking skills for every investor and trader, knowing when to take a calculated risk with market uncertainty and a bolder risk when opportunity arises.
CME Real-time Market Data help identify trading set-ups in real-time and express my market views. If you have futures in your trading portfolio, you can check out on CME Group data plans available that suit your trading needs www.tradingview.com

USDCAD Expected Growth! BUY!
My dear friends,
Please, find my technical outlook for USDCAD below:
The price is coiling around a solid key level - 1.3600
Bias - Bullish
Technical Indicators: Pivot Points Low anticipates a potential price reversal.
Super trend shows a clear buy, giving a perfect indicators' convergence.
Goal - 1.3699
Safe Stop Loss - 1.3559
About Used Indicators:
The pivot point itself is simply the average of the high, low and closing prices from the previous trading day.
———————————
WISH YOU ALL LUCK

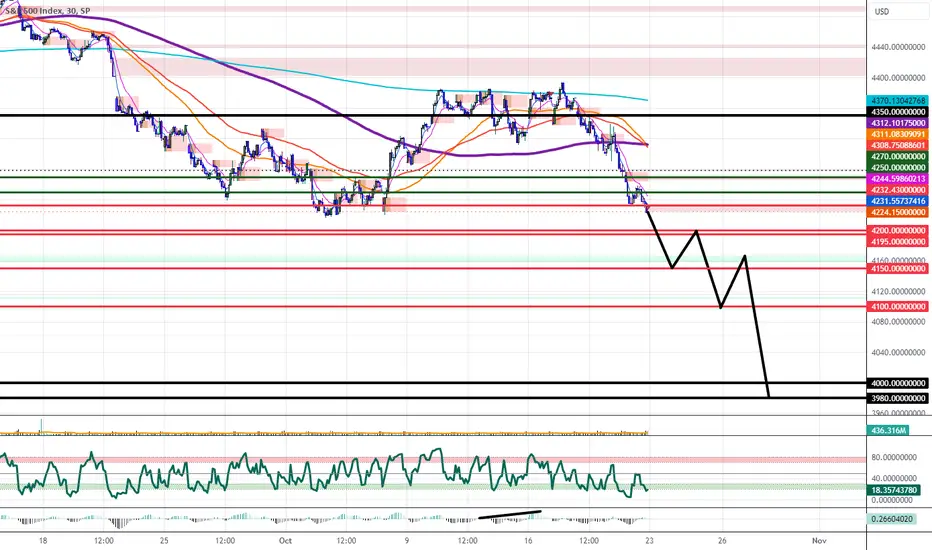
SPX Price Range Projection For This WeekBased on the price levels of interest and how we reacted to them during the last weekly range projection, I suspect we will get price action similar to what I have plotted on the chart and listed in text form below as last week's range breakdown has shifted down our weekly range, and now we are looking to trade lower and perhaps open the week to a gap down in price. I also think the price could just crash below the ranges as the market is in the most bearish stae I'v seen since 2020, but so long as the market doesn't lose control, I think it will likely follow my plot pretty closely this week, otherwise it could just give us a straight line down.
$4,150 Monday
$4,195 Tuesday
$4,100 Wednesday
$4,165 Thursday
$4,000-$3,980
Price-Action-Channel-Formation: Key Projection-Types!Hello Traders Investors And Community,
Welcome to this tutorial about Price-Action-Channel-Formation. In markets, there are often price-actions forming that move into channel-formations which can shape into different forms. In this tutorial, I am looking at important channel structure types and how the projections can be assigned to properly object a taget-zone in the various types. As it is most often the case such formations can show up with a great potential signal to enter when they rightly complete and the final confirmation shows up, therefore it is important to keep patient on these confirmations and do not hesitate to enter into the market when no solid setup and opportunity is given.
Range-Breakout-Projection:
- Such ranges form quite often in the market and they can develop on smaller timeframes such as the 1-hour timeframe or higher timeframes such as the daily timeframe always with the proper time perspective given with the certain range. The pattern starts with a downtrend or in the reverse with an uptrend marking a new low or high which is the support/resistance in the range then the price bounces back to form the counterpart high or low which then creates the counterpart support/resistance in the structure. After a period of consolidation, the price finally breaks out of the range above the support/resistance level and closes there. When the final breakout emerges there are two possible target-projections, firstly the range height from the support to the resistance that is projected from the breakout point and secondly the width from the initial range entry to the breakout which is projected from the low to the upside, both projection can have different targets that can be assigned as target one and target two.
Tripple-Channel-Target-Projection:
- This is a very interesting channel-formation that is forming in the markets. Firstly the uptrend channel develops as seen in my chart(this can also happen in the bearish direction), within this channel a new high marks in the structure before the price-action actually reverses and breaks out below the lower boundary of this main ascending channel. The first breakout below the lower boundary of the channel activates a target with the projection to the downside and after that it is not seldom seen that the price-action moves back into the lower boundary and tests again as seen in my chart, in this case two further channels can be drawn, the second channel in the structure which is projected from the high to the structure lows and highs to the downside and the third channel projected from the new downtrend low to the new downtrend high, when the price-action now moves into the lower boundary of the main channel again this is a tripple-resistance-pullback as seen in my chart and the price-action moves on to the targets by the breakout and when the price-action then moves below the second channel the next target is activated.
Classical-Descending-Channel-Projection:
- This is the most classical channel in the market, it can form as a descending channel marking a potential bullish reversal as well as an ascending channel marking a potential bearish reversal. In both types, the channel is formed by the trend lows and highs which are ranging in the channel and as the downtrend (or in the reverse the uptrend) moves on the market gets oversold and the possibility for a reversal gets higher as the market has not the ability to continue this way for every. Such a formation also often inhabits a elliot ABCDE-wave-count which can offer additional confirmation for a breakout. This final breakout emerges when the asset gets that much oversold that demand enters and a breakout above the upper boundary settles as it is shown in my chart. When this breakout shows up the channel heights from the up to the downside is projected to the final breakout to the upside and the price-action is ready to appoint these zones.
Range-Triangle-Channel-Projection:
- This is a pattern that combines two formations, firstly an ascending channel and secondly an ascending triangle which is forming within the channel. Firstly the ascending-channel establishes with higher highs and higher lows and within this channel, the price-action makes something interesting as it does not move on further in the structure and stops making new highs it pulls back and forms a horizontal line of highs in the structure which then develops into this ascending-triangle seen in my chart in orange. Such an ascending triangle has the ability to form a dedicated breakout to the upside when the price-action moved on to range in the triangle and possibly also completes the wave-count within. When the price-action finally breaks out above the upper boundary of the triangle this will activate the further developments and targets at the upside especially amazing is the double projection here which projects the triangle height to the upside and is also at the same time the target at the upper boundary of the ascending-channel which can approve the target not only in price but also in time.
Bull-Flag-Channel-Breakout-Projection:
- This type of formation projection can show up with a very good solid signal however there are some very important determinations that need to confirm rightly before assessing the formation in the right manner. When the bull flag does not complete properly and the price-action increases bearishly or also bullishly when it is a bear-flag such a flag-formation can also invalidate with the breakout into the reverse direction which can often lead to heavy volatilities into the other direction as traders get trapped. Nevertheless when the formation completes rightly which will happen with the final breakout above the upper or lower boundary the target projection is made from the previous low in the wave to the upside to the high which is then projected from the lowest price-action point in the flag to the upside, always possible with the counterpart formation into the other direction.
Double-Channel-Triangle-Breakout-Projection:
- Now comes a very amazing formation as there are some interesting points given in this formation that can lead to a very strong breakout signal and the activation of the targets ahead. This formation basically consists of an initial channel to the downside in which the price-action ranges and after that can fall below the lower boundary and continue bearishly to reach the target, this initial price-action in the descending channel does not necessarily need to show up. After that when the price-action reached the targets the price backs up and continues to the upside to finally move into the previous descending-channel again in which it continues to consolidate and now also forms a bunch of lower lows that mark an ascending-trend-line in this channel, both the first descending-channel and now the second ascending-channel form a symmetrical triangle formation which is more likely to break out into the direction it came from which in this case is the bullish direction, this can also be measured into the reverse direction. The breakout then strongly activates an upside target which is the price-projection of the triangle to the upside and also the upper-boundary of the channel-formation that can also show the target in time.
In this manner, thank you for watching my analysis about these important price-action-channel-formation types that can be spotted in today's market, will be great when you support it with a like and follow or comment, great contentment for everybody supporting, all the best!
Information is only educational and should not be used to take action in the market.

$ES New All Time High ExpectedOur projected path for CME_MINI:ES1! to take out the January 2022 High which also happens to be the All Time High. We are using a range from a Weekly Volume Imbalance and a Weekly Bullish Order Block combined to give us a price range between $4190-$4288 to find long positions. This price range is also in a discount for the current weekly price leg; giving us more reason to look for buying opportunities here. Look for price to reach this are late August or early September. We will post a smaller time frame once we get into this area and we see a favorable trade. We will take a small swing position but we are more excited to ride the price legs to the new high through intraday trading. We have used Fibonacci Projections to give us $4854 as our first target.
Just for fun we want to call $5092 as the 2023 High of The Year. Leave your best guesses for the 2023 High below :)
Happy Trading,
BlackOakCapital

GBPUSD Projection For Next Move | PIPS Are Waiting!Here is my Projection for next GBPUSD move withing the next few hours.. That could be triggered in New York Session (8:30 AM onwards)

JPY INDEX ELLIOT BREAKDOWN Currently, we are at the last wave of the overall wave which is the wave 5. Expect rejections around 775.0 price level. baased on the previous candles that left a gap without filling, expect price to fill it in the future and that will be the target after breakout of the red trendline.

USDCHF - long trade ideaTrade idea for USDCHF as it has met a double bottom structure on weekly TF shown.
Hoping to have caught the bottom of an uptrend.


Pepe usdt..get ready for massive gainsBased upon the falling wedge and other additional layers of confluence I see two moves to the upside suggesting 126% returns then 200% gains on the hour. This is based on the 1 hour timeframe

Oil Prices Set to Soar: Will $100 per Barrel be the New Normal?According to the Elliott wave principle, the XTIUSD 4-hour chart appears to have completed a primary degree impulsive wave 1 followed by corrective wave 2. The current price action suggests that wave 3 of an ascending impulse is now underway.
It is anticipated that XTIUSD will face resistance around the 73.88-72.84 range, and as a result, is projected to climb higher over the upcoming period in 5 internal impulses, potentially reaching above $95/barrel.
Furthermore, a bullish batman harmonic pattern on the M15 further confirms this analysis. It is worth noting that if this forecast is accurate, it may trigger a rise in the dollar index as the analysis unfolds.
My medium term target will be $90/barrel , while my ultimate target will be $100/barrel of oil.

EURX SELL PROJECTION (LAST DROP)The market is currently in a complex correction which carries or bears three wave structure (WXY waves). As we see, wave X is about to be completed on only if the red line gets broken below. The last wave which is the wave Y is set to carry three sub waves with the 5-3-5 formation of its sub waves.
COMPLEX CORRECTION - WXY
WAVE W - 5 WAVES
WAVE X - 3 WAVES OR TRAINGLE
WAVE Y - 3 WAVES

WAVESUSDT forecastso far the price action is being contained inside the parallel channel, it needs to stay there otherwise it will need a recount.
for me the asset is still in the process of correction and it's possible that we are still missing a wave X and Wave Y.
only if it breaks the channel to the upside will I say it's bullish we can probably see a bigger rally up.

Near Protocol coming down?Based upon the daily time frame I see multiple levels of confluence forming, the measured move projected from the inverted cup and handle suggest a move back to 0.68 cent. Stay tuned

Crude Oil: Fibonacci Retracements, Support and Resistance LevelsI've had the opportunity to closely observe the crude oil market's impressive run after its historic dip into negative territory in 2020. To better understand the market's behavior, I've outlined a Fibonacci pull from the low in November 2020 to the high in March 2022. In this idea, I'll discuss the importance of support and resistance levels, as well as Fibonacci retracements, in the context of trading crude oil.
Before diving into the technical analysis, let's first touch on the educational aspect of support and resistance levels. Support levels are price points at which an asset's price is more likely to stop falling and start rising, while resistance levels are the opposite - price points at which an asset's price is more likely to stop rising and start falling. These levels can help traders identify potential entry and exit points for trades.
Similarly, Fibonacci retracements are an analytical tool derived from the famous Fibonacci sequence. They are used to identify potential support and resistance levels by measuring the percentage retracement of an asset's price between a low and a high. The most common retracement levels are 23.6%, 38.2%, 50%, and 61.8% (the most important level).
In my crude oil analysis, the 50% Fibonacci retracement level sits at $66.29 on a log scale. We saw the price tap and test this level for a few days before witnessing a significant gap to the upside. What's particularly intriguing isn't the support we're finding at the 50% retracement level, but rather the support and resistance levels I've outlined at $61.35, $85.88, and $93.33.
Should the price fall below the 50% retracement level, we have the downside support at $61.35. On the other hand, if the price continues moving upwards, we can expect resistance at $85.88 and $93.33. The $93 level is near the 23.6% Fibonacci level, indicating that we may encounter significant resistance at this point.
A few days ago, we observed a sizable gap at around $80 after production numbers were released. Generally, production cuts lead to a higher cost for assets like crude oil, as supply shrinks while demand remains steady.
If oil prices surpass the resistance level of $93-$94, there's a high likelihood we could see oil reaching $180 in the coming years – approximately two years out. Although I would assign a 20% probability to this scenario, it's essential to note that support and resistance levels have proven to be crucial in the history of oil trading. Crude oil is unlike other assets and has a reputation for trapping the herd.
So, where do you stand in the herd today? Understanding and effectively utilizing Fibonacci retracements, support, and resistance levels can be the key to navigating the crude oil market and making informed decisions in your trading journey.

This Is How GBPUSD Will Likely Move In Coming Months | Be Ready!I have published this idea to give you a general view of how to look at GBPUSD in the meantime ..
Please do consider that this is an estimation of how price might move, given the current conditions and market outlook and that may change and it's not stable..
A confirmation must occur before determining every leg of the moves shown on chart, and confirmations of lower timeframes is obligatory..
This is the general view of what we might expect price to do.. make sure to hit a FOLLOW to get updates and confirmations right away💥
What's your view on this pair and DXY in general?

SPY BREAKING DOWN!The market has gotten rejected off top resistant at 405 and is back at support. This is not a area to trade now! Best to wait and see for the market direction. We could still bounce and go up to 430. or Dump down to 380s.

🔥TYPES OF FIBONACCI TOOLS🔥
There are several types of Fibonacci tools that are commonly used in technical analysis, including:
📊FIBONACCI RETRACEMENT
Fibonacci retracement levels—stemming from the Fibonacci sequence—are horizontal lines that indicate where support and resistance are likely to occur.Each level is associated with a percentage. The percentage is how much of a prior move the price has retraced. The Fibonacci retracement levels are 23.6%, 38.2%, 61.8%, and 78.6%. While not officially a Fibonacci ratio, 50% is also used.The indicator is useful because it can be drawn between any two significant price points, such as a high and a low. The indicator will then create the levels between those two points.
📊FIBONACCI EXTENCION
Fibonacci extensions don't have a formula. When the indicator is applied to a chart, the trader chooses three points. The first point chosen is the start of a move, the second point is the end of a move and the third point is the end of the retracement against that move. The extensions then help project where the price could go next. Once the three points are chosen, the lines are drawn at percentages of that move.Extensions are drawn on a chart, marking price levels of possible importance. These levels are based on Fibonacci ratios (as percentages) and the size of the price move the indicator is being applied to.
📊FIBONACCI PROJECTION
Fibonacci projections are mainly used to get the possible target levels of an ongoing uptrend or downtrend. It
is drawn by joining three points unlike Fibonacci Retracement which has just two points- by joining the lowest
and the highest points of a pre-defined.In order to draw the Fibonacci projections for an asset in an uptrend, we need 3 points:
👉Swing Low - that is the point from which the actual trend started.
👉Swing High - the point at which price started to retrace.
👉Low of the ongoing price correction.
Fibonacci projections provide potential good levels to book profits. The important Fibonacci projections levels
to watch out for are 61.8%, 100%, 161.8%, 200%, and 261.8%.
📊FIBONACCI EXPANSION(SIMILAR TO PROJECTION)
Essentially, Fibonacci expansions allow us to project how far a potential price move is likely to travel. This price move is typically considered an impulsive price move, in the context of Elliott wave. That is to say that it will typically follow a corrective phase and thus form a new trend leg in the direction of the larger trend.In that way it is very different compared to Fibonacci retracements. Unlike Fibonacci retracements which measure an internal retracement against a larger trend leg, a Fibonacci expansion measures an external price leg.
CONCLUSION
It's important to note that the use of Fibonacci tools in trading is just one aspect of technical analysis and should not be used in isolation.
I myself use Fibonacci regularly but I also combine them with technical key levels and with the price action patterns on top of that.
I Hope you guys learned something new today✅
Wish you all Best Of Luck👍
😇And may the odds be always in your favor😇
Do you like this post? Do you want more articles like that?

SPY PRICE ANALYSIS - ANOTHER VERY VOLATILE WEEK Hello All!
Expect some crazy volatility this week due to all the economic data thats coming out. Currently i'm only playing scalps on movements that i see. I do expect the market to go down further going into the next coming months but it will take some time- so dont over trade and end up blowing your account.

ES1! 13-1-23 projection ICT conceptsProjection for the las trading fday of teh week, friday january 13th. I expect a bullish morning session and then a reversal on the afternoon.
