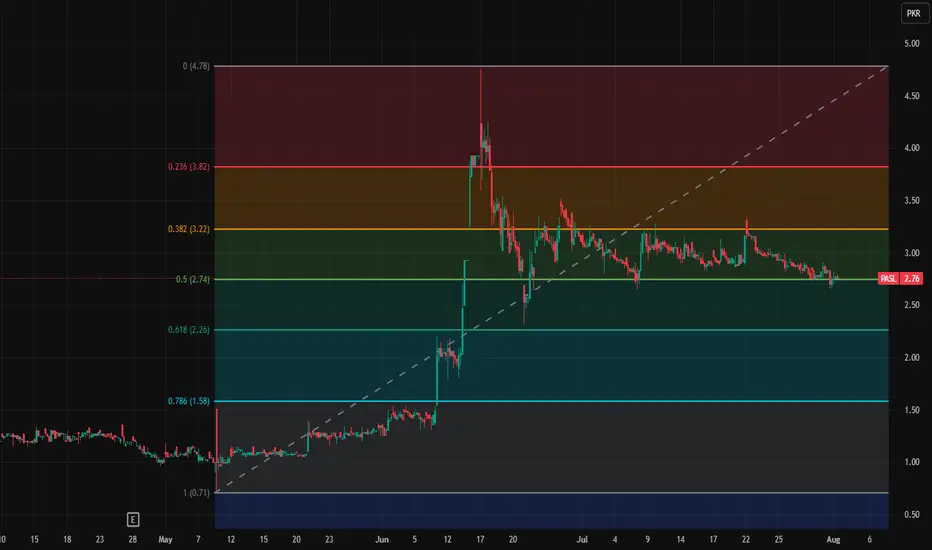
PSX
Bid on AI system limited Pakistan top IT services companyABCD pattern
Rsi div
Trend reversal
3 bull point to buy
comment if you have any bearish point.

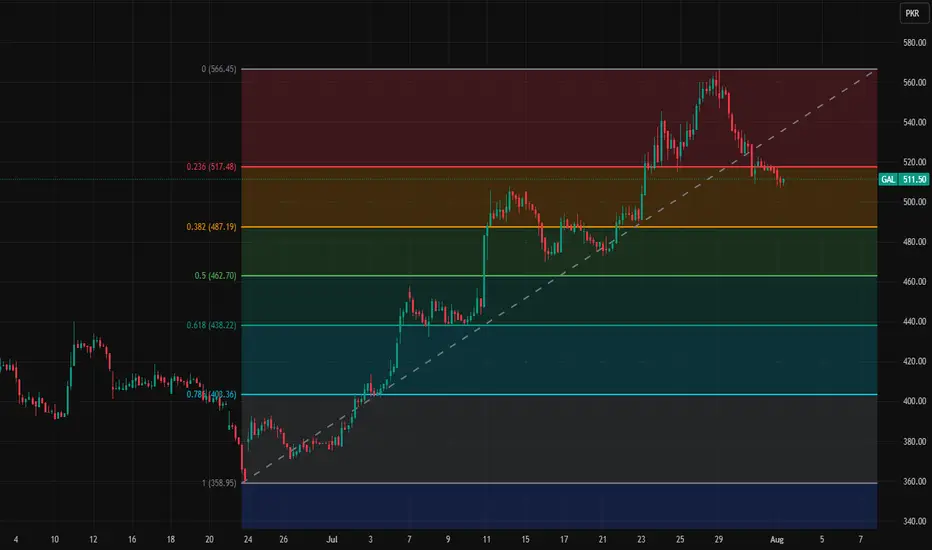
GAL short term key levelsThese are short term key levels on 1h
chart
566.45
517.48
487.19
462.7
438.22
403.36
358.95
FFCFFC PSX STOCKs breakout Day Level Buy Call
Fundamental Strengths
Robust earnings growth:
FY 2024 net profit ~PKR 64.7 B vs ~PKR 29.7 B (2023) – EPS nearly doubled to PKR 45.49
Pakistan Stock Exchange
+15
StockAnalysis
+15
.
Q1 2025 EPS ~PKR 9.33 (Sep‑Nov on TTM ~PKR 66.6)
Pakistan Stock Exchange
.
Attractive valuation:
TTM P/E ~9.6× (TradingView shows ~6.6×—likely consolidated vs standalone) .
High dividend yield:
~8.7–9.9% yield in 2024, with a ~60% payout ratio
TradingView
.
Diversified portfolio:
Operations across fertiliser, power, food, banking (via Askari Bank), wind generation, phosphate JV – mitigating sector risk
TradingView
+1
+1
Strong ownership:
Backed by Fauji Foundation (~43% owner) – adds stability and governance credibility

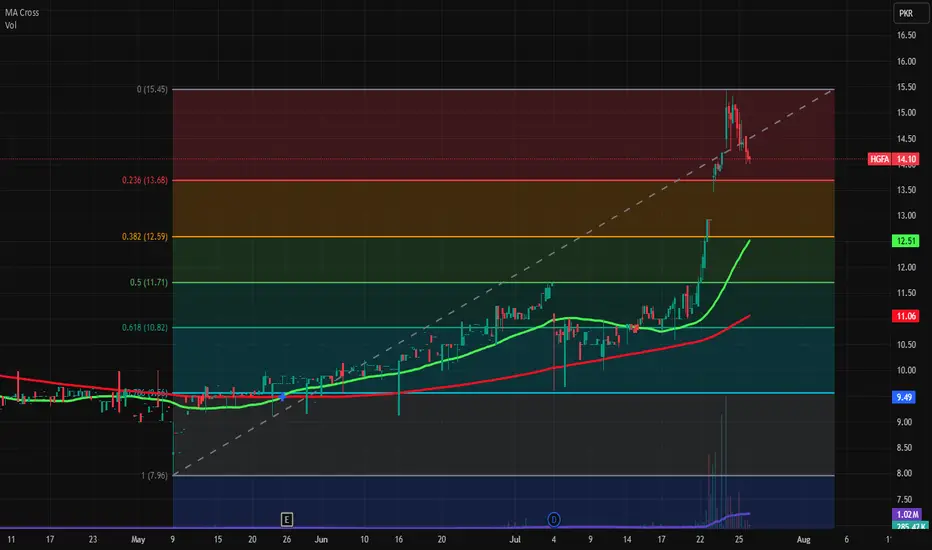
HGFA zonesWith strong fundamentals it was grown rapidly in last few days. Today it was in bearish trend but with very less volume, we can say it correction, profit taking of rollover week and month closing.
These are key levels
15.45
13.68
12.59
11.71
10.82
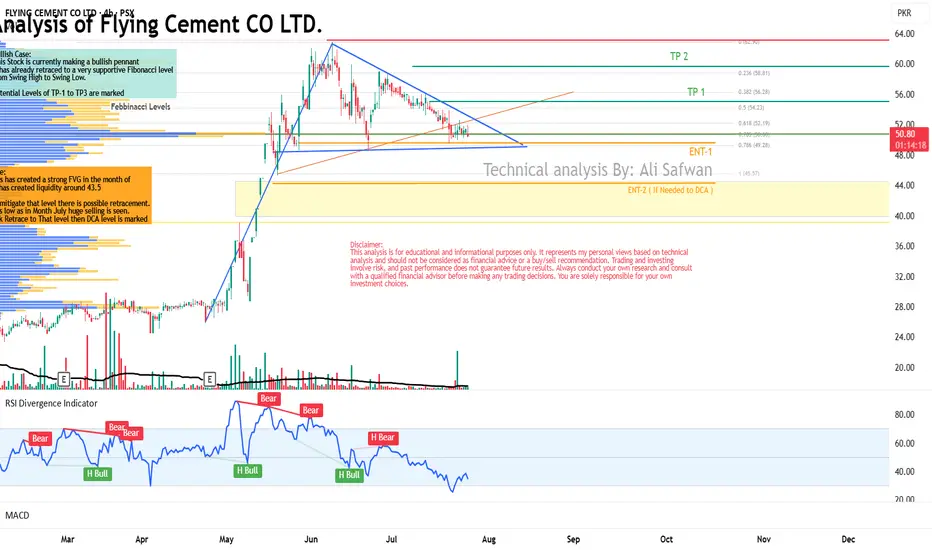
Technical Analysis of Flying Cement CO LTD.Bullish Case:
This Stock is currently making a bullish pennant
it has already retraced to a very supportive Fibonacci level
from Swing High to Swing Low.
Potential Levels of TP-1 to TP3 are marked
Bearish Case:
This Stock is has created a strong FVG in the month of
May which has created liquidity around 43.5
In order to mitigate that level there is possible retracement.
Possibility is low as in Month July huge selling is seen.
Incase Stock Retrace to That level then DCA level is marked
Engro Bullish Swing Trade SetupRSI Divergence spotted – a sign of possible trend reversal.
Trend Reversal forming on the chart – momentum shifting towards upside.
Company Insider Buying – Engro executive bought shares worth Rs. 20 crore, showing strong confidence.
🔹 3 Bullish Signals

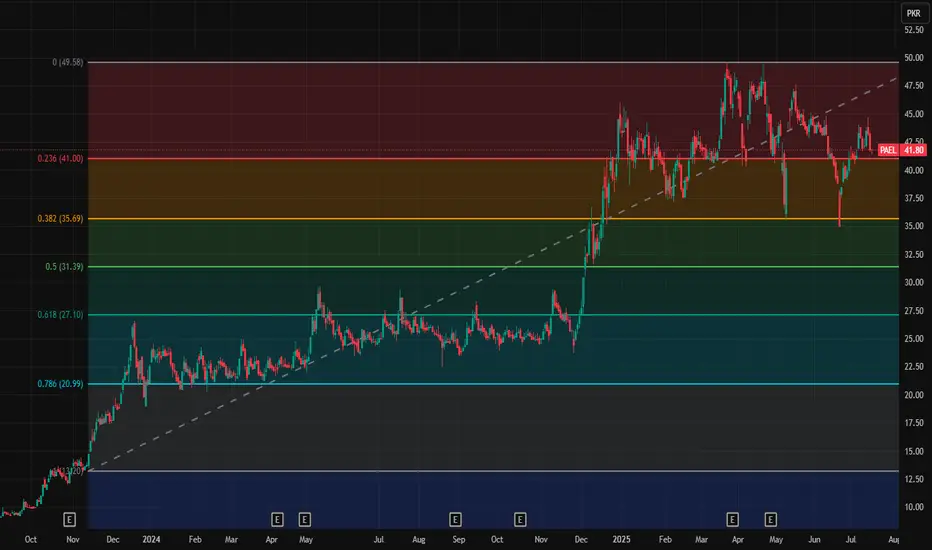
Pael Key LevelsThese are Pael key levels
31.39
35.69
41
49.58
Note: This is not a buy/sell trade call. It is an analysis.
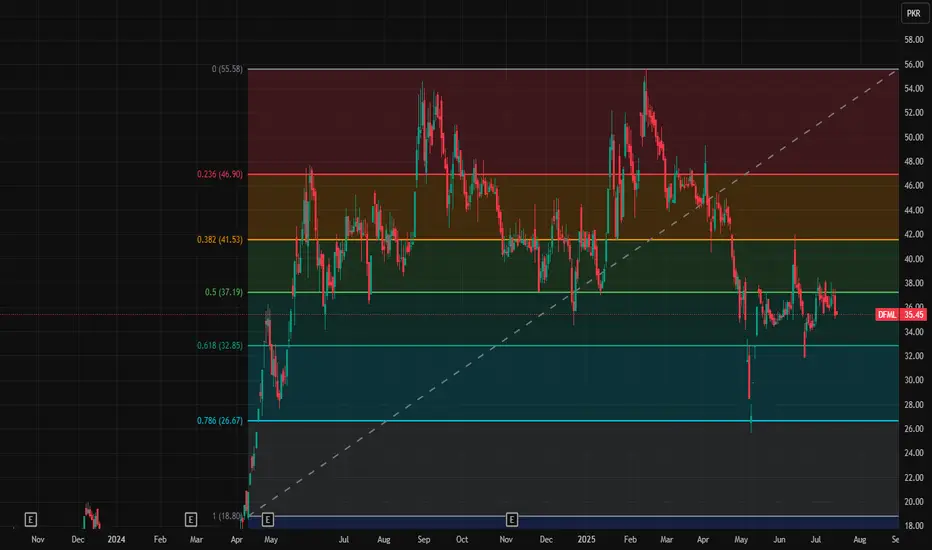
DFML Key LevelsThese are key levels of DFML
26.67, 32.85, 37.18, 41.53, 46.9 and 55.08
Note: This is not a buy/sell trade call, it is an analysis.
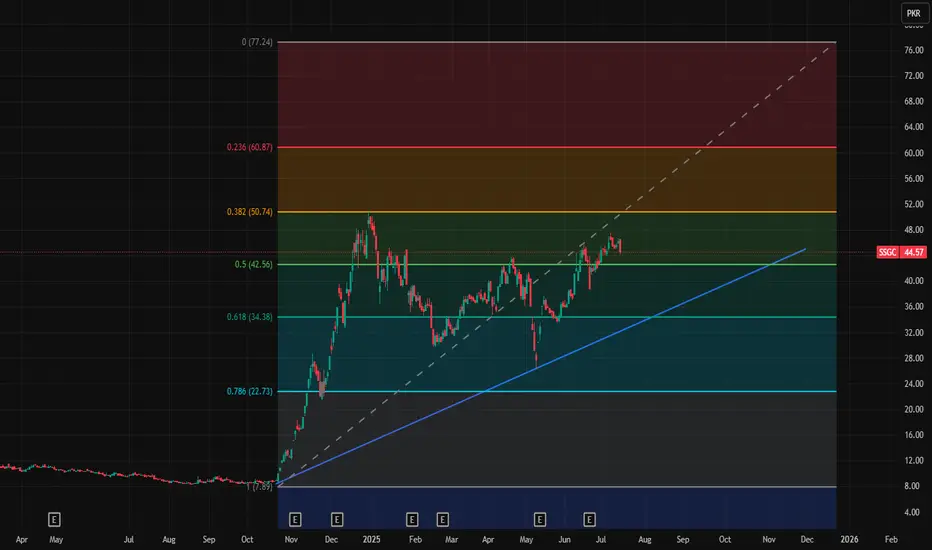
SSGC trendThis is SSGC daily chart and you can watch blue trend line is its strong support and sustainability. It is growing day by day in long term.
These are key levels 34.38, 42.58, 50.74, 60.87 and 77.24
Note: This is not a buy/sell trade call. It is an analysis.
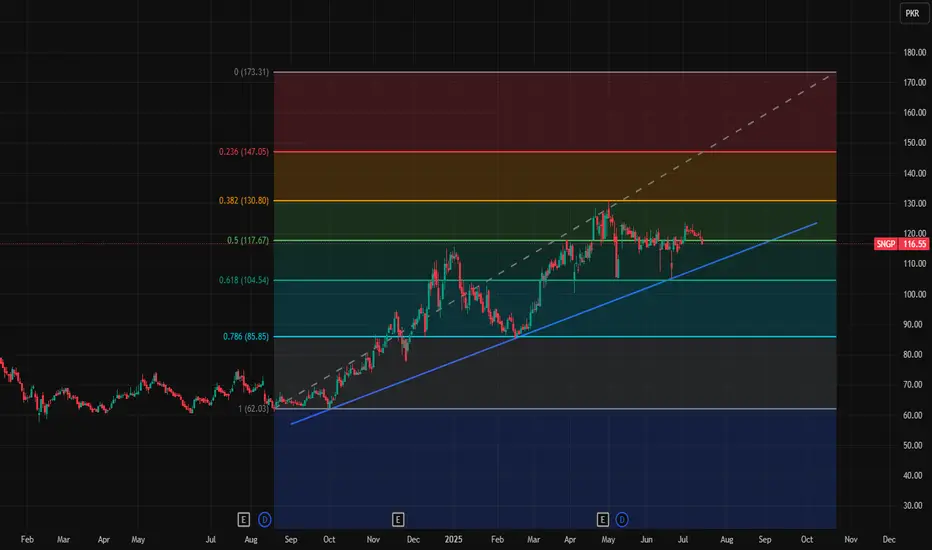
SNGP in long runThis is SNGP daily chart and blue trend line shows its positive movement and it is maintaining sustainable growth.
These are key levels 117.67, 130.8, 147.05 and 173.31
Note: This is not a buy/sell trade call, it is an analysis.
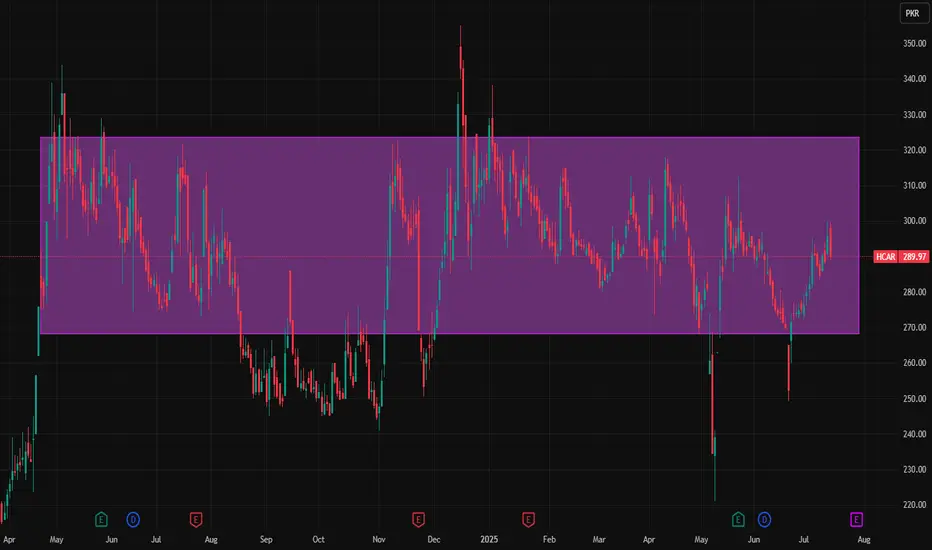
Hcar beltThis is Hcar daily chart and you can se the purple highlighted area is its belt of movement and mostly Hcar is moving between this area.
Note: This is not a buy/sell trade call. It is an analysis.
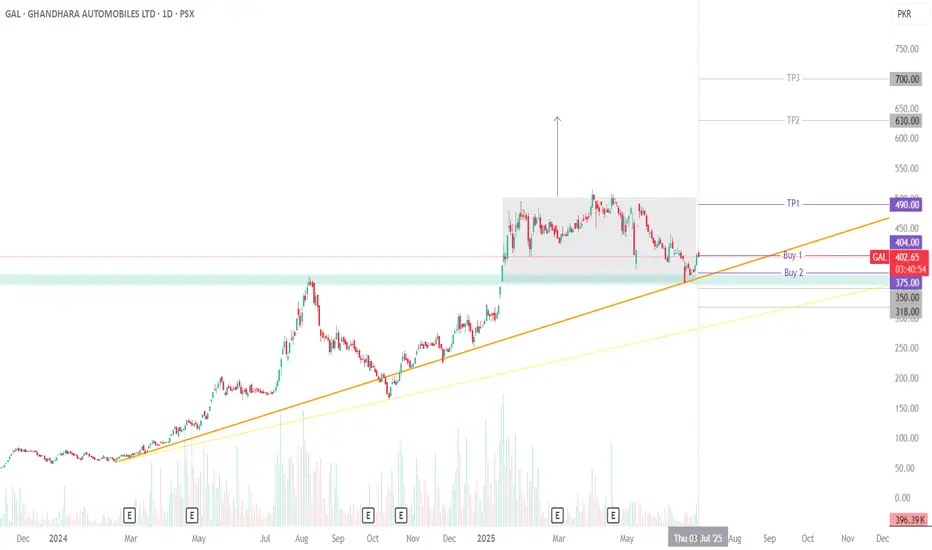
GAL Technical Analysis: Bullish OpportunityGAL (Ghandhara Automobiles Ltd.) is showing a strong bullish setup. Price is holding above its trendline after bouncing off solid horizontal and rectangle support zones. On top of that, GAL has a history of performing well in July, which adds a seasonal boost to the setup.
Fresh entries can be considered at the CMP, while for averaging or pullbacks, 375 and even 350 could offer attractive buy zones if the price dips.
For risk management, there are two stop-loss options: a conservative one below 318 to guard against broader breakdowns or gap fills, or a more aggressive one on a closing basis under 350, just beneath key structure.
Take Profit 1 at 490 lines up with rectangle resistance. A strong close above this opens the door to the next projection around 630. If price manages a firm close above 630, momentum could drive it further, with the AB=CD pattern pointing toward a stretch target near 700.
Trading Recommendations:
Buy 1 (CMP): 404
Buy 2: 375
Stop-Loss (Aggressive): Closing below 350
Stop-Loss (Conservative): Closing below 318
Take Profit 1: 490
Take Profit 2: 630
Take Profit 3: 700
Happy trading!
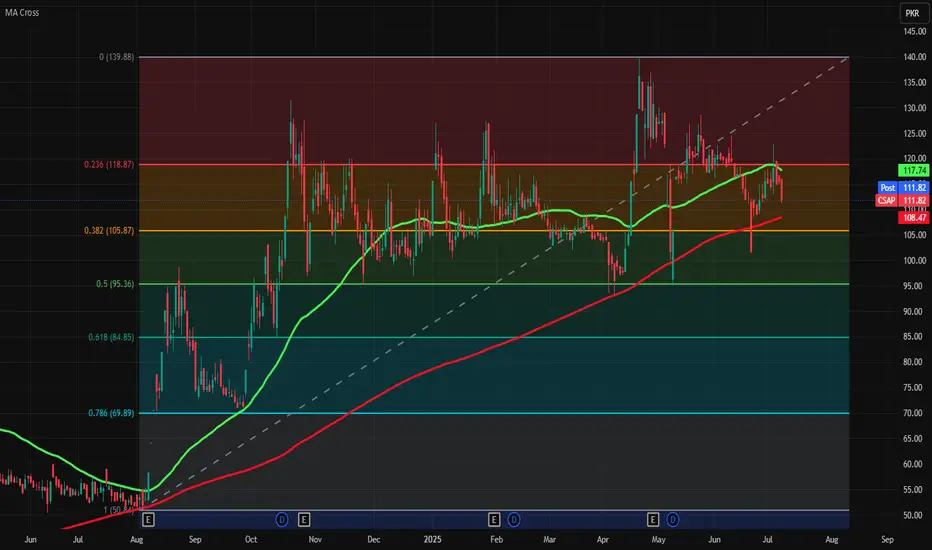
Fresh entry for CSAPAs you can watch it is now below 50 days moving average (green line) and it is also near to 200 days moving average (red line).
Buying conditions:
1) if it cross above green line (117.74)
2) If it fall below from red line (108.47) and cross above it
3) If it fall more red line then wait for its strong support of 105.87 and if it fall below it then wait for cross over above 105.87 level to take fresh entry.
SL is 84.8 and TPS are 118.87 and 139.88
Note: This is not a buy/sell trade call.
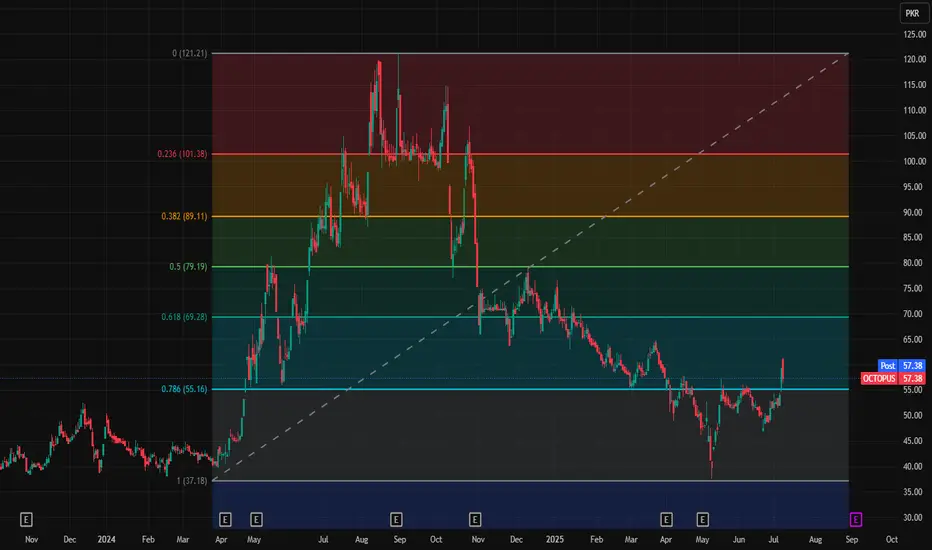
Fresh entry for OctopusOctoous is near to its support of 55.16 and if it fall below it and again cross above it then fresh entry is possible with SL of 37.18 and TPs are 69.28 and 79.19.
Note: This is not a buy/sell trade call.
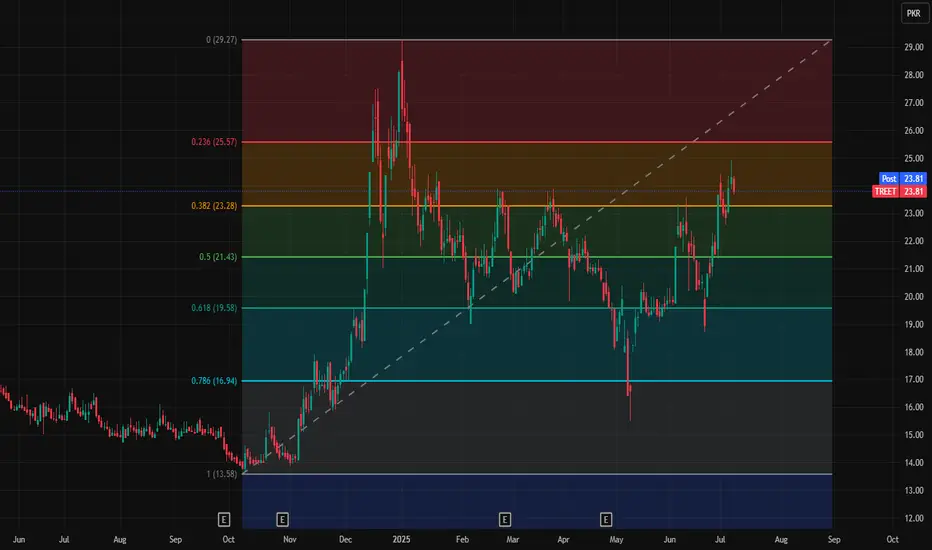
Fresh entry for TreetTreet is near its support level of 23.28 and fresh entry is possible at this level with SL 21.4 and TPs 25.57 and 29.27
Note: This is not a buy/sell trade call.
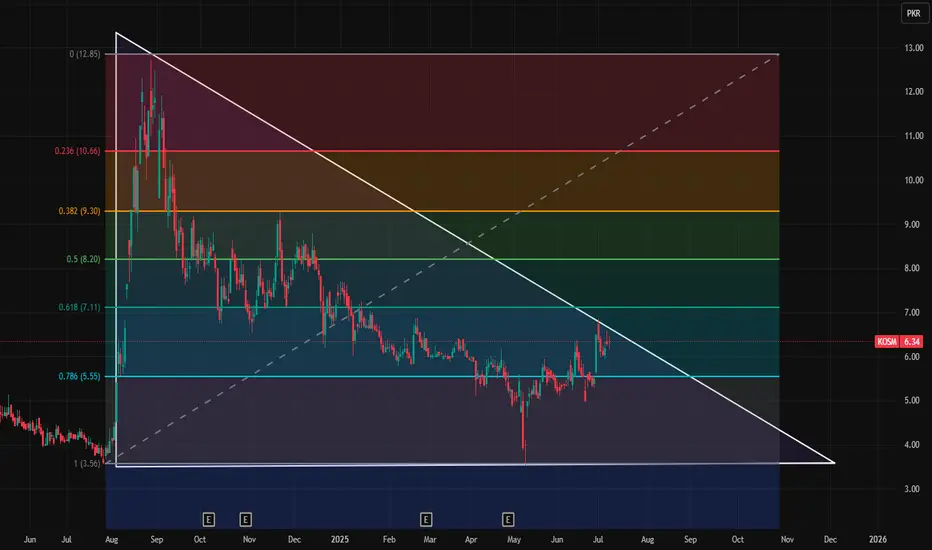
Kosm is ready to flyKosm is near edge of the triangle and if it breaks it, It could fly high as it did. SL is 5.55 and TPs are 7.11 and 8.2
Note: This is not a buy/sell trade call.
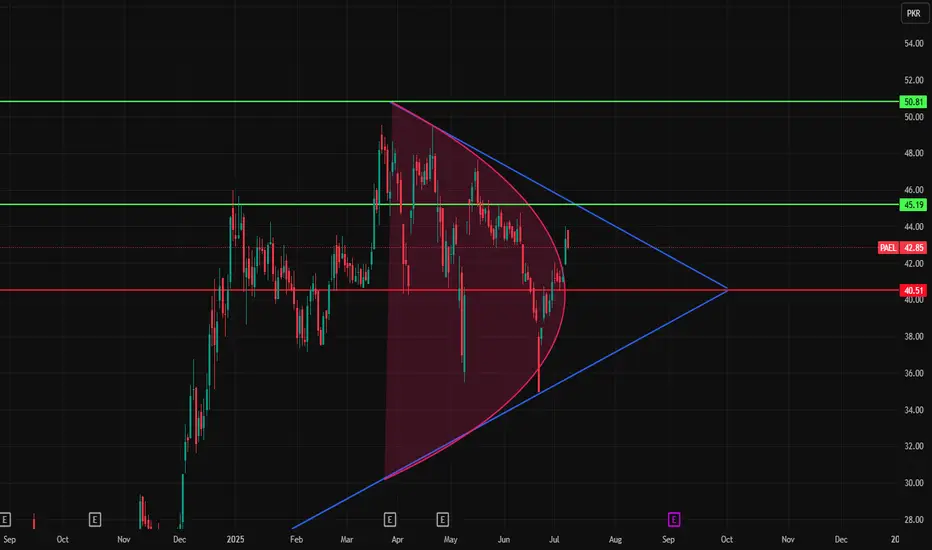
Fresh entry is possible in PAELPael is still in bullish zone and fresh entry is possible on current price 43 and SL should be at red line, TP is green lines.
Note: This is not a buy/sell trade call.
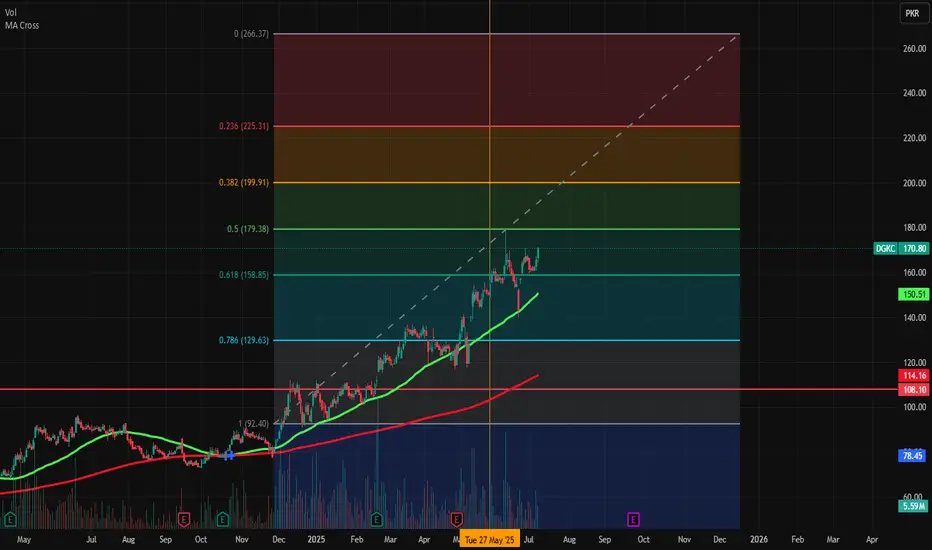
DGCK next levelsDGCK next levels are 179.38, 200, 225 and 266
Note: This is not a buy/sell trade call.
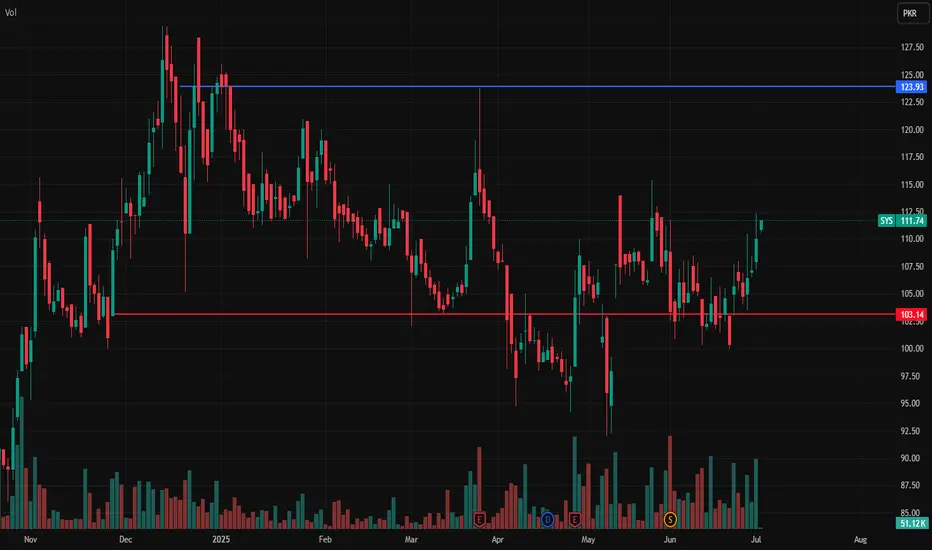
Sys key levelsSys is in bullish trend and buying is possible with blue lines TP and red line SL
Note: This is not a buy/sell trade call.
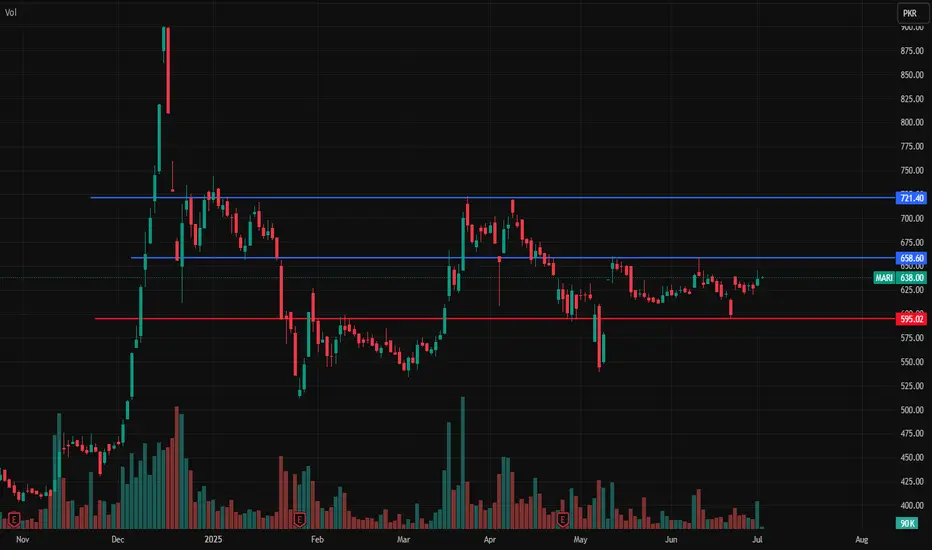
Mari Key levelsMari is in bullish trend and buying is possible with blue lines TP and red line SL
Note: This is not a buy/sell trade call.