Psx is in Bullish ZonePsx is above bearish zone and it is expected to cross 28.33 and 30.32 level.
SL is 23.26.
Note: This is not a buy/sell call.
PSX

GWLC is in Bullish ZoneGWLC is now above bearish zone and may be it will cross 45.3, 47.44 and 49.4 levels.
Stop loss 38.75
Note: This is not a buy/sell call.

Sazew is near to bearish zoneSazew is near breakdown level of 1297.87 (bearish zone). It is expected to drop to 1168.17. Stop loss is 1355
Note: This is not a buy/sell call, It is an analysis.

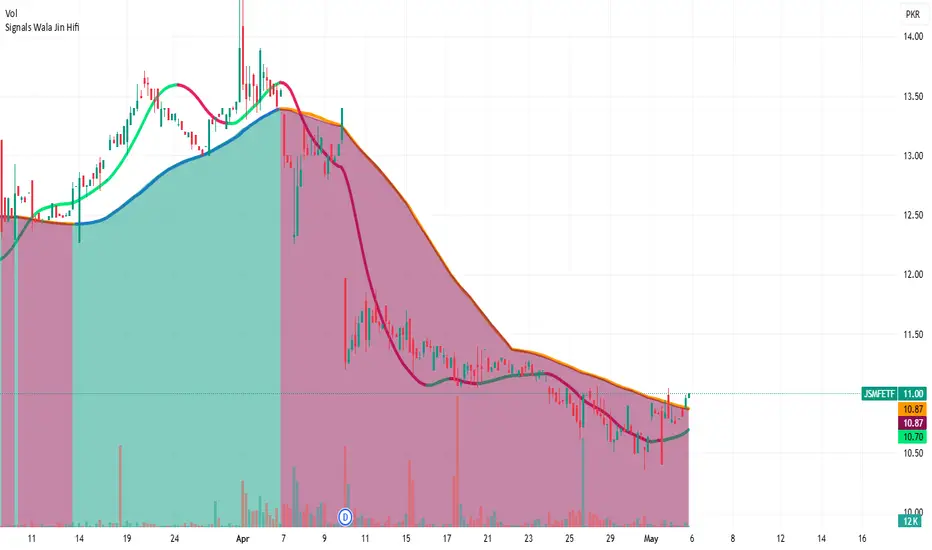
JSMFETF is ready to flyJSMF ETF left bearish zone and again ready to fly to 12 to 15 levels.
Note: This is not a buy/sell trade call. Trade at your own will.
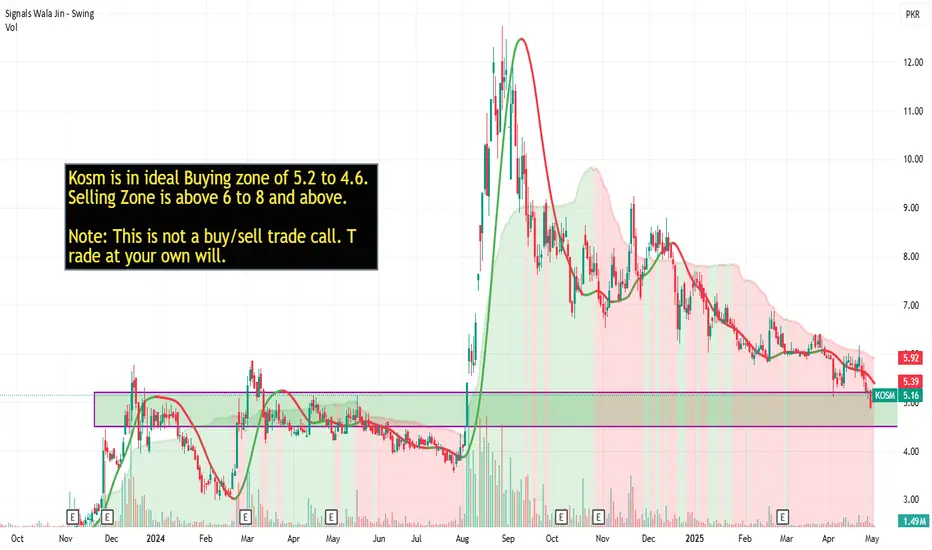
Kosm is in ideal buying zoneKosm is in ideal Buying zone of 5.2 to 4.6. Selling Zone is above 6 to 8 and above.
Note: This is not a buy/sell trade call. Trade at your own will.
Netsol is in ideal buying zoneNetsol is in ideal buying zone of 130 and 117. Its selling zone is 140 to 154.
Note: This is not a buy sell trade call, trade at your own analysis and will.

Pace is in ideal buying zonePace is near to 4.88 a strong support level. it is ideal zone for buy it. Currently at 5.02 level and it could reach its strong resistance level of 5.62 and 6.36 level.
Note: This is not a buy/sell trade call. trade at your own will and analysis.

Mari Swing trading targetsMari is entered into bullish trend and entry is possible, TP1 is 660 and TP2 is 700. SL is 593.
Note: This is not a buy/sell trade call. trade at your own will and analysis. This is for education purpose.

Played exactly the same as predicted last week. KSE100 Closed at 114113.94 (02-05-2025)
Played exactly the same as predicted last week.
Now seems like Hidden Bullish Divergence is appearing.
Important Supports :
S1 around 113100 - 113400
S2 around 110500 - 110800
Important Resistances :
R1 around 114630 - 115120
R2 around 117000 - 117500

BFBIO is entered into Bullish ZoneBFBIO is entered into bullish zone and may be it will cross 150 and 200 levels in few days. Stop loss is 118.
Note: This is not a buy/sell trade call. Trade at your own will.

Searl entered into Bullish zoneSearl is entered into Bullish zone and may it cross 90 and 95 levels in few days. Stop loss could be 80 and 78.
Note: This is not a buy/sell trade call. Trade at your own will.

DGKC entered into bullish zoneDGKC is entered into bullish zone,
Note: This is not a buy/sell trade call.

Gal entered into Bullish zoneGal is entered into bullish zone and may gross 500 and 550 level.
Note: This is not a buy/sell trade call, it is for education purpose, use stop loss.

KSE 100 index (PSX 100 Index) could drop to 110,580This is day time frame chart of KSE 100 index. These are fabionacci levels.
120,898, 110576, 104191, 99030, 93870.

Should wait for a Proper SupportImportant Support @
Channel Bottom
One should wait for a proper support level to take entry.

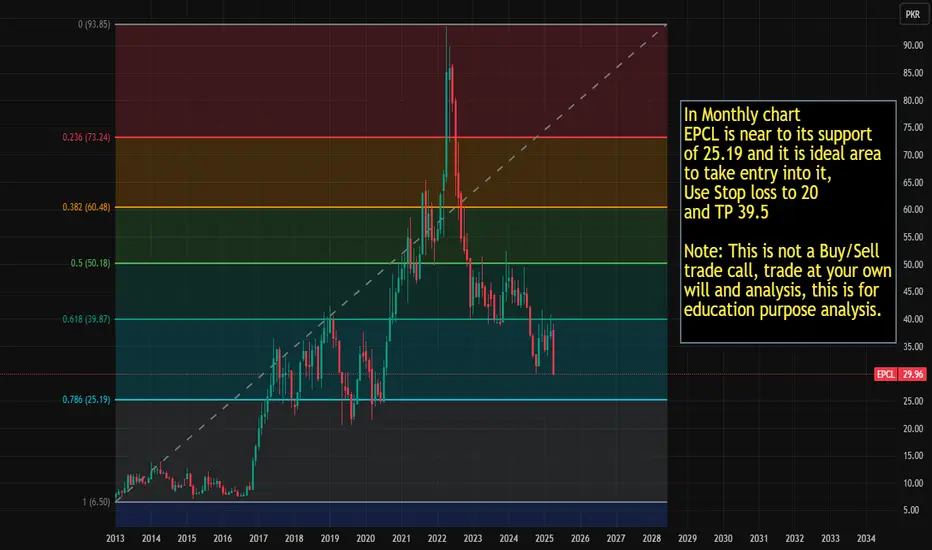
EPCL is in ideal range for entry. In Monthly chart EPCL is near to its support of 25.19 and it is ideal area
to take entry into it, Use Stop loss to 20 and TP 39.5
Note: This is not a Buy/Sell trade call, trade at your own will and analysis, this is for education purpose analysis.
Live Buying Signal in SymLive Khareedo (Buy) signal in Sym at 14.9. Lets see how long it will go.
Note: This is not a buy/sell trade call. Trade at your own will. Use stop loss.

Live buying Signal in FCCLLive buying Signal Khareedo (Buy) in FCCL at 44.9. Lets see how long it will go.
Note: This is not a buy/sell call, Trade at your own will. Use stop loss.

Live Buying Signal in Airlink This is live Khareedo (Buy) signal in Airlink at 168.99, Lets see how long it will go.
Note: This is not a buy/sell call, Trade at your own analysis and will. Use stop loss too.

Live Buying Signal in EfertOur Custom indicator Signals Wala Jin generated live Khareedo (Buy) signal in Efert at 175.45. Lets see how long it will go up.
Note: This is not a buy sell trade call, trade at your own will and analysis. Use stop loss.

FFC entered into bullish zoneYesterday before closing our custom indicator named SignalsWalaJin generated signal "Khareedo" means buy @358 and it was at 361 at closing. Lets see how much it will rise.
Note: This is not a buy sell trade call. Trade at your own will and use stop loss.

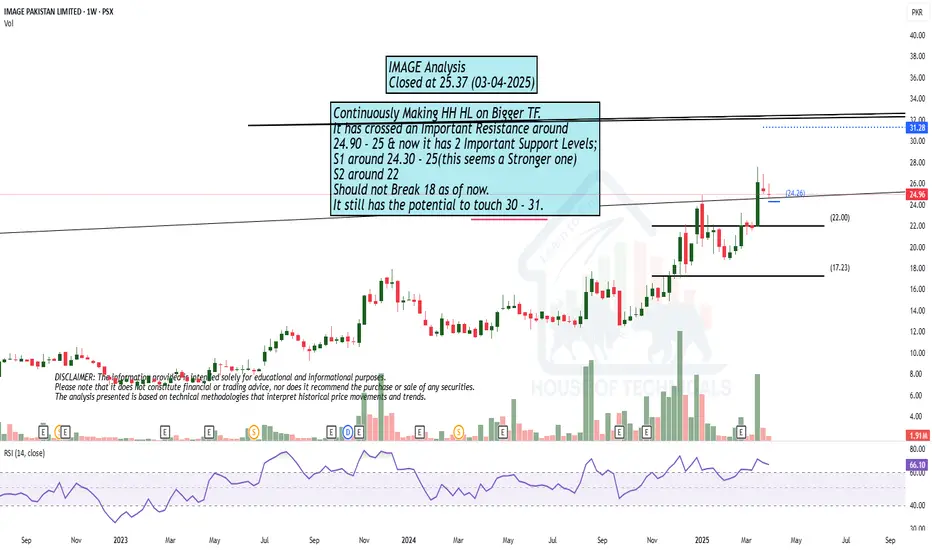
Continuously Making HH HL on Bigger TF.Continuously Making HH HL on Bigger TF.
It has crossed an Important Resistance around
24.90 - 25 & now it has 2 Important Support Levels;
S1 around 24.30 - 25(this seems a Stronger one)
S2 around 22
Should not Break 18 as of now.
It still has the potential to touch 30 - 31.
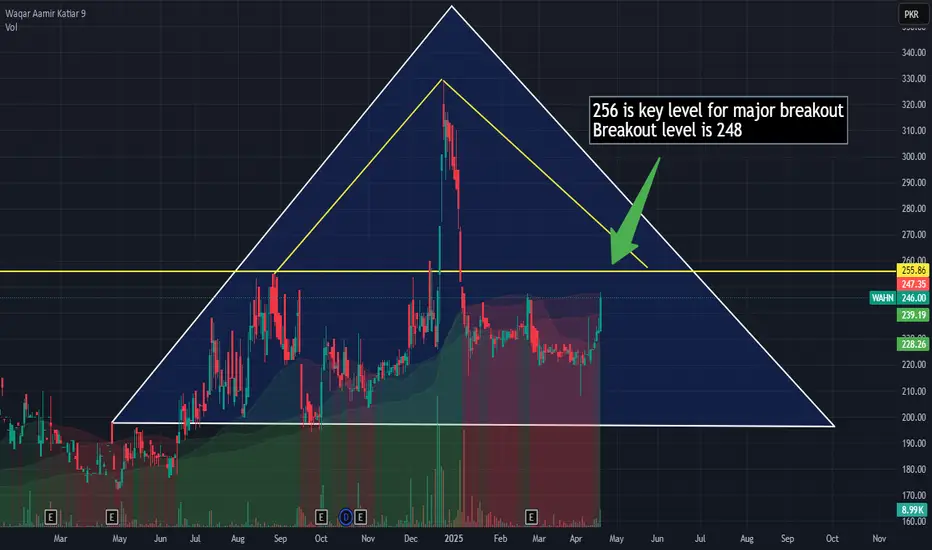
Wahn is near to brakout level. Wahn is near to breakout level of 248 and if it crosses 256, it could be a major breakout for flying again.
Use stop loss and this is not a buy sell call, trade at your own will.