🔥Sell the GBPUSD in the right position and profit +240 pips🧨🔰You can see the analysis of the pound to US dollar currency pair in the 30-minute time frame (GBPUSD_ 30min) 🔍🧨
💥Considering that the price has been able to break its Up trend line🖤, if the price can reach the meeting point of the SUPPLY zone and the pullback point of the Up trend line🖤, it can fall to the DEMAND1 zone 🔻
Do you think this analysis can be profitable❓
I hope the analysis was useful for you🤍🌹
______📈TRADER STREET📉________
Pullback

🧨Sell position of AUDUSD with +350 pips profit⚡🔰You can see the analysis of the Australian dollar to US dollar currency pair in the 4-hour time frame (AUDUSD_ 4H) 🔍🎁
✨Considering that the price has been able to break the Up trend line🖤, if the price can reach the intersection point of the SUPPLY zone and the pullback area, it can first fall🔻 to Support1🧡 and then to support2🧡
Do you think this analysis can be profitable❓
I hope the analysis was useful for you🤍🌹
______📈TRADER STREET📉________

The DAX could retrace further from its ‘bull market’ thresholdThe DAX entered a technical bull market on Tuesday by closing just over 20% higher from its September low. I have lost count the amount of times I have seen a market pull back from the 20% threshold (which is based on no logic that I can see, other than being a nice round number) – so that is just the first clue that the DAX could pull back further.
But we also saw two Doji candles leading into the high, prices were rising on lower volume, and a bearish divergence has formed on the stochastic oscillator. Therefore, the bias is for a retracement towards the 14,000 area whilst prices remains beneath 14,440. At which point we can re-evaluate its potential for a move up to the 14,709 high. A break above this week’s high assumes bullish continuation.

Earn +140 pips of profit by selling NZDCAD at the right price🧨🔰You can see the analysis of the New Zealand dollar to Canadian dollar currency pair in a 15-minute time frame (NZDCAD_ 15min) 🔍🎁
⚡Considering that the price has been able to break the up trend line🖤 and pullback💜 three times, it can first fall to the Support🧡 and then to the DEMAND1 zone🔻
Do you think this analysis can be profitable❓
I hope the analysis was useful for you🤍🌹
____📈TRADER STREET📉______

Dollar Index Short Term Sell IdeaH4 - Price has broken below the bottom of a range and is holding below it.
Lower lows.
H1 - Bearish trend pattern.
Currently it looks like a pullback is happening.
Until the two strong resistance zones hold my short term view remains bearish here.

NZD-CHF Short From Resistance! Sell!
Hello,Traders!
NZD-CHF is making a pullback
From the horizontal resistance
That was hit recently and
A further price decrease
Is to be expected
Sell!
Like, comment and subscribe to boost your trading!
See other ideas below too!

NZDJPY - Looking To Sell Pullbacks In The Short TermH4 - Price respected a strong resistance zone and bounced lower.
Bearish Divergence.
H1 - Bearish trend pattern.
Currently it looks like a pullback is happening.
Until the two strong resistance zones hold my short term view remains bearish here.

💢SELL NZDUSD and get +160 pips profit💰🔰You can see the analysis of the New Zealand dollar to US dollar currency pair in a 15-minute time frame (NZDUSD_ 15min) 🔍🎁
⚡Considering that the price has been able to break the Up trend line🖤 and pullback💜 to it twice, if the price can reach the trend line again, it can fall to the DEMAND zone🔻
Do you think this analysis can be profitable❓
I hope the analysis was useful for you🤍🌹
______📈TRADER STREET📉_______

btcusdt pump Hi everyone, currently we need a pullback for the growth of bitcoin and after that we are going to climb, be sure to look at the 4-hour time frame. good luck

GBPJPY - Bearish Head and Shoulders 📉
The GBPJPY price is in Bearish Head And Shoulders🧐
The neckline is broken & retested🔥
so, i predict a bearish move 📉
TARGET: 154.727🎯
...
if you agreed with this IDEA, please leave a LIKE, FOLLOW or COMMENT!

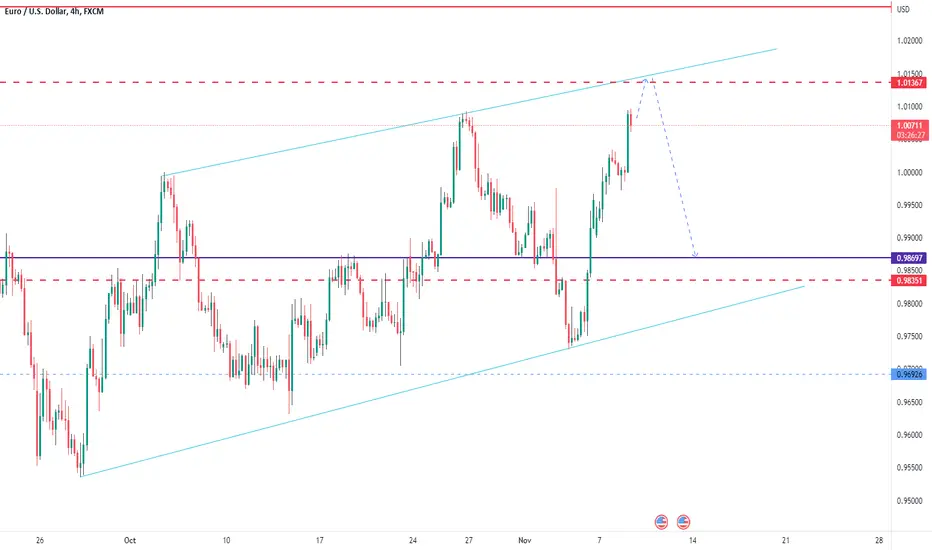
EURUSD APPROACHING RESISTANCEEURUSD has experienced strong bullish momentum and is now approaching the resistance level of 1.01370 from where we can expect a pullback.
Possible retracement targets are 0.99430 and 0.98700.
Watch for price rejection on trendline resistance before going short.
NZDCHF - Looking To Sell Pullbacks In The Short TermD1 - Price is bouncing lower from a strong resistance zone.
Bearish hidden divergence.
H4 - Bearish convergence.
Until the strong resistance zone holds I expect the price to move lower further after pullbacks.

Cable Is In A Correction Within UptrendCable made five waves up from the 1.0353 lows, which suggest that bottom is in place from Elliott wave perspective, but more upside can be seen after a corrective pullback.
We know that after every five waves market slows down for a three-wave setback that is now underway. Probably the pair is going to form an A-B-C flat correction, currently trading in wave B rally that can stop at 1.16-1.17 resistance. Ideal support for the whole correction will be at 1.08-1.06.
Trade well!
Disclosure: Please be informed that information we provide is NOT a trading recommendation or investment advice. All of our work is for educational purposes only.


US 100 Analysis Price action
support and resistance
market structure
impulse wave
correction
break out

The next sell levels on EURUSD On Friday we had a bullish impulse on EURUSD that took price to 0,9966.
This move will most likely continue towards 1,0050.
These will be the next levels where we want to see rejection i potential selling opportunities.
This week, we have important news that are going to affect the market again.

EUR-CAD Short From Resistance! Sell!
Hello,Traders!
EUR-CAD is going up again
To retest the horizontal resistance level
So despite my mixed bias
I think that we are likely to see
A local bearish pullback
Sell!
Like, comment and subscribe to boost your trading!
See other ideas below too!

Does Gold doing wave C? part 3According to a previous post, Seem wave A may be an X wave, and the b correction was finished, So the bigger picture may be a Zigzag, To enter the Sell/Short position wait for the breakout/pull back, Confirm by price action (If I was correct, The price should go further to 1562$, the normal Zigzag target, but truncated can be happen too.)
OANDA:XAUUSD

Dax - Looking To Sell Pullbacks In the Short TermH4 - Price is bouncing lower from a key resistance zone.
Bearish divergence.
H1 - Bearish convergence.
Currently it looks like a correction is happening.
Until the key resistance zone holds my short term view remains bearish here.

GBPCAD - BEARISH RISING WEDGE 📉 The GBPCAD price is in Bearish Rising Wedge & Double TOP Pattern 🧐
The neckline is broken 🔥 the support line of the rising wedge is broken 🔥
so, i predict a bearish move 📉 i'm waiting for a pullback 📈
TARGET: 1.51932🎯
...
if you agreed with this IDEA, please leave a LIKE, FOLLOW or COMMENT!

🎁sell Bitcoin at the right place and get 1160 pips of profit💰🔰You can see Bitcoin analysis in 1 hour time frame (BTCUSDT_ 1H) 🔍🧨
💥Due to the fact that the price has been able to break the Up trend line🖤, if the price can ❗pullback💜 to this line, a suitable area for selling Bitcoin will be created and the price can experience a fall to the DEMAND zone🔻⚡
Do you think this analysis can be profitable❓
I hope the analysis was useful for you🤍🌹
________📈TRADER STREET📉_________

✅AMAZON BREAKOUT CONFIRMED|SHORT🔥
✅AMAZON was trading above the key level
But we are finally seeing a bearish breakout
And the daily candle closed below the level
Which means that the breakout is confirmed
So we are bearish biased now
And after the pullback and retest
We will be expecting bearish continuation
SHORT🔥
✅Like and subscribe to never miss a new idea!✅

SPX: After FED - Will it keep correcting?• The SPX did a strong reaction after FED, and it is trying to recover from yesterday’s drop;
• In fact, this reaction might frustrate the possibility of a pullback to the 21 ema area, which we already discussed yesterday, but it is too soon to tell, as the index must confirm more bullish signs first;
• In order for the index to truly reverse and seek higher resistances, it has to break the main resistance at 3,911, as this key point is the game changer for the index (mid-term speaking);
• As long as it remains under 3,911, the next stop is the 21 ema area, as we already mentioned. Then we’ll see how to proceed;
• The way it’ll close today will tell a lot about its future reaction. I’ll keep you guys updated on this.
Remember to follow me to keep in touch with my analyses!
