🔔 EUR/USD :short setups 🔔hello traders. I was waiting for the price to reach the supply zone 0.9850 to short it, the momentum retreated at the Fibonacci 0.5 level, confirming the end of the correction phase.
Waiting for your opinions in the comments.
Pullback

Stop buying the EURUSD EURUSD completed the upside move to 0,9850 pretty quick.
That means, it's probably best to close all long positions and wait for the right moment to enter again.
We could see a continuation up but buying right now is probably not the best idea.
You should focus on price rejecting the zone.
It could take some time until the market gives us a clear move and that's why you should wait for a further confirmation.

⭕️BUY GOLD at the best place and time 😉 ❗️🔰You can see gold analysis in 15 minutes time frame (XAUUSD_ 15min)💣🔍
💥Due to the breaking of the Downward trend line🖤 by the price, we can expect the price to rise when the price pullback❗ to the Downward trend line🖤 in the overlapping area of the Downward trend line🖤 and Support🧡 until the SUPPLY zone🔺🚀
Do you think this analysis can be profitable❓
I hope the analysis was useful for you🤍🌹
📌Please introduce the channel to your friends 🙏🏻
__________📈TRADER STREET📉___________

It's time for a pullback on EURUSD EURUSD started a pullback yesterday and we expect it to continue towards the 0,9850 level.
Once the pullback ends, we will focus on short positions again.
Buying right now would be considered aggressive and that's why make sure to use less risk!

EURUSD Big Picture Pullback into Continuation ShortsEURUSD made a push to the mid 0.9530s during Asian Session (Sept 28,2022), recovering nicely again to just below previous NY Lows of 0.9580s during London. At this time the 1H Timeframe was in a beautiful downtrend but giving Price Action signals of a possible break.
From a Big Picture point of view, I wanted to see price make a recovery and break again above the 0.9600 (this has just been done during the NY Session (Sept 29). We have a clear break in structure from 1H down, and I am currently waiting on a Pullback to enter on a Long Position and ride the higher timeframe pullback as shown.
Possible Entries: 0.9600
0.9573
Stops between 10-15 pips below these entries
Targets:
Target 1: 0.9750
Target 2: 0.9825
Note: this is not trading advice and/or signals, do your own analysis and manage your risk accordingly.
Would love to hear your feedback. Best of luck in your trading.

GBPJPY - SUPPORT BECOMES RESISTANCE 📉
the GBPJPY price breaks the daily support level ,the old support becomes new resistance level ✔
the key level is broken (1H Break of structure)
so, i predict a bearish move 📉
TARGET: 149.738 🎯
if you agreed with this IDEA, please leave a LIKE, SUBSCRIBE or COMMENT!

EURCHF - SUPPORT BECOMES RESISTANCE 📉
the EURCHF price breaks the daily support level ,the old support becomes new resistance level ✔
the key level is broken (Break of structure)
so, i predict a bearish move 📉
TARGET: 0.94228 🎯
if you agreed with this IDEA, please leave a LIKE, SUBSCRIBE or COMMENT!

A new low on EURUSD! What's next? This morning EURUSD reached 0,9538 after continuing lower, just as expected.
The next support level is at 0,9510, followed by 0,9480.
Selling at current price levels isn't a good idea and we're also not looking for any long trade opportunities!


EURAUD - BEARISH RISING WEDGE 📉The EURAUD price is in DAILY Resistance Level and Bearish Rising Wedge Pattern 🧐
the support line is broken and Retested ✔
so, i predict a bearish move 📉
TARGET: 1.43956 🎯
...
if you agreed with this IDEA, please leave a LIKE, SUBSCRIBE or COMMENT!

EURUSD continues the downside move Yesterday, we saw rejection of the 0,9585 support level. This level should turn into resistance after a breakout.
The downtrend is still on and we should see price heading back to 0,9568 and then eventually 0,9510.
Entries only after further rejection! We're not looking to buy!

Possible rise for Bitcoin to break the topPossible rise for Bitcoin to break the top
But the level of 19020 must be broken strongly
Beware of false BREAK

EURUSD🔻EURUSD SHORT🔻
Here's my perspection on EURUSD ahead the week. Has it has shown the overall trand on is down. If price break below S1 @0.96000 price level, there I will look for a swing short position opportunity down to @0.90000 price level


BTCUSDT pullback to triangle trendlineThere's no reason for bullish bias. The price action shows an engulfing bearish after a pullback to triangle upper trendline, healthy 30% retrace and retest. Supports broken. Price below daily volume point of control -rejected from POC. Expecting lower lows aiming 14.6% as seen on chart. 17K is possible in a next swing downward. Plus hidden bearish sign from Chaikin Oscillator. Fibonacci retracement applied w/ 88.6% and 14.6% key levels. Bearish 2-D swing to complete the major Head and Shoulders correction @ all retracement expected.

MASSIVE DOWN POINT never seen since March 1985The reason I took the trade I simple, there are 4 reasons
First of all, I was waiting to see the breakout of the price and now we can see a descending channel with a downside breakout and a pullback.
Second of all, The price broke the massive support of 1985 which means the price will struggle to break it again as resistance. The probability of the price going down is greater than the probability to go up and challenging the resistance.
Moreover, there is a divergence in the MACD Ind that shows an Inversion in the psychology of sellers. In most cases, they predict an inversion in the trend but the Macd is not even to break the trendline which means we can take profit as long as the price doesn't brake the macd trade line.
I've set my take profit by measuring the width of the channel and put my tp on the same width measurement starting at the pullback.
We might see a downfall even bigger I'll give some news, later on, wait and see.

NZDJPY Short Term Sell Idea Delivered 200 Pips Move!!!In NZDJPY short term sell idea post, I mentioned that "Price is bouncing lower from a key resistance zone on the H4 chart, in addition to this we also had a bearish divergence and lower lows based on the MACD indicator. On the H1 chart, we had a bearish trend pattern so until the key resistance zone holds, my plan here is to sell pullbacks in the short term".
The price action followed my analysis and moved as per the plan here. The pullback that I was looking for happened and then the price moved lower further and has delivered 200+ pips move!
Note: Currently we have a bullish divergence in play, so if you are still involved in the sells then this is a good place to consider managing your trade and secure your profits (cash out or partial cash out or trailing protections or partial hedge, etc.. depending on the strategy that you work with).
Original Idea

🎯ATOM - primed for pullback?🎯ATOM has been one of the most bullish coins this summer, rising 210% from its bottom in June. Consequently, its Bitcoin valuation has risen ~250%.
Recently it double topped around .382 Fib measured from last weekly swing high in April - this suggests we still have bearishness on the long term.
It also tapped into the .782 Fib measured from previous daily swing high in May before the meltdown - this suggests that a pullback will not go too deep too soon towards previous lows.
The big RSI bearish divergence already pointed out that we are due for a correction.
The FOMC press conference today could provide the catalyst for that pullback.
However, there still might be some gas left in this up move, so I don't exclude the possibility to have another leg up before a deeper pullback.🎯
📈The game plan:
1. ATOM needs to break down the 4h 200 EMA support it currently sits on. Wait for candle close confirmation.
2. Scout the ATOMBTC chart - if it goes below previous swing low (68890 satoshi) we have another confirmation.
3. ATOM needs to break down below previous swing low between the two tops (13.225 $). Wait for candle close confirmation.
Profit levels are at 12$ and 10.6$, based on Volume Profiles, depending on your risk appetite. The trendlines could provide support on both charts, so be careful to take profits in time.
Don't rush into it. Let the news be digested by the market. We need at least 75 pp increase on the federal rate to keep ranging, and 100 pp rate increase to move the markets down.
If we keep ranging, I would be more inclined to do this trade on the ATOMBTC pair.
This post links back to yesterday's post regarding overvalued altcoins - thought it would help to share a concrete example.
💎Looking forward for your questions below. If this post provided you value, follow for more.
🚨Disclaimer: this post is for educational purposes only, not financial advice. Do your own due diligence.


GBPJPY Short Term Sell IdeaH4 - Bearish convergence.
Currently it looks like a pullback is happening.
Expecting the price to move lower further after pullbacks.
H1 - Bearish trend pattern.
Until the two strong resistance zones hold my short term view remains bearish here.

AUD/USD updateThe US Federal Reserve is meeting on Wednesday and is anticipated to raise rates by 75 basis points (bp) according to a Bloomberg survey of economists. There has been speculation of a 100 bp tightening but the market has this priced as only a slim possibility.
This rate disparity may put AUD/USD under pressure, particularly if forward guidance from the Fed is more hawkish than they have already been.

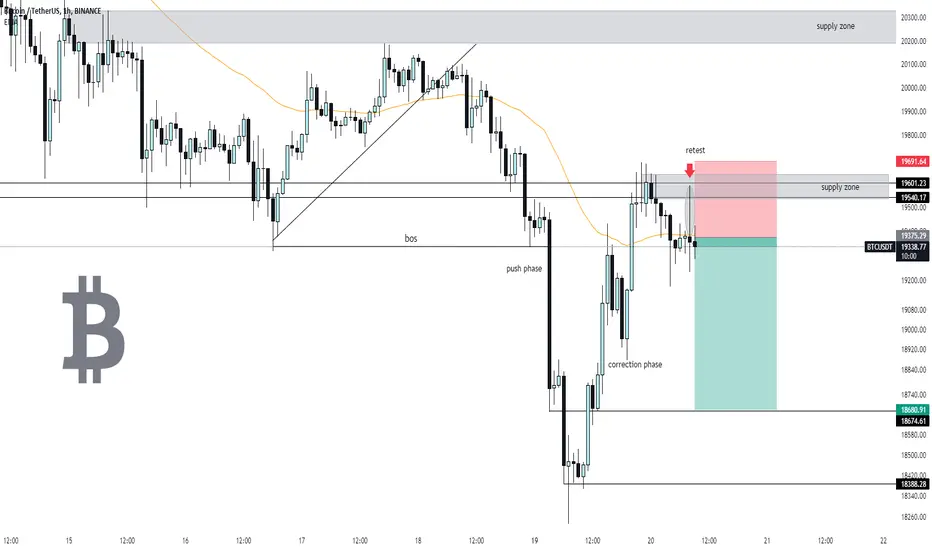
bitcoin Below 20000Bitcoin continues to fall against the strength of the dollar, after breaking the support level of 19600, the price is retesting the area, and the second rejection from the supply indicates the continuation of the fall.
EURUSD on hold before the news EURUSD is rejecting the resistance zone but it looks like it is going to wait the news tomorrow.
Before that, it could continue trading sideways without forming lower lows.
You can look for aggressive entries on the rejection or wait for further confirmation for more conservative positions.
