KCSUSDT is ready for the monthly pullback?the price tested the demand zone on 10$ and get the new liquidity.
Now the price is testing the resistance on 12.5$ after the breakdown from the ascending channel (weekly)
How to approach?
IF the price is going to have a breakout from it, and retest the 12.5$ as new support, we could see a new pullback until the monthly level at 15$, According to Plancton's strategy, we can set a nice order
–––––
Keep in mind.
🟣 Purple structure -> Monthly structure.
🔴 Red structure -> Weekly structure.
🔵 Blue structure -> Daily structure.
🟡 Yellow structure -> 4h structure.
–––––
Follow the Shrimp 🦐
Pullback

Time to sell EURUSD Yesterday we looked at the sell zone on EURUSD
Price has now reached it and it's time to look for a possible reversal and entries to the downside.
We're still expecting another push above 1,0700 and our best entry moment.
Stops will be above the sell area and the reversal!


EURUSD sell zoneLast week we talked about a move up to 1,0660
We expect to see a continuation of this move.
However, it's important to make sure that we know what's going on on the higher timeframes as well.
We already have a sell zone on H4.
That means, once we see price entering the zone we will be looking for a possible reversal and entries to the downside.
All buys should be closed once the market enters the sell zone and especially after we see some reversal candles as well.

NZDUSD Forecast: 2.03% IncreaseNZDUSD is bullish. Why? Price closed above trend line resistance. The close transformed trend line into support. You also see higher lows are increasing. Be on the lookout for a price action signal on the pull back.

EURCAD Short Term Buy IdeaH1 - Bullish convergence.
Currently it looks like a pullback is happening.
Bullish hidden divergence.
Until the strong support zone holds my short term view remains bullish here. A valid breakout above the most recent downtrend line would be the validation for this bullish view.

BNB Trade IdeaPrice has broken the last previous low and now we enter short on the pullback to benefit from good risk to reward ratio. The total market cap of crypto is also showing a bearish sentiment which adds confluence and chance of hitting our take profits.

Rise on EURUSDYesterday we looked at the expected retracement on EURUSD to 1,0660.
This is how we usually look at the chart and wait for a rise on the lower timeframes.
It's still possible that price could drop to 1,0430 and then begin an upside move.
There will be buying opportunities on the bounce of.
Buys are against the main move and they carry more risk. That's why they should be skipped or traded with a lower risk.

USDCHF Short Term Sell IdeaH4 - Price is bouncing lower from the psychological level 1.
Bearish divergence.
Expecting short term bearish moves to happen here.
H1 - Bearish convergence.
Currently it looks like a pullback is happening.
Bearish hidden divergence.
Until the strong resistance zone holds my short term view remains bearish here.

The pullback on EURUSD will continue to 1,0660In the beginning of the week we talked about the potential pullbacks on the major pairs.
Yesterday those pullbacks happened and we can now say where it will possibly end.
EURUSD is trading in a clear downtrend on the H4 and Daily timeframes.
But a part of this trend is a deeper retracement. Exactly what we see right now.
That indicates for a push up to 1,0660 and maybe even higher before the next drop and price eventually breaking below the low at 1,0350.
We don't trade the pullbacks meaning we're not looking to buy but instead, we would rather wait for another selling opportunity.

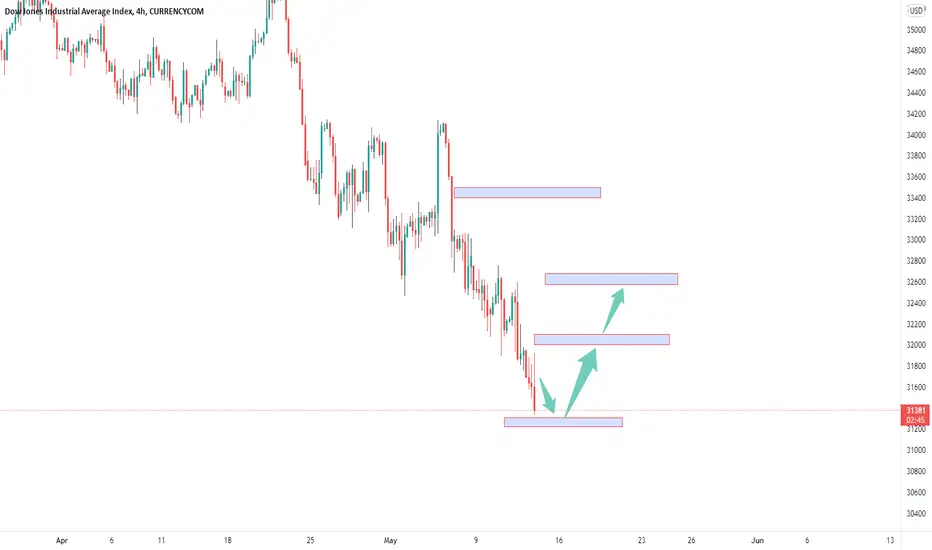
US30 REVERSALThe price is approaching my extended target from the previous analysis which also happens to be the monthly support.
Am expecting a bullish bounce with initial retracement levels at 32000 and 32650
Is it time for a pullback on EURUSD?Today, we're expecting a test of the previous low and most probably a breakout as well which should take price around 1,0300.
Around those levels we could expect a pullback on the downfall that started at 1,1180.
That means we should look to close all of our short positions soon.
Once we form a confirmed low and we see reversal signals we could possibly start to look for long trades.

SOLUSDT wants the 0.618 Fibonacci levelThe price had a bearish impulse until the 37$ where the market has the daily support.
As you can see, the market created a candle with big spike, it means the new liquidity, for that reason if the price is going to flip the supply zone on 59$ we could see a pullback until 72$.
How to approach?
The price needs to flip the 58$ and retest it as new support. If the price is going to gain the momentum we could see a pullback until the 0.618 Fibonacci level. According to Plancton's strategy , we can set a nice order
–––––
Keep in mind.
🟣 Purple structure -> Monthly structure.
🔴 Red structure -> Weekly structure.
🔵 Blue structure -> Daily structure.
🟡 Yellow structure -> 4h structure.
–––––
Follow the Shrimp 🦐

A pullback and another drop to 1,0300 on EURUSD Yesterday we had a breakout of the range and a continuation down on EURUSD.
We're still expecting that price will continue in the same direction after the little break that it's taking right now.
A rejection of the sell zone would be a good entry opportunity,
The next target will be below 1,0300. We will have specific TP levels once the pullback has ended.

$APE is on a pullback. Get in for a 23% gain
On my 4hrchart, $APE has moved into a pullback pattern breaking my 9 period #MovingAverage and poking a small rejection THROUGH a 36 period average.
It's my impression this will move to tye 50 period and test it a couple times.
Using your #RSI you can see the reactivity. If you set your RSI MA at either 7, 9, or 13, you can use it ans a #supertrend.
Each time a green #Hiken-Ashi closes ABOVE the RSI that is an indication to stay in the trade.
This particular move started as a series of green candles were interrupted by a red tiny pin. Then switched back to green. This was simply a pause in tye move. My #Support and #resistance levels show the lower #wick of this pin extended beyond the lower part of the support #zone. Once the jext candle closed #Bullish it solidified the move up for a #pullback and the red candle basically gave you a new #Low to you.
At this point you can
1. enter the next candle
2. Set your stoploss just below that pin-low
3. Set your #reward as a 2:1
This short move on a 4 hour #chart is still about a 20% gain on price. I think it is. I cant remember specifically because that's on another screen but either way, if you're buying at least 3 shares, it's a good move.

BTCUSDT potential Head and ShoulderBTCUSDT potential inverted Head and Shoulder in a expected swing upward on this bullish oversold momentum. Pinbar bottom daily formation.

BTCUSDT ready for the pullback?The price is testing the monthly support where the price has a confluence as you can see on the daily timeframe.
On the 4h timeframe the price could get new liquidity in order to create a new pullback if the price is going to have a clear breakout from 33k.
How to approach?
If the price is going to have a breakout, According to Plancton's strategy , we can set a nice order
–––––
Keep in mind.
🟣 Purple structure -> Monthly structure.
🔴 Red structure -> Weekly structure.
🔵 Blue structure -> Daily structure.
🟡 Yellow structure -> 4h structure.
–––––
Follow the Shrimp 🦐

GBPCAD Buy IdeaH1 - Bullish trend pattern.
Currently it looks like a pullback is happening.
Until the two strong support zones hold my view remains bullish here.

SELLS ON EURUSDEURUSD is the most traded currency pair but also a quite difficult one to trade.
It's like that because it usually stays in a range for a long time without presenting any trading opportunities.
We're still looking to sell and our best shot would be in case of price rejecting 1,0600.
Stops are still above 1,0642 and our target at 1,0400.

BTC - RSI AnalisysBTC broke bearish flag and it is going down.
RSI indicator is very very low at 4h TF and in oversold region in Daily TF.
Pullback expected from 30k to 35 - 37k.
If price not hold 30k then another big dump in the way of 20k.

LINKUSDT The Importance of 0.886 and 0.146 Fibonacci RatiosWhy 14.6% (.146) and 88.6% (.886) are important levels on Fibonacci retracement? The 14.6 Fibonacci ratio, wich has a high mean of assertivity, is mirroned by 88.6, which has become an important entry level and stop loss in the market. 88.6 = 1 - X, X = 14.6. These are hidden levels on the standard scale. But you can add them manually.
As you can see on chart, my fave way to use the Fibonacci Retracement is setting the .50 level at the pivot point** that precedes a pullback, i.e. the lowest low of the first downtrend. The price generally tends to retrace at least to the 0.707* level, which is another hidden level. The most common case in the crypto market, according to my experiences, is the price going into the zone between 0.886 and 0.786. In many cases touching 88.6, which can be considered a conservative point for a stop loss. If the price does not retrace from this zone, then a potential trend reversal can be considered. I have considered the range between 88.6 and 78.6 to be a 'short zone', that is, a zone where I usually wait for a reversive price action, or you could say a potential reversal zone.
When price follows the trend after retracing then I consider 14.6% as my potential target. Means that tendence continues.
This complete zig zag movement is what we call a swing, upward or downward.
*0.707 (70.7%) is the square root of 0.5 Fibonacci ratio, wich is a ratio between 1 and 2.
**Pivot points (some call them "swing points") are those areas where important short term reversals take place.
Okay, let's see what happens during this trade.
Thanks for your attention.

EURUSD will reach 1,0400 this weekEURUSD reached a bottom at 1,0469 on 28th of April and it's been moving sideways for the past 2 weeks.
We're expecting that this retracement is over and this week we will probably see lower values.
Stops should still be above 1,0640 and our first target will be the levels of 1,0400.
Reversal candles around 1,0550 will be the best selling opportunities.

BTC pullback to 39kBTC has hit expected resistance around 47k from the PoC of the volume profile of the drawdown since the ATH to the Jan. 24 low of 33k. If BTC breaks the recent retest of the 55D HMA it will increase the probability of at least retesting 39k. The BBWP indicator below confirmed the end of the recent uptrend, suggesting BTC will at least consolidate for a while
I have doubt that we'll revisit sub 39k in one candle given how long BTC's bearish sentiment has been since the ATH. But if we do break down 39k, these are the support levels to look out for: 33k-35k, 30k, 27k, and 23k. I have my EW targets set there as I believe the range is a bearish triangle pattern ending on the 47k PoC. Nonetheless, it is a bit worrisome to see coins distributed recently from whales.
Short trade:
Entry:45.8k
SL: 49k
TP:39K
Support and Resistance Levels are noted on the chart. Green levels are support, and red is resistance. All other colors are areas of interest that could signify a major
price reaction.
