DARUSDT bearish butterfly in formationDARUSDT bearish butterfly. The price action is in a confluence with the double bottom formation of BTCUSDT. The Fibonnacci ratios is wonderfully converging with local support and resistence. A Potential Reversal Zone (PRZ) is expected from D point 1.41 Fibonacci extention ratio. Oversold condition for the intraday and hidden bullish divergence on Ehlers' Fisher Transform oscillator (detail in aupdates). Ehlers' Fisher Stochastic Sinewave bullish after price action retrace from 50% to 88.6% Fibonacci Retracement. 14.6% Fibo targeting in conjuction to expected XD leg upward Butterfly extension. That's the perfect scenario for a pullback and I bought a buch of DAR tokens for 1USD. Not a financial advice, only my technical analyses.
Pullback

BTC/USDT : Reached channel's bottom!BINANCE:BTCUSDT BINANCE:BTCUSDTPERP
Hello everyone 😃
Before we start to discuss, I'll be so glad if you share your opinion on this post's comment section and hit the like button if you enjoyed it!
$BTC has reached the descending channel's bottom and so there're some similarities to check for...
Last time that $BTC has reached the channel's bottom ( Formed the channel bottom);
It just pulled back above our S/R local Line located on $~40600 and it has retested the channel's top.
Now we have the same bottomed candle formation and the local S/R Line above.
Also on wider Look, We have a stiff support zone at $33400 - $32800.
So based on our data; $BTC can pullback from the local channel's bottom or the lower Support zone!
📝 The main bias is still bearish and I won't use this possible pull-back to take advantage!
I'll only look for possible Longs when we get the closings above $35500 straight from our current level.
- The first confirmation should come to our current candle close just like the marked one.
- The second confirmation should be the candle closings above $35500, Otherwise, It'll drop to the local support zone it'll invalidate our Long position's opportunity ( Trigger will be closings above $35500 ).
- Be informed that our possible short-term bullish will be canceled if we get the weekly closing below $35650.
The importance of the mentioned line is just like $42000 (The main bias changer on weekly TF);
It's been 280 Days (40 Bars/Candles) Since our last weekly close below $35650!
All of the given information is for acknowledgment only!
⚠ The possible pullback won't invalidate our Short-Term positions yet!
Hope you enjoyed the content I created, You can support us with your likes and comments!
Attention: this isn't financial advice we are just trying to help people with their vision.
Have a good day!
@Helical_Trades

harmonics showing daily bounce attemptid call it 68/32 that we have a daily bounce attempt if we hold these lows. id look for a lower weekly high, and some additional bearish activity going into this week.
weve had a good rundown toward support that did break lower on the real body of futures and cause momentum toward backwardation. 5-6 weeks of red usually calls for a countertrend rally and elliott wave scenario is playing out correctively. this is why im sticking to the plain red path in the middle.

KNCUSDT wants the pullback?
The price is going to have a retracement after 4 months of the uptrend and now it's testing an important area as new support.
The price could have a pullback before a new bearish impulse until the monthly support.
So, how we can approach it?
IF the price is going to have a pullback, According to Plancton's strategy , we can set a nice order
–––––
Keep in mind.
🟣 Purple structure -> Monthly structure.
🔴 Red structure -> Weekly structure.
🔵 Blue structure -> Daily structure.
🟡 Yellow structure -> 4h structure.
–––––
Follow the Shrimp 🦐

Pullback or Breakout, move up to 42800On 1H TF
BTC's dropped to 35250 with the complete impulse wave.
Right now, it's trading around 35800.
After impulse wave, the correction wave will happen, pullback to 42800.
Wait and see

usdcad shortUSDCAD SHORT IDEA
SUPPORT AND RESISTANCE
........................
TREND ...........
PRICE ACTION
.........................
CANDLESTICK ANALYSIS
.......................
FAKE OUT
...........................
PULLBACK
...................
CANDLE PATTERN
................................
...............
..............>>>>>>>>>>>>>>>>>>>>>>>>.
ANALYSIS
TRADING
MARKET
HAMMER
Tops and Bottoms Analysis
market structure

New sells and a new bottom on EURUSD After a sharp move up during the Interest rate decision yesterday has actually showed us what will be the main direction.
Once again, we're heading towards a breakout of the previous lows and our next target at 1,0400.
That gives us new opportunities with stops above 1,0642.
Today we're expecting the NFP which will most probably cause big moves again and it might lead to a new low on EURUSD.

ALGOUSDT|Bull trap or Pullback? Ending Diagonal Wave ProjectionPrice action and chart pattern trading setup
> Falling Wedge Ending Diagonal - Bull Trap or Pullback?
> Entry @ downtrend line breakout of wave 2 and wave 4 or SMA50 zone
> Stoploss @ the lowest minor wave iii/v estimated position - downside limited for final wave 5 -10 - 15% and can be truncated
> 1st target at wave 4 position for short term trade and wave 2 position for the medium term. SMA200 is the key dynamic resistance
> RRR: 2:1 for short term and 3:1 for medium term
Always trade with affordable risk and respect your stoploss.

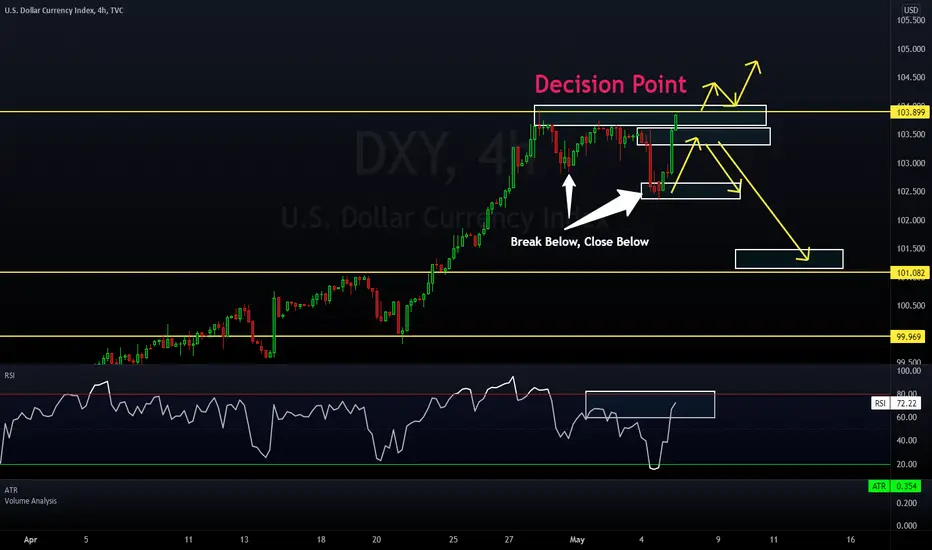
DXY 4 Hour - Decision PointWe've been tracking the DXY for a while now as it's rallied up into 2017 highs only to hold a structure followed by a break below, close below. This price action pattern allows me to make a bearish prediction with my personal tactic of entry being to wait for a pullback into previous structure resistance.
Our pullback has occurred & is currently looking to once again retest the highs of previous resistance which puts us at an interesting "decision point"
IF price can hold resistance again then it would be a positive sign for our short idea. HOWEVER, if price were to violate the highs, then we would be right back in bullish continuation mode with the next stopping point on my radar being 106.40's.
As always, if you have any questions or comments on this idea, feel free to leave them in the comment section below as I do read through each and every one of them.
Have a great rest of the week in the markets & an awesome weekend!
Akil
Bearish Outlook on the US100 NASDAQ100 - TRADE ALERTI see a tall trading range within a Bear Trend on the Daily Chart.
It has hit the highs multiple times.
The DAX40 is dropping , could the NAS also drop . (there is often less correlation, in fact the European indices usually follow the US indices)
I'm going short on the NASDAQ...

BTCUSDT weekly overview updateIf price action stay below 37.2k, we can see a downtrend in the next week. Price above, we can expect a right shoulder formation. I'm thinking is most probably a pullback to 40k after breakdown. Oscillators: Ehler's Even Better Synewave and Ehler's Smoothed Stochastic.

EURUSD before FED Today is FED's Interest Rate decision.
We're expecting to see a rise from 0.5% to 1%.
A rise will definitely happen but what's more important is by how much and when would be the next one as well.
Technically, we're in a strong downtrend which is more likely to continue therefore we should see lower values.
The Interest rate decisions normally cause big moves and rejection wicks in price.
A conservative approach would be to look for entries after the news or also tomorrow.
The aggressive way to trade it would be to look to sell around 1,0590 and make an entry right after the news if there's a nice long wick.
The target is 1,0400!

ETH/USDTBINANCE:ETHUSDT
if the Ethereum has broken its channel in the bottom , then it can fall to the next support zone.

EURUSD Short Term Relief Rally - May 2022EURUSD has formed a range at the 1.05 level over the last few days suggesting a support has formed here, at least temporarily. If this support is indeed a strong one, we will see a break of the structure on lower timeframes to at least 1.0650-1.0675. I'm not as confident Euro can rally higher than that, we'll more than likely continue some ranging structure if 1.05 is holding.

EURUSD closer to 1,0400Like we said yesterday, this week we're expecting a new low.
We could place our SL above the levels of 1,06 and our first targets would be 1,04.
We've got FED Interest Rate tomorrow but until then we can see lower values.
Reversal candles around 1,0550 are considered a good sell point.

Are we going to see a new low on EURUSD this week?The downside move continues and it looks like we will see another low on EURUSD.
The pullback that happened on Friday gives us a chance to enter short again with targets at 1,0400.
This week, we also have FED Interest rate as well as NFP.
That could possibly mean big moves and potential reversals.
At the beginning of the week, we're looking for a breakout of the previous low and we don't want to see price breaking above 1,0600!

Buy INTELLECTPULLBACK TRADE IDEA
Buy INTELLECT around 760-765 levels
SL: 749 (Closing Basis)
Add more above 810 - Pyramiding (Increasing Position Size)
Targets..900..980++
Note:
805-810 is the support level which is currently broken by the stock. This level will now act as resistance, stock will boom further up if it crosses this level decisively
This is not an investment pick. Stock may correct more, if it doesn't hold the levels mentioned on the chart.

A new low and a possible pullback in the last day of the month We see a new low on EURUSD every single day. Today, we're expecting the same.
In case price breaks below the previous low, we will be looking to close all short positions.
After such a move, there's always a time when the big players collect profits and close their positions.
That usually creates a pullback.
This is not going to reverse the trend but it will actually give us a better entry level for a continuation of the main trend.
Good luck!

AUDCAD - Looking To Sell PullbacksD1 - Price is bouncing lower from a key resistance zone.
Bearish convergence.
H4 - Bearish trend pattern.
Currently it looks like a pullback is happening.
Until the two key resistance zones hold my view remains bearish here.

Potential Shark Forming!DXY - Potential shark forming at strong PRZ (Weekly resistance) The Dollar is in need of a pullback haha, i'll be waiting for the B point to break before really looking for this shark to complete/using it as a BIAS.
Let me know your thoughts!
* Disclaimer **
These ideas I never trade until the end target with my initial lots, I focused on high probable entries with higher lots and use a specific partial taking strategy giving me a very high win rate and take most of my profits very early, I only leave a small % of my capital to run the entire trade. On the flip side im constantly monitoring LTF momentum and will close early if things change, these analysis's are for research purposes only.

EURUSD is heading towards 1,0400EURUSD continues the downside move with almost no pullbacks.
We're expecting the same thing today and a move below 1,0500.
The next support level is the low from December at 1,0400.
We're expecting a test of those levels and possibly a breakout as well.
Before that we could see a deeper pullback due to traders collecting profits. That normally happens at the end of the week or the end of the month.

The next target on EURUSD - 1,0600The downtrend on EURUSD continues and we're expecting that price will move in the same direction.
That means, we're only looking for short positions.
The best entry opportunities are on the pullbacks which in this case might be below 1,0700.
In case of rejection around those levels we will be looking for a continuation down below 1,0600.

EURAUD - Looking To Buy Pullbacks In the Short TermD1 - Bullish convergence.
No opposite signs.
Expecting short term bullish moves to happen here.
H4 - Higher highs.
Currently it looks like a pullback is happening.
Until the key support zone holds my short term view remains bullish here.
