EURCAD - Looking To Sell Pullbacks In The Short TermH4 - Price has broken below a strong support zone which currently acts as a strong resistance zone after the breakout.
Lower lows.
No opposite signs.
Until this strong resistance zone holds I expect the price to move lower further after pullbacks.
Pullbacksell

GBPUSD - Looking To Sell Pullbacks In The Short TermD1 - Price has reached a strong resistance zone.
Bearish divergence.
H1 - Bearish divergence.
Lower lows.
Until the strong resistance zone holds my short term view remains bearish here.

USDJPYPrice created a higher high on the Daily timeframe. On the 1h timeframe price broker a higher low structure and is heading back down to create a proper higher low on the Daily timeframe. We are selling this pullback for an approximate 1:5RR and then looking to buy near 135.500 area

GBPAUD - Looking To Sell Pullbacks In The Short TermD1 - Strong bearish move.
Currently it looks like a correction is happening.
Bearish hidden divergence.
H1 - Bearish divergence.
Bearish trend pattern.
Currently it looks like a pullback is happening.
Until the strong resistance zone holds I expect the price to move lower further in the short term.

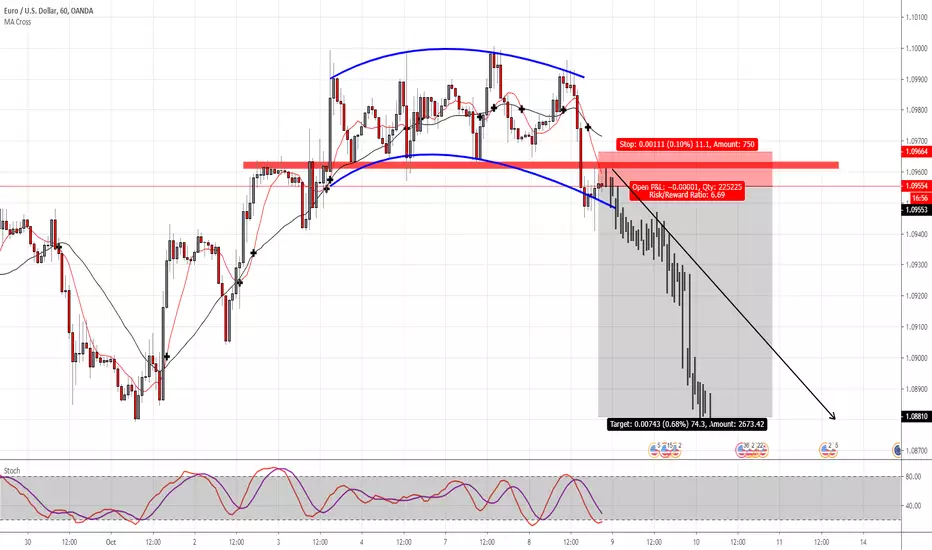
BTCUSD Market in Fibonacci (pullback to neckline accomplished)BTCUSD Price Action
PULLBACK to Head & Shoulder's
neckline accomplished.
Real correction expected.
Lower low expected.
Fisher Transform oscillator's confluences/divergences
in Fibonacci ratios time frames (daily candlesticks)
Technical Analysis
- ATH-2ndTop'swing = 100% Fibonacci;
- 2ndTop-3thTop'swing = 88.6% Fibonacci;
- strong divergence till 10 Nov ’21 ATH;
- Fisher crossing near
Ehler's Smoothed Stochastic's
same overbought condition
of All-Time-High with clear crossing near
*Weekly bearish wave expected

Shorting on a pulllbackThis looked like a nice setup to short the pullback, even though the last leg was a bit too strong, I took it.

all you want is in here (chart) I think the FX:EURUSD break the Channel and 'pullBack' to that and is read to get Short .

ADA/USDT A pull back to 1.8 for ADA then a bounce to the upside.Let's be realistic here, the market for ADA is quite extended right now so expect a pullback then a bounce off to the upside. This is looking very bullish especially with the smart contract on the side so expect to break the all-time high.
The RSI is above 80 so look out for the prices to either stay stable or correct itself to around the $1.9 level. I still believe that after this correction (I may be wrong), the prices will likely go parabolic as it has proven before.
A good opportunity to buy right now would be patient for a pullback to 1.8-1.9 or a market crash (anything can happen in crypto as we've seen it before). You could indeed short right now but add a stop loss at about $2.2 because we've seen how bullish ADA has been in the past week. You may hate me to say short right now you have to sometimes be a bear and sometimes a bull to be a good trader.
Good Luck EVERYONE and don't trade money you can't afford to lose!

NZD/USD multi time frame analysis - Possible Down MomentumPurple Line = Daily SNR/Trendline
Red Line = 4 Hour SNR/Trendline
Orange = 1 Hour SNR/Trendline
If this help you with your trading Please Like, Share and Follow that give me motivation to make another Trading Ideas
If you have some suggestion, comment or other opinion feel free to write it in comment
Wish you succesfull and consistent trading with profits!
This is not an investment advice.
"CFDs are complex instruments and come with a high risk of losing money rapidly due to leverage. Between 74-89% of retail investor accounts lose money when trading CFDs. You should consider whether you understand how CFDs work and whether you can afford to take the high risk of losing your money."


CHFJPY channel break outwe'll waiting for pull back on the broken channel
ichimoku and static resistance will support us
good luck ;)

Banknifty PullbackOn daily time-frame bank nifty Showing potential pullback probability. NSE:BANKNIFTY
Conformations :-
Fibonacci Retracement Resistance
Flag resistance
Bearish Engulfing Pattern

GBPAUD PULLBACK I love trading these small pullbacks. We have a clear three drive pattern, watching RSI shows price can't surpass the 67-68 levels. OVERBOUGHT.
Sellers stepped in and continue to push price down. Possibly to test that support line I've drawn. Let me know your thoughts on pullbacks. We know this is a small pullback before another potential push to the upside.

Sell on PullbackAfter breaking below the ascending trendline, we will now be looking to retest it on a pullback towards the 0.5 Fib level in correspondence to the previous resistance zone.

Second pullback shortInfo in the charts.
lots of bagholders in this.
The amount of volume that needs to come in for this to break out would have to overwhelm resistance volume

EURUSD #Forex #ForexTrader #ForexTrading #ForexChartEURUSD - Shorting opportunity
Broke a nice zone and is just putting a re-test of that zone.
EUR weakness due to all the Brexit shenanigans.
Any questions feel free to ask
Ben
#PipGainFX

Short GBP/NZD Pullback, RSI OverboughtNow's looking like a good time to short the GBP/NZD pair as RSI (14) is indicating an overbought signal which confirms a pullback is bound to happen. Price should drop back to previous structure or even the tested trendline so we'll keep an eye out on these zones.
Trade Details :
SL : 1.9755
TP 1 : 1.9600
TP 2 : 1.9440
Join my free trade signal group on Telegram & start making profits with me!
Link : t.me

Update to early counter-trend IdeaThe asset is still in an up-trend, however, opportunity exists for a pullback short.
It is currently in that phase of bulling back. Yes I said bulling back.

GBPUSD: NEUTRAL OUTLOOK WITH BUYING POTENTIALSince finding support around 1.2690 the Pound has managed to retrace ~350 pips and is now sitting right below the 1.300 handle, which was formerly support now turned resistance. Depending on today's close, we might be entering into a range as the Dollar continues to give ground against the other majors. For now, I'll be watching and waiting for a signal from my system to initiate a long entry or a short if price action breaks down below the pullback trendline.

EURCHF Sells. Keeping the read and approach really simplistic.Looking to sell this pair as it comes up towards 2100. If it comes up way too aggressive, the sells would be off. If not, would be expecting to take the sell there to at least the recent low.

Oil Sell IdeaW1 - Potential second false break with bearish divergence.
D1 - Price is currently near the middle of the range.
H4 - We may now look for pullbacks and sells.
