C / UsdtBINANCE:CUSDT
### **📊 Chart Overview – CUSDT (1H):**
* **Current Price:** \$0.3225
* **Recent Trend:** Price is consolidating below a **descending trendline (red)** after a sharp decline from \$0.44–\$0.45.
* **Key Levels:**
* **Support:** \$0.31 – \$0.32 (highlighted zone).
* **Resistance:** \$0.34 – \$0.35 (trendline breakout needed).
* **Major Resistance:** \$0.4456.
---
### **🔍 Technical Breakdown:**
1. **Downtrend Continuation:**
* Price is still below the **red descending trendline**, which acts as dynamic resistance.
* As long as it stays below \$0.34, the bears remain in control.
2. **Bullish Scenario:**
* A **clear breakout above \$0.34** with strong volume could lead to a push toward **\$0.37 – \$0.40**.
3. **Bearish Scenario:**
* Failure to hold **\$0.31 – \$0.32 support** could open doors to a drop towards **\$0.30 or even \$0.28**.
---
### **📌 Summary:**
CUSDT is in a **critical consolidation zone**. Watch the **\$0.32 support** and **\$0.34 resistance** closely — a breakout or breakdown could decide the next move.
---
⚠️ **Disclaimer:**
*This analysis is for educational purposes only, not financial advice. Always do your own research and trade carefully.*
Pumpanddump

Moodeng / UsdtGATEIO:MOODENGUSDT
Nice move on **MOODENG/USDT** — structure respecting support zones well! Let's see if it pushes toward that resistance. 👀📈
**Disclaimer:** This is not financial advice. Always DYOR.


$JOBY pre-mature ejaculation fueled by Hopium- NYSE:JOBY pumped by X/Twitter gurus. They claim themselves to be early picker of innovative company whereas truth is they have massive following which is causing pump and dumps.
- SEC should investigate these X influencers pumping small cap companies and then claiming that they are picking 1000% gainers.
- I don't know how the F, a company making 15 mil in revenue is sitting with 15 billion market cap. Someone needs to investigate these X pumpers and the connection with these companies like NYSE:JOBY execs if they are getting money under the table.

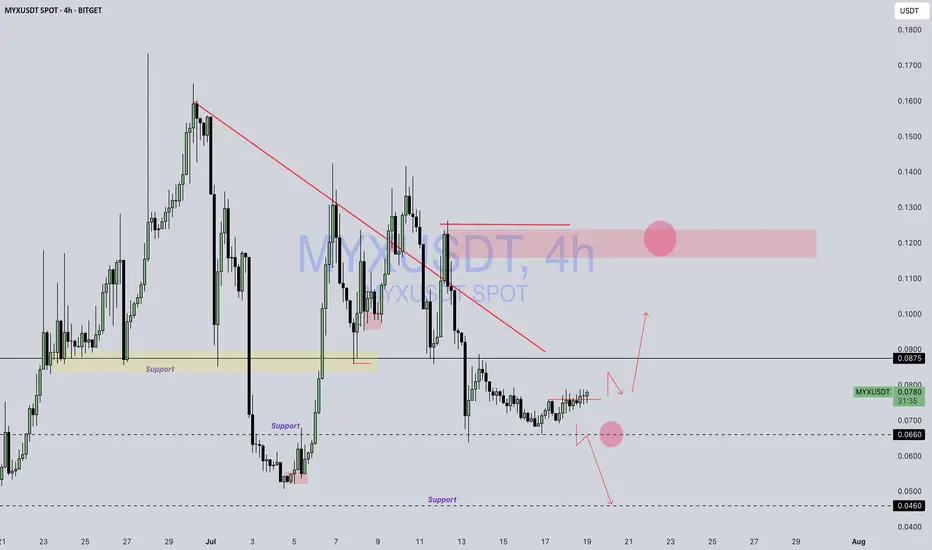
MYX / USDTBITGET:MYXUSDT
Something’s cooking in MYX… 🍳📊
Be careful now — and enjoy it later.
The chart’s heating up — don’t sleep on it. 🔥👀
Disclaimer : Not Financial Advice
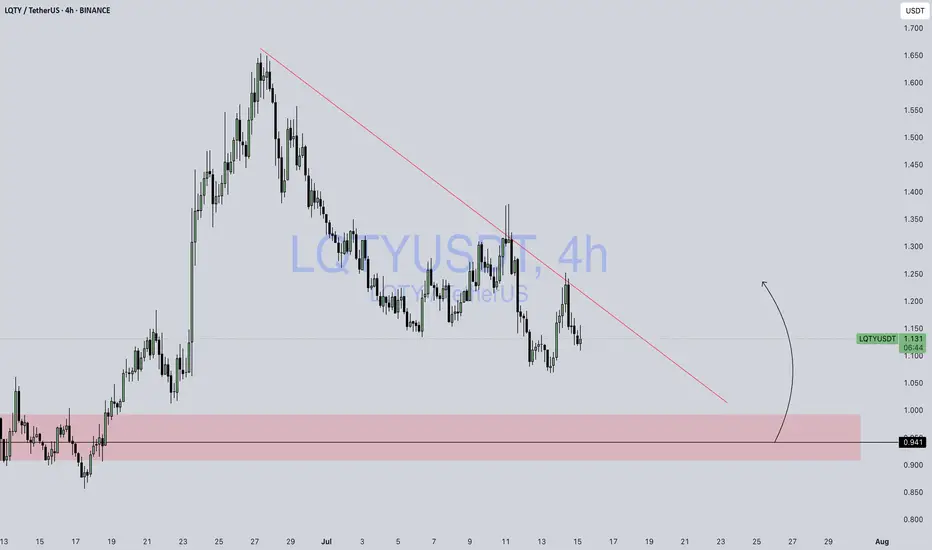
LQTY / USDTBINANCE:LQTYUSDT
📊 **Chart Overview – LQTY/USDT (4H, Binance):**
* 📍 **Current Price:** \$1.134
* 🔻 **Downtrend Line:** Strong descending trendline still acting as resistance.
* 🟥 **Demand Zone (Support):** \$0.91 – \$0.96
* 🟢 **Scenario Projection:** Price might **retest the demand zone** before attempting a bullish reversal (marked by the black curved arrow).
---
### 🔍 Key Observations:
1. **Trend Structure:**
* Price has been respecting a **descending trendline** since the \$1.65+ top.
* Recent rejection from the trendline suggests **sellers are still active**.
2. **Price Reaction Zone:**
* The highlighted **support zone (\$0.91 – \$0.96)** has a history of strong buying and breakout behavior.
* If price drops into this region again, it may trigger a **bullish reversal or bounce**.
3. **Bullish Opportunity:**
* If price **taps into the demand zone with a long wick / strong candle close**, it could be a **high-probability entry** for long setups.
* Potential upside: **\$1.20 – \$1.30** range.
4. **Invalidation:**
* A **clean break below \$0.91** would invalidate the bullish scenario and signal further downside.
---
📈 **Trade Idea (Hypothetical):**
* **Entry Zone:** \$0.94 – \$0.96
* **Stop Loss:** Below \$0.89
* **Target 1:** \$1.15
* **Target 2:** \$1.25
---
⚠️ **Reminder:** This is **not financial advice** – always use your own risk tolerance and confirmation tools (volume, candle close, etc.)
KLV / Usdt GATEIO:KLVUSDT
📊 **Technical Analysis – KLV/USDT (4H):**
* 📍 **Current Price:** \$0.001968
* ⛔ **Immediate Resistance:** \~\$0.001980 – \$0.002000
* ✅ **Support Levels:**
* Minor support: \~\$0.001940
* Stronger support zone: \~\$0.001900
---
📈 **Market Structure & Scenario:**
The red lines and arrows in your chart show a **projected bullish scenario** with a **short-term dip** and **higher low** forming before a breakout.
1. 🔄 **Expected Retracement:**
A pullback to around **0.001940–0.001920** is expected, where price may build a **base or liquidity grab**.
2. 🔼 **Bullish Continuation:**
If that support holds, a strong move upward could follow — potentially retesting **0.002060–0.002100** area (previous highs).
3. ❗ **Invalidation Zone:**
A close **below \$0.001900** may break the structure, making the bullish scenario less likely.
---
🧠 **Summary:**
* Structure suggests **accumulation**, not a confirmed breakout yet.
* Market might form a **W pattern** (double bottom) before a launch.
* Wait for a retest + bullish confirmation candle if you’re entering long.
---
⚠️ **Not Financial Advice** – use proper risk management and always check volume & news for confirmation.

Boom / Usdt KUCOIN:BOOMUSDT
📊 **Technical Outlook – BOOM/USDT (1H):**
* 🟢 **Current Price:** \$0.01760
* 🟩 **Support Zone:** Around \$0.01700 (highlighted in the lower red box) – price recently bounced from this zone.
* 🟥 **Resistance Zone:** Around \$0.01900 – \$0.01950 (upper red box) – price has previously rejected here.
* 📈 **Short-Term Bias:** Bullish attempt – the chart suggests a **potential move upward** toward the resistance area, as shown by the red arrow.
---
🔍 **Key Observations:**
* Recent **higher low formation** suggests bullish interest.
* If momentum holds and volume confirms, price may **retest the \$0.019+ level**.
* However, if the price fails to hold above \$0.01720, the upward setup could be invalidated.
---
⚠️ **Note:** This is **not financial advice** – always manage risk with proper stop-loss levels.

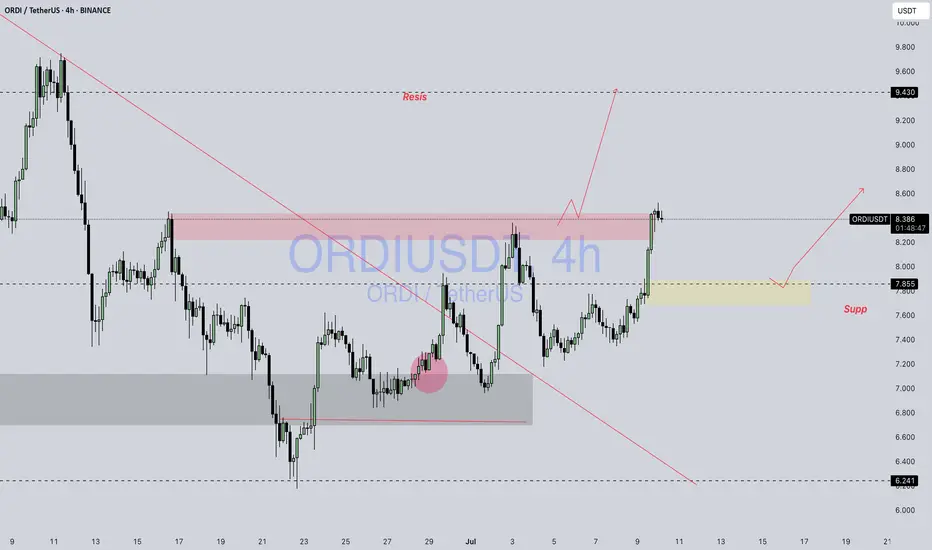
ORDI / USDTBINANCE:ORDIUSDT
### 📊 **Technical**###
* **Current Price:** \~8.377 USDT
* **Chart Type:** Candlestick (4H)
* **Trendline:** A long-term **downtrend line** has been broken, signaling a potential trend reversal or breakout.
---
### 📍 **Key Zones:**
1. **Resistance Zone (Red Box):**
* Located around **8.3 to 8.5** USDT.
* Price is currently testing this zone.
* A clean breakout with volume can send price toward the **next resistance at 9.43** USDT.
2. **Support Zone (Yellow Box):**
* Around **7.85** USDT.
* If price faces rejection from the resistance, it might pull back to this support and bounce from there.
3. **Next Major Resistance:**
* Marked at **9.430** USDT — likely the next target if the breakout sustains.
---
### 🧭 **Scenarios to Watch:**
* ✅ **Bullish Scenario:**
* Break and hold above the red resistance zone.
* Possible continuation toward 9.43 USDT.
* ⚠️ **Bearish Pullback Scenario:**
* Rejection from the red zone.
* Retest of the 7.85 support zone.
* A bounce here could still maintain a bullish structure.
Disclaimer : Not Financial Advice
HBAR / USDTBYBIT:HBARUSDT
### 📉 **HBAR/USDT 4H Chart Analysis**
*(As of 0.15684 USDT)*
---
### 🔼 **Resistance Zones:**
1. **0.158–0.160 (Local Resistance):**
* Multiple rejections in this zone.
* Price currently struggling to break through.
2. **0.17548 (Major Resistance):**
* Strong historical level.
* Acted as a turning point previously.
---
### 🔽 **Support Zones:**
1. **\~0.150 (Local Support):**
* Recent reaction area.
* Price found temporary stability here.
2. **0.14241 (Major Support):**
* Strong reversal zone in previous sessions.
* Significant demand was seen historically.
---
### ⚙️ **Price Behavior:**
* Market is in a **sideways consolidation** phase.
* No breakout or breakdown confirmed.
* Structure is developing between support and resistance boundaries.
---
### 📌 **Key Observations:**
* Lower highs forming near resistance may suggest hesitation.
* Consolidation can often lead to stronger moves once direction is confirmed.
* Watching volume and reaction near key levels is critical.
---
> **Disclaimer:**
> This analysis is for educational and informational purposes only. It is **not financial advice**. Always do your own research (DYOR) and consult a professional before making any trading decisions.

Aurasol/ UsdtWEEX:AURASOLUSDT
AURASOL/USDT is currently trading at **0.10472**, showing a modest gain of **0.44%** on the weekly chart. The price is hovering near a key **resistance level at 0.10501**, which has previously acted as a barrier. If buyers manage to push the price above this level with strong volume, the next major target would be **0.16473**, a significant resistance zone. However, failure to break above **0.10501** could lead to a retest of the immediate **support at 0.10403**, followed by the psychological **0.10000** level. A drop below **0.10000** would signal weakness, potentially driving the price down to the stronger **support at 0.09000**.
The market’s direction will largely depend on whether the price can sustain above the **critical red line support (0.10000)**. Traders should watch for confirmation—either a breakout above **0.10501** with increasing volume or a breakdown below **0.10000**—before taking positions.
As always, proper risk management is essential, and this analysis should be supplemented with your own research.
Disclaimer : Not Financial Advice

Ordi / Usdt BINANCE:ORDIUSDT
**Key Levels**
- **Resistance:** 7.855 (recent high) → 8.500 (next barrier)
- **Support:** 7.090 (today's low) → 6.241 (critical floor)
**Current Action**
- Trading at **7.118** (-1.96%) after testing **7.281** high
- Rejected from **7.281**, now near **7.090 support**
**What to Watch**
- **Bullish Case:** Hold above **7.090**, retest **7.855**
- **Bearish Risk:** Break below **7.090** → Drop to **6.241**
**Trade Setup**
- **Longs:** Only if holds 7.090 + volume (target 7.855)
- **Shorts:** If breaks 7.090 (target 6.500-6.241)
**Volume Alert**
- Weak bids → Risk of deeper correction
*(Not financial advice!)* 🔍

EURJPY: First red day, new monthly cycle!Hello everyone and welcome back to my channel! As always, my analysis are not a financial suggestion, neither a way to predict the market direction.
Predicting and guessing is quite 50/50, my job is hunting the best trade setup for the day, and my analysis are only a tool to identify a great risk reward and to align the setup with the overall thesis.
EURJPY, ended the month of May with an interesting signal, and I'm looking to potentially complete a two week Pump and dump, if it will setup correctly during the upcoming days.
Let's see it in depth, zooming into the previous week!
Monday, opening range of the week, the weekly boundaries are in place, long triggered in the market, starting the day with a pump before Asia session.
Tuesday, initial balance, the market pumped stronger higher, expanding the range, setting the currently weekly high low.
Long traders have been triggered for the second time, and the market closed in breakout. (Other time frames may be driving this move!)
Wednesday, midpoint range of the week, nothing really happened, the market stayed inside, up high into the weekly high, closing the day as an "inside" signal, which typically can be an interesting signal for explosive move.
Thursday, the weekly high has been broken for the third time, long traders are triggered one more time, and eventually (we don't know it certainly), volume can be trapped up high, and the market could shift soon. The breakout of the weekly high, looks like failed and we might start watching for a great reversal.
Friday, last trading day of the week and the month of May, placed a lower low (breaking in structure) and pumped back up inside the daily range, near the Thursday closing price, closing the week as a first red day.
FIRST RED DAY, typical is a reversal signal when it setup properly, but as per my experience and backtest, I don't have many templates where the market fall on Monday. It might happen because it is the first day of the new month and we can see interesting moves, but currently I do not see the setup for today, unless major red news on schedule at 10am NYT might be particularly volatile.
What am I looking for?
In order to validate this signal, I want to partecipate in a pump and dump scenario, setting up during the 3 session Asia, London and NY, not necessarily today, but until the signal will be valid.
Can this market go higher?
Absolutely yes, I repeat, I'm not Nostradamus ahah I do not use technical analysis to forecast, but only to research for the risk reward eventually I will position myself in the market.
I will update this post until FRD signal will be valid!
Gianni

ETHUSD: First red day, day 2 on the backsideHello traders and welcome back on my profile, here is Gianni, and I hope you can enjoy this detailed analysis on ETHUSD.
As always, I don't use technical analysis for market prediction, because predicting is 50/50, but I use it to calculate my risk reward in case I would position myself in the market.
My general thesis for the day is pretty short, and following, the logic behind this thesis.
Monday, opening range of the week, established the current monthly high, breaking into the low of Friday (lower low) at the end of the day. Other time frames/big players might be in play and potentially the week can setup for a pump and dump.
Tuesday performed a strong pumping day, breaking through the Monday high and expanding the range higher, closing as well in breakout long.
Wednesday the market pretty much consolidated for the whole day, coming back inside the opening range high, and closing as first red day.
First red day is only a bearish signal, it doesn't mean that the market will drop certainly, but it gives you a signal the potentially long might be trapped in the wrong direction, increasing the chances of reversal, the day later or few more days later.
Today, Thursday, the market kept breaking lower, and it looks like coiling into the yesterday low of day, definitely a sign of weakness which I will keep in consideration.
8:30am and 8:40am NYT major red news are on schedule, I would not touch this market before that time, avoiding any possibility to be stuck in the trade.
How would I take this trade?
Simply I will be looking for any sell high opportunity after the news, reinforced with bearish price action, as triple tops, double tops and any kind of reversal patterns into the most recent high in place.
What about a long view?
Actually I'm not interested today, it can go higher, it can retest the weekly high, it can consolidate, it can do EVERYTHING, I don't care, my only focus is aligning my bearish thesis with a bearish setup.
I won't take in consideration any long opportunity for the day.
Overall, the market strongly pumped up during the previous week, I do not expect any crazy move, I do not think that this market trapped volume enough for a huge bearish collapse.
The potential opportunity of today, if presented, will be targeting the current weekly low (Monday low).
Stay tuned for further update during the NY session

USDCAD: New month, first green dayHello traders and welcome back to my channel, as always, my analysis are not a way to predict the market, but long and short are just a signal regarding the setup I'm looking for the day.
Guessing the direction is not part of my job, entering setups in line with my thesis, that's my job!
A little consideration before analysing this current week, the previous week, placed the monthly low, and retested it completing a pump and dump template. We are currently into the April monthly low and I'm looking for a long opportunity considering the potential volume trapped down low.
But what happened this week and why I'm bullish?
Monday, is the opening range of the week, weekly boundaries are now in place and short breakout traders are involved in the market.
Tuesday, initial balance, expanded the range lower, triggering again shorts in the market.
Wednesday, midpoint of the week, breakout lower again, stopping the traders long from the April monthly low and closing the day in breakout, going in consolidation into the end of the day. To me, this aspect is pretty important, triggering traders down low, with not really a strong momentum, typically gives me the signal of a potential reversal.
Thursday, pretty much Asia and London session consolidated down low around the closing price, breaking the daily high for the first time during the week (which is to me a break in structure). The day closed as first green day, which is a potential long signal, especially when appears down low.
Today, Friday, last day of the week and first day of the new month, I can see a potential dump and pump setting up for the day, but NFP is on schedule and it can mess up completely the overall setup.
How I'm gonna take this trade?
Well, first of all no action will be taken before news release at 8:30am NYT, after that, if the dump and pump is still intact during NY session, I will be willing to position myself in the market, accordingly with my entry criteria (typically bullish price action coiling for a long move).
Can the market go lower?
Absolutely yes! As I said, I do not predict any direction, but overall today I won't be interested in shorting USDCAD, because typically shoring into the weekly low, is not a very profitable trade opportunity, and I typically don't like to stuck in a trade for ages! :)
I will update anyway the intraday overview during the NY session, starting in a couple of hours!
Gianni

GBPUSD: First red dayHello traders and welcome back on this analysis regarding GBPUSD, as always I never try to predict the direction of the market, long and short are only the setup I'm currently looking for, during the day.
I use technical analysis exclusively to find a proper risk reward for my trades, eventually I position myself in the market.
GBPUSD looks currently pretty interesting to me, and I'm looking to complete a pump and dump template started on Monday.
Just few words about the previous week, the previous Tuesday which placed the weekly high, it's a level which began an interesting bearish move, and currently the market is retesting that level.
The previous Tuesday and Wednesday placed the weekly range, and I'm gonna see how the price will behave on the extreme.
This week, last week of April, I can see on Monday a strong impulsive move, which is our pump for the weekly template, the market triggered long breakout traders and closed as well above the previous week high, other time frames/big players are involved on further movements.
Tuesday, the market stayed pretty much inside, it kinda triggered the daily high, but the most important signal to me, is that it closed as a first red day after a full day of consolidation up high.
Today, a bearish move looks like has already started, but considering still plenty of space down low, I can still be looking for further downward move.
Major red news are on schedule at 10am NYT, so no action will be taken before that time.
However I will be looking for the market to pump up 25/50pip, coiling for an explosive bearish move, targeting the low of Monday (which would eventually complete the weekly pump and dump), and potentially trailing a partial even lower.
I will update this post after the news at 10am NYT
Gianni

GBPUSD: Day 3 breakout traders long in the market!Hello traders and welcome back to my profile, as always don't forget to hit the like button and comment if you enjoy this analysis, and feel free to share your own thoughts!
Trade setup, don't chase movement, neither don't guess what the market is going to do next.
I know it looks like I'm trying to predict a move, but actually I'm just showing what setup I'm looking for in order to partecipate in the market, eventually it's going to move in my direction.
GBPUSD is currently on my watchlist, day 3 long in the market can be a strong signal of reversal (when setup properly) and I can see a potential weekly pump and dump setting up for today (waiting for news to be released), or it can be a move that can be completed on tomorrow, eventually the market will close as first red day at the end of the day.
Let's go a little bit deeper:
Monday, opening range of the week was a strong pumping day, clean, clear, which triggered long breakout traders in the market and closed in breakout above the previous weekly level, other time frame traders are involved and the market may be in play!
Tuesday, initial balance, the market slightly expanded the range higher and the end of the day it closed in breakout triggering breakout long for the second time, decreasing, however, the momentum of this move.
Wednesday, the market stayed inside the previous daily range, barely touching the weekly high and the end of the day, which I consider a day 3 long traders triggered up high.
Now, to me, this scenario look pretty much a 2 days of consolidation up high into the weekly high after Monday pumping day, and I would be interested in shorting a potential dump, targeting the weekly low.
Thesis:
- Short, is my main thesis, going to complete the weekly pump and dump, it can setup today or tomorrow, and what I will be looking for is an intraday pump and dump blowing off during NY session.
- Long, not really interested today, but however, I cannot know if the market will proceed to go higher, because overall, we can see a strong bullish trend from January 2025 and I wouldn't expect the market dropping down till that level where such a huge move started.
Follow me to get update about this market!
Gianni

Ripple (XRP)Xrp usdt Daily analysis
Time frame daily
Risk rewards ratio >1.5
Short position ↘️↘️
Bad news for Ripple investors
Head and shoulders pattern is created
So I think , maybe xrp fall down to 1.7$

GOLD: First Red DayHello traders and welcome back to my channel, as always, don't forget to leave me a like and a comment to support my work, I don't share too much because I constantly try to select best market's template with a great potential of success.
I strongly believe in quality above quantity!
If you have been following me since a while, you should remember that any of my analysis are not a forecast, I'm not interested in understanding and/or predicting what the market is going to do. Why?
Because guessing is literally 50/50 and is not part of my job.
Now, let's talk about GOLD.
I really like the current template and how the new month started, and to me, we can have a great opportunity to see a weekly pump and dump scenario setting up today with NFP or keep moving some more day into the new week.
To understand better the logic behind, let's analyse the market more deeply.
I didn't show in this chart the previous week, but you can have easily a look by yourself and you will realise that it started breaking down in a full week of down move, main reason today I would like to be looking for a short setup (if a short setup will be identified)
Monday, opening range of the week and the month, it was a clear pumping day, triggering long traders in the market and closing out of balance. The market now may be in place and other time frames are potentially involved in the market.
Tuesday, GOLD proceeded pumping higher, especially during the London session, triggering for the second time long traders in the market, and again closing out of balance.
Wednesday it kinda tap the weekly high, but most of all I can see the market consolidating. To me, it's a first sign of potential volume trap up high.
Thursday, the previous daily low was triggered, stopping eventually traders long from Wednesday, which they were trying to keep buying up high, and closing the day as a first red day, which potential can be a sell signal.
Today, Friday, the market is still inside the consolidation, and NFP can be very interesting in terms of completing this pattern, and I will be willing to take a sell high opportunity after the news.
Thesis:
- My main thesis is currently short, is a common weekly template of pump and dump if setup correctly
But obviously, I'm not here trying to predict, this is only the setup I'm looking for.
Yes, the market can keep going higher, in fact, I cannot exclude a scenario of breakout, pullback, continuation, on top of Monday high, which is the opening range of the week.
How do I know which direction is the market taking?
I don't know, until I will see a setup, either a pump and dump (and I will be lookingto short the dump and the weakness of the market).
Either if I can see a dump and pump, I would be willing to buy the strength on the frontside of the pump during NY session.
For better undressing, I will be sharing the intraday perspective during the NY session.
Gianni

EURUSD Weekly Reversal DUMPEURUSD potential pullback or complete dump to erase the week move.
Continuously decreasing Cumm.Delta
Divergent LL from high of day into LO Open
Imbalances on the Volume Profile leaving liquidity
Continuous trap candle formations
Bearish VWAP Break (Intraday)
Targeting the volume imbalance or completion of the retail breakout

BTCUSD PUMP & DUMPAnother classic pump and dump setup to line us up with some pips off BITSTAMP:BTCUSD
Biggest tell was the current COT report and the broken fractional disparity when EURUSD BTCUSD and DXY all had bullish liquidity grabs.
Looking to sail with the sharks to the previous zone flip or the imbalance zone which also lines up with equilibrium and a large fair value.
Using VWAP to invalidate the trade.

EURUSD DUMP Easily anticipating a lock for high of week. If not, I will cove to .055
Rapid 1.2.3 (i) (ii) (iii) on Monday's open running straight to previous week highs before bearish ChoCh, BOS and change in market structure.
LO premarket move anticipating to control risk with SL to BE targeting equilibrium or 50% retracement to open the week
***Unfortunately price is currently trading above VWAP. A strong high volume move across is required to validate the move***
-YungEmsi

Bearish Dump Continuation: TRUMPUSDTContext: We're more than half way through a dump on TRUMPUSDT
-Pullback into the zone after heavy bearish shift on Friday.
-Imbalance on the market profile
-61.8 Retest to the imbalance zone
-A miro-structure 61.8 retracement to the POC and VWAP (Intraday)
-Larger imbalance gaps awaiting below $10
