EURUSD: DAY 3 SHORTS in the marketHi everyone and welcome to my channel, please don’t forget to support all my work subscribing and liking my post, and for any question leave me a comment, I will be more than happy to help you!
“Trade setups, not movements”
Let’s jump into the Technical Analysis:
WEEKLY TEMPLATE (1hr chart):
Since Monday this market has been trending down, triggering shorts breakout traders in the market for three days in a row, potential signal of reverse considering the price at the low of the week
DAILY TEMPLATE (15min chart):
Price after asian session printed high low of the day, it pinned down into the LOW and pumped up.
THESIS :
Major red news on calendar, no trade before 9:45am NYT
Long: considering 3 days of order flow trapped lower and lower, money and stops are placed above the HOW, this could complete a weekly dump and pump template by tomorrow.
Short: I can't exclude that this market is still breaking down and keep going lower considering, however, the market still in the backside of the move.
SETUP :
Long: dump into the previous closing price (CP), consolidation for 30/45 min and pump back to the HOW, or eventually first bar entry after news release If a green strong momentum bar is presented with news.
Short: Pump into Monday low (opening range), or previous HOD, consolidation for a dump back into the current LOD/LOW.
If none of this scenario will present, I wouldn't consider any other trade setup variations.
Please note that the purpose of my analysis is to help me and you hunting the best trade setup for the day, none of my technical aspects are a way to forecast any directional market movement.
Gianni
Pumpanddump

MBIO could something big be about to happen?The pump and dump groups are done??
Heavily shorted ATM.
Time to rise from the ashes I believe.
This is a long term play for me.
LOOKS LIKE A FINISHED WOLFE WAVE IF YOU INVERT IT!!
NOT FINANCIAL ADVICE!!

Dogecoin - Is a 20.000% rally realistic?Hello Traders and Investors, today I will take a look at Dogecoin .
--------
Explanation of my video analysis:
In 2020 Dogecoin already created a symmetrical triangle breakout which was followed by a +20.000% rally towards the upside. Then we saw the top in 2021 and Dogecoin once again entered into a triangle consolidation phase. We already saw the bullish breakout of this triangle and if we measure the potential price target, the next bullrun could bring us all the way up to $20.
--------
Keep your long term vision,
Philip (BasicTrading)

OIL: Monday closed as First Red Day Hi everyone and welcome to my channel, please don’t forget to support all my work subscribing and liking my post, and for any question leave me a comment, I will be more than happy to help you!
“Trade setups, not movements”
Let’s jump into the Technical Analysis:
WEEKLY TEMPLATE (1hr chart):
Yesterday, Monday, the market broke through the previous HOW and failed, closing the day as a first red day. Since the last Wednesday the market pumped up and now look like starting the backside move of a big template of pump and dump
DAILY TEMPLATE (15min chart):
Asia and London session mostly dumped all the day, breaking the current low of the week
THESIS :
In the short scenario this market can go fo a range expansion, targeting the previous LOW, it would be my main trading opportunity.
In the long scenario, considering money on top at the HOW, I would be targeting the yesterday CP(HOD) or current HOW if strong momentum is presented.
SETUP :
Short: pump at least into previous LOD(LOW)
Long: Low in place, consolidation for 30/45 min and second/third hour NY session reversal
Please note that the purpose of my analysis is to help me and you hunting the best trade setup for the day, none of my technical aspects are a way to forecast any directional market movement.
Gianni

Ethereum - 20% Rally within a day!Hello Traders and Investors, today I will take a look at Ethereum .
--------
Explanation of my video analysis:
6 years ago, Ethereum started creating a simple rising channel formation, similar to the one which we are seeing on Bitcoin. Furthermore Ethereum retested the previous all time high back in 2022, created bullish confirmation and a rally of + 250%. Considering that Ethereum is once again approaching the upper resistance level, I do eventually expect a bullish breakout followed by an even crazier rally.
--------
Keep your long term vision,
Philip (BasicTrading)

The Boulevard of Broken Dreams. Pump and Dump Part IIRecently we watched in the news the resurrection of the "Meme Stocks" frenzy and the "Roaring Kitty" username. Those who witnessed the first surge in stocks like NYSE:AMC , NYSE:GME , NYSE:BB , etc., remember those were basically a "Make me Rich quick" kind of event, they were known as "Meme Stocks" because it all started as memes by a group of traders in internet forums who allegedly went against the Wall St. Hedge Funds who were heavily invested in shorting these stocks, by buying all at the same time and triggering a strong short squeeze.
Well, this event was the hope for this group of traders who saw the opportunity to pocket huge profits in a short time frame, and it gave them the sense of power against Wall St. That time these stocks were heavily shortened, and they were prone to an aggressive short squeeze, not only from these member of the meme stock traders, but by professional traders.
At the end of the day this group of stocks spiked, the people took profits, they left the market, some richer, some poorer, and others as bag holders. All these stocks faded along the time and some even went bankrupt. This event was imprinted in the memory of those hoping that this could happen again, but most amateur traders don't take the time to actually learn to trade, they ran with the rumor again after a fuzzy post by the "Roaring Kitty" and they just grabbed whatever was being mentioned in the forums. This time however it was very different. Their behavior was predictable and the professional traders already had a plan in advance, to short the spike. The small buying power of the meme stock traders plus their inexperience in swimming with professional sharks just turned them into an easy morning lunch. The rumor, action and shorting cycle was very fast. In the chart we can see outstanding profits in the order of hundreds of percentual points. But if we take a look at the short sale volume, we notice that the spike was immediately extinguished.
The #VolumeCandles feature of Trading View is an excellent tool to visually pinpoint the development of this pump and dump event. In the chart I added some more stocks which were rumored in the forums, NYSE:GME , NYSE:AMC , NASDAQ:KOSS , NYSE:OKLO , NASDAQ:FFIE , NASDAQ:GWAV , $CRKN. The symbols used to display the short volume were:
FINRA:GME_SHORT_VOLUME
FINRA:AMC_SHORT_VOLUME
FINRA:KOSS_SHORT_VOLUME
FINRA:OKLO_SHORT_VOLUME
FINRA:FFIE_SHORT_VOLUME
FINRA:GWAV_SHORT_VOLUME
FINRA:CRKN_SHORT_VOLUME
All of them have the same pattern,
Rumor in the meme stock forums
Frenzy buying
Immediate huge short volume
The takeaway of this presentation is, never fall for what others "rumor" in forums, trade following your own system, your money and your profit/loses are just yours, so the responsibility to plan your trade.
Buying and selling shares in the stock market is very easy, trading is not, and they're definitely not the same. #LearnToEarn.

USDJPY: Day 3 breakout traders triggered in the marketHi everyone and welcome to my channel, please don’t forget to support all my work subscribing and liking my post, and for any question leave me a comment, I will be more than happy to help you!
“Trade setups, not movements”
Let’s jump into the Technical Analysis:
WEEKLY TEMPLATE (1hr chart):
Market currently rising up on the backside move, potentially going to complete the big template of dump and pump started the last Wednesday.
Day 3 breakout long traders triggered in the market, closing yesterday out of balance.
DAILY TEMPLATE (15min chart):
After Asian pushed higher, breaking out the current HOW, the market dumped down and currently in consolidation around closing price/previous HOD.
CPI on calendar for 8:30am NTY, things can drastically change with this high impact news release.
THESIS :
This market placing higher highs it may be preparing for a major move, stopping short traders from previous HOW.
SETUP :
Long (primary): market already broke higher and dumped into previous level of interest, if it keep consolidating till news release, I will be happy to long (first bar after the news or first bounce if identified)
Short: no LOD triggered, if market pumped up into HOW, it could give a scalp short, not really in my interest of the day.
Please note that the purpose of my analysis is to help me and you hunting the best trade setup for the day, none of my technical aspects are a way to forecast any directional market movement.
Gianni

S&P500: First Red Day, FRIDAY DAY 3Hi everyone and welcome to my channel, please don’t forget to support all my work subscribing and liking my post, and for any question leave me a comment, I will be more than happy to help you!
“Trade setups, not movements”
Let’s jump into the Technical Analysis:
WEEKLY TEMPLATE (1hr chart):
Tuesday, Wednesday and Thursday the market bring traders up high, triggering long breakout for three days is a row, breaking higher and failing the weekly level on Thursday, day which closed as well as a first red day.
DAILY TEMPLATE (15min chart):
The market today slightly trigger other time frames in the market, consolidating both the session of Asia and London above CP and previous LOD.
THESIS :
Wait for equity NYO at 9:30, possibility to the big pump and dump to be completed by the next few days if the backside move will start.
Trader in profit also above HOW, I will not exclude scalp long if a setup is presented
SETUP :
Short: LL LOD, pump and dump into yesterday LOD
Long: dump into CP/LOD for a pump back to previous HOD
HERE BELOW, SIMILAR TEMPLATE FOR THE DAY"
NAS100
US2000
US30
Please note that the purpose of my analysis is to help me and you hunting the best trade setup for the day, none of my technical aspects are a way to forecast any directional market movement.
Gianni

EURUSD: Dropping in the backside move, First Red DayHi everyone and welcome to my channel, please don’t forget to support all my work subscribing and liking my post, and for any question leave me a comment, I will be more than happy to help you!
“Trade setups, not movements”
Let’s jump into the Technical Analysis:
WEEKLY TEMPLATE (1hr chart):
Monday to Wednesday the market has been pumping on the frontside, triggering breakout long traders for three days in a row.
Thursday, the market pushed higher and failed the weekly breakout, closing as well as a first red day.
DAILY TEMPLATE (15min chart):
The market today triggered other time frames short in the market, currently out of balance.
THESIS :
This is a typical scenario of weekly template pump and dump, however no major red news on the calendar, so I won't expected such a big short move today.
Long traders are in huge profit, majority of the stops are below the LOW.
SETUP :
Short: Pump into previous LOD/CP and dump with size
Long: not interested
SIMILAR TEMPLATE FOR THE DAY:
GBPUSD
GOLD
However, both of them are still inside the previous high low range, at the moment the best template is EURUSD
Please note that the purpose of my analysis is to help me and you hunting the best trade setup for the day, none of my technical aspects are a way to forecast any directional market movement.
Gianni

Chronicle of a Foretold Pump/DumpPump/Dump schema:
Discrete Share accumulation.
Broadcasted Triggering Event (news, rumors, forums, etc).
Gather the mass of "Bagholders".
Dump all the load.
Pocket the quick profit.
I am not a fan of " meme stocks " because they're very much like penny stocks, prone to pump/dump schemes. How legal or illegal is this practice?, it is not us to decide, there are authorities who are supposed to regulate these behaviors.
Regardless of the morality of a it we can analyze the radiography of the move. Using the volume bars feature, you can see "big fat" candles on the accumulation phase, the "rumor" phase where the "roaring kitty" name was heard in the news, the spike and immediately took the stock to a quick profit of +120% overnight, and the fade phase, where the only thing that remained at the end was the frozen smile of the hopeful bagholders with a fading volume.
#LearnToEarn.
Be careful where you put your money, trading and investing requires knowledge of the company, its balance sheet, fundamentals and/or technical metrics. Don't follow the crowd, else you'll end up in the slaughter house. There's no free lunch in Wall St.
Let's remember this quote: "The game of speculation is the most uniformly fascinating game in the world. But it is not a game for the stupid, the mentally lazy, the person of inferior emotional balance, or the get-rich-quick adventurer. They will die poor." Jesse Livermore.

VrasityVra usdt analysis
Time frame daily
Red line is our strong protection line
Two bottom pattern
Risk rewards ratio >7 👈👈👈

US30: Day 3, coiling underneath yesterday HODHi everyone and welcome to my channel, please don’t forget to support all my work subscribing and liking my post, and for any question leave me a comment, I will be more than happy to help you!
“Trade setups, not movements”
Let’s jump into the Technical Analysis:
WEEKLY TEMPLATE (1hr chart):
Monday day 1 broke higher the previous HOW, failing the breakout, dumping down and closing as a first red red day.
Tuesday day 2, the market consolidated almost all the day at the current LOW placed by the Monday high low, performing a nice pump at the end of the day.
Today Wednesday day 3, the market is in consolidation above the yesterday closing price and previous HOD, a particular situation that often lead to an explosive move. However, indexes open at 9:30 NYT and CPI red news on calendar at 8:30am.
DAILY TEMPLATE (15min chart):
Both Asia and London session consolidated between the CP and HOD, nothing really happened yet.
THESIS :
As always, I do not predict any market direction, because predicting/guessing is just a 50:50 method. However, for a long thesis I would target the previous HOW considering the 3 days dump and pump scenario, but I wouldn't exclude a bigger short scenario back at least to the LOW or breakout traders of Thursday.
SETUP :
Long: consolidation at CP till news release or NYO 9:30am
Short: lower low in place, pump into CP for a dump, eventually also pump into previous HOD for a short setup.
Please note that the purpose of my analysis is to help me and you hunting the best trade setup for the day, none of my technical aspects are a way to forecast any directional market movement.
Gianni

GBPUSD: Coiling for a potential major moveHi everyone and welcome to my channel, please don’t forget to support all my work subscribing and liking my post, and for any question leave me a comment, I will be more than happy to help you!
“Trade setups, not movements”
Let’s jump into the Technical Analysis:
WEEKLY TEMPLATE (1hr chart):
Since the beginning of the previous, the market dumped down for three days, failing a low of week level on Thursday, confirming the failed breakout during the day itself, triggering long traders breakout and closing the day out of balance.
Friday the market mostly consolidated, not big move happened and today, Monday and opening range of the week, I can see an interesting coiling above the Friday closing price.
We are on the backside of the movement, a long view could be a really lucrative opportunity.
DAILY TEMPLATE (15min chart):
In the day itself, the market did not move much, but it triggered the previous HOD, other time frames are in the market.
THESIS :
Accordingly with my backtest and experience, this market can setup for a long trade back to the previous HOW (money are there and short traders are still in profit).
However, in the scenario of a short setup, it could be a little scalp.
Major red news on calendar tomorrow, no big move expected today!
SETUP :
Dump and pump at least above previous HOD or CP (closing price)
Please note that the purpose of my analysis is to help me and you hunting the best trade setup for the day, none of my technical aspects are a way to forecast any directional market movement.
Gianni

DIPS ARE FOR BUYING ! Don't get SCAREDBitcoin (BTC) has been trading within a horizontal accumulation pattern on the 4-hour timeframe. This pattern is characterized by a period of price consolidation within a defined range, with multiple attempts to break out to the upside or downside but ultimately failing and returning within the range. This price action often indicates that there is significant liquidity built up on both sides of the range, waiting for a catalyst to break the pattern.
Significant Liquidity Above and Below the Range:
BTC has formed significant liquidity levels above and below the horizontal accumulation range. These liquidity levels represent areas where a large number of buy or sell orders are clustered. The supply of these orders at specific price points can act as support or resistance, influencing price movements.
Large Imbalance Below the Range:
On the 4-hour timeframe, BTC also exhibits a significant imbalance between $51,000 and $59,000. This imbalance suggests that there is a larger amount of sell orders than buy orders within this range. Imbalances can sometimes act as magnets, pulling the price towards them to fill the excess orders.
Potential Breakout Scenario:
Based on the horizontal accumulation pattern, liquidity levels, and imbalance, I anticipate a potential bullish breakout for BTC. Two possible scenarios could play out:
1. Retest of 0.5 Fibonacci Retracement:
The price could retest the 0.5 Fibonacci retracement level of the imbalance, around $55,000. This retest could serve to shake out weak hands and further accumulate liquidity before a breakout.
2. Sweep of $59,000 Level and Breakout:
In a more bullish scenario, the price could sweep through the $59,000 liquidity level, indicating strong buying pressure and potentially leading to a breakout towards $77,000, the next major resistance level.
Overall Outlook:
BTC's price action suggests a potential breakout from the horizontal accumulation pattern. The presence of significant liquidity levels and an imbalance below the range further supports this possibility. While a retest of the 0.5 Fibonacci retracement level is possible, an ideal scenario would be a sweep of the $59,000 level and a continuation of the uptrend towards $77,000.

GCTK jumps on new glucose monitor application SHORTGCTK is an unshortable penny med tech stock. It is now overextended and fundamentals do not
support a move higher. Idea is on the chart. Overbought at this point and likely to fall by Friday
as traders take profits for the week.


Nkn usdtNkn usdt analysis
Time frame daily
Risk rewards ratio >3.5
Support Green up trend
First Target 0.23$

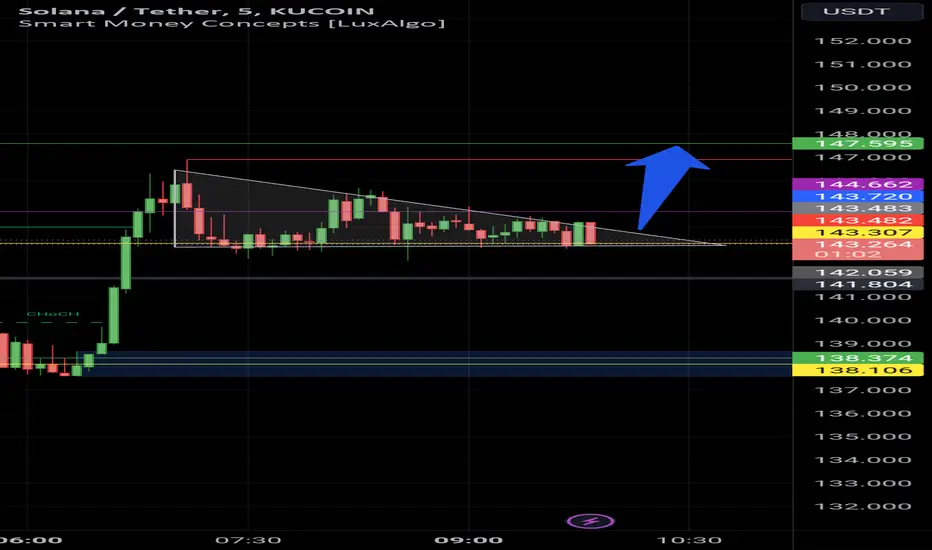
Solana analysis. Flag pattern You can see flag pattern in 5m time frame Solana usdt
147$ is first target
Silver is looking like danger!!I assume we will see an overthrow of the highs in a scam wick to close the shorts and then the fall will start.
Everyone thinks we are in risk on??? Have you seen the volume profiles in the legs down?
I have remover 80% of my money from the exchanges.
I sold my paper silver.
Any ideas on rotations???
NOT FINANCIAL ADVICE!!!!!

SLV to dump???I sold today. I believe this is about to get a beat down.
I did not and won't be selling my physical.
Down to $12 and up to $48???
NOT FINANCIAL ADVICE!!!

BTC starting the wave C down. TRAPThey are feathering the wave B on you now IMO. Make sure you have your stops close. Better to take small wins and no losses.
I was all in last night and pulled out before Easter service today for more than +1% of my entire accounts. Happy Easter folks!!
I believe we should take the low and bounce at 46 - 58k before we take the highs.
Diamond patterns on average move 19%.
I believe they are exhausting the buyers at the moment and planning an huge dump. Possibly the restart type. Governments don't want crypto, you do and 80+% must take the L in this game. PLAY SAFE!!
NOT FINANCIAL ADVICE!!!!!

VINC a speculative biotech penny stock LONGVINC went from 1.5 to 3.0 in less than three hours with 12X relative volume in the afternoon
after a month of a slow climb from a news release that really did not amount to much. Insiders
are 25% of the shareholders and that may be the story here. This could be manipulation at its
finest. I have to wonder how many insiders bought how many shares and when the rug pull.
This is a high tight bull flag pattern which typically results in another leg higher of the same
magnitude. I suppose that is in clean trading without any manipulation.
If this takes off again it might be worth trying with a small position so long as the trader
can hit a button to close the full position when the sudden reversal occurs. I will trade
this long with a group of moving averages to make alerts for crossing lines and slopes
levelling out and see if it can go anywhere.

Who still has money in this game?CASHED OUT!!!
I will probably return to the oilfield before returning my money to this.
Will the DXY pump?
Do you have land and water in a place where few live?
Benner cycle much? I believe he was off only due to our gov stimm and cooked books.
Be safe my friends.
NOT FINANCIAL ADVICE!!!
