PUMPUSDT at a Decisive Turning Point – Breakout or Breakdown?
🧠 Technical Overview:
PUMPUSDT has been in a sustained downtrend over the past several days, forming a clearly defined descending trendline that has acted as a dynamic resistance since mid-July. Now, the price is approaching this key level once again—and this time, momentum seems to be shifting.
Interestingly, the current structure is forming what appears to be a potential Inverse Head and Shoulders (IH&S) pattern, a well-known bullish reversal formation. If confirmed with a breakout above the neckline/trendline, this could spark a strong upward reversal.
---
📌 Key Technical Highlights:
Descending Resistance Line: Holding since July 15, acting as the primary ceiling on price action.
Inverse Head and Shoulders Pattern: Potential bullish reversal setup forming on the 2H chart.
Volume: Currently low but showing signs of increase near the potential breakout zone—a bullish early signal.
---
📈 Bullish Scenario (Breakout Confirmation):
If the price successfully breaks and closes above the yellow trendline, especially with a strong candle and volume confirmation, we could see a momentum-driven rally toward the following targets:
1. ✅ $0.003614 – Minor resistance zone
2. ✅ $0.003917 – Retest of previous consolidation structure
3. ✅ $0.004441 – Measured move target from IH&S pattern
4. ✅ $0.005251 – 0.618 Fibonacci retracement area
5. ✅ $0.006795 – Major swing high and liquidity zone
> Potential upside of 100%+ from current levels if momentum continues.
---
📉 Bearish Scenario (Trendline Rejection):
If the price fails to break above the trendline and faces another strong rejection, then sellers could regain control, leading to:
⛔ $0.002500 – Psychological support and consolidation base
⛔ $0.001950 – Local bottom and potential long-term entry zone
> A failed breakout could trigger a quick sell-off or stop-loss cascade below the IH&S setup.
---
🔍 Technical Summary:
Indicator Status
Descending Trendline Actively being tested
Volume Increasing near breakout zone
RSI Rising from oversold territory
Price Pattern Inverse Head & Shoulders (Potential Reversal)
Risk/Reward High, favoring breakout strategy
---
🧭 Strategy Suggestions:
Aggressive Entry: Enter on breakout candle close above trendline with volume confirmation.
Conservative Entry: Wait for breakout + successful retest of the trendline before entering.
Stop Loss: Below neckline or recent swing low (~$0.0025).
Take-Profit Zones: $0.0039, $0.0044, $0.0052 and beyond.
---
🧠 Final Thoughts:
> “Charts never lie—PUMPUSDT is building pressure beneath a key resistance. If it breaks, the move could be explosive. Are you ready to ride the wave?”
Microcap altcoins often fly under the radar—until they don’t. This setup is showing the classic signs of a potential breakout. Use sound risk management and watch the next candle closely.
#PUMPUSDT #CryptoBreakout #InverseHeadAndShoulders #TechnicalAnalysis #AltcoinSetup #PumpFun #BreakoutAlert #MicrocapGems #CryptoReversal #ChartPatterns #CryptoSignal #CryptoStrategy
Pumpcoin

Pump.fun (PUMP) Price Crashes 20% After First Bearish CrossoverMEXC:PUMPUSDT price is currently at $0.003055, down by nearly 20% in the last 24 hours . The MACD (Moving Average Convergence Divergence) indicator, a key tool used to track price momentum, has signaled the first bearish crossover for PUMP token since its launch.
The bearish crossover occurred after a period of rising bullish momentum, signaling that the altcoin may now be facing a downturn.
The token is holding above a key support level of $0.002921 , but this support is fragile. If MEXC:PUMPUSDT fails to maintain this level, it could continue to decline, potentially dropping to $0.002499 . This would confirm the continuation of the downtrend, and the price could fall further.
On the other hand, if MEXC:PUMPUSDT manages to hold its ground at $0.002921, it could experience a bounce back. This would allow the altcoin to rise towards $0.003803, potentially invalidating the current bearish thesis and pushing the price past the resistance of $0.004124 . The next few days will be critical in determining if PUMP can recover from its recent losses.

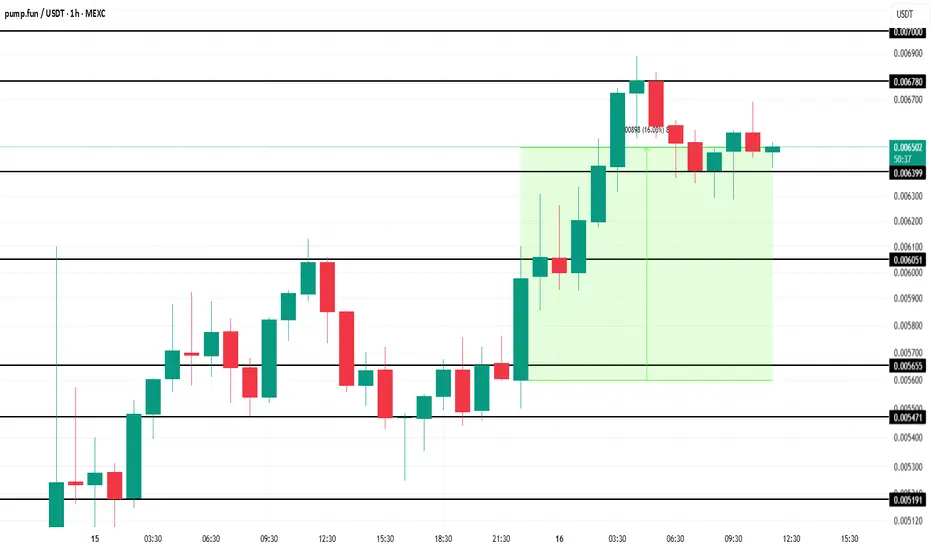
Pump.Fun (PUMP) Token Nears Milestone $1 Billion OI In 3 DaysMEXC:PUMPUSDT price stands at $0.0065 after bouncing off the $0.0063 support level. The token has gained 16% in the last 12 hours , showing that the demand for PUMP is strong.
The valuation of Pump.Fun has skyrocketed in just two days, reflecting a surge in demand. In only 48 hours since its launch, the altcoin has amassed 45,500 holders .
The macro momentum behind Pump.Fun is undeniable, with open interest in MEXC:PUMPUSDT nearing $913 million. It is on track to hit the $1 billion mark by day three of its launch.
Given the ongoing momentum and investor confidence, the token is likely to continue pushing upwards in the near future.
With the current market conditions and growing support, MEXC:PUMPUSDT could breach the $0.0067 resistance and reach as high as $0.0070 in the coming days. This would mark a significant achievement for the altcoin, continuing its impressive upward trajectory.
However, if MEXC:PUMPUSDT faces a sudden wave of selling or broader market bearishness, the token could lose the $0.0063 support level. A decline below this point would likely see PUMP slipping to $0.0060, invalidating the bullish outlook and signaling a potential market correction.
Chz usdtChz usdt lot of positives news came but still no big movement in prize. So soon it will gives good return.
😎

Cake right now is close to opportunity zone!Hello guys 😃
Before we start to discuss, I would be glad if you share your opinion on this post's comment section and hit the like button if you enjoyed it!
it's simple as drinking water! do not miss the chance, if the price hits 9$ zone(every time the price came near to this zone after a short time this coin pumped) do not hesitate and buy one step!
The mid-term target is MA200 for me.
Note: right now in the BSC chain, Cake has the most TVL! and it's $5.5b also mcap/tvl ratio is 0.5119.these parameters can show us investing in Cake has less risk than other coins for now!
Hope you enjoyed my analysis, You can support me with your likes and comments! (always open to hearing points from the others)
Attention: this isn't financial advice I'm just trying to share my vision and remember we must always see what's up with BTC after that go buy altcoins. never forget investment principles and do your research before investing.

BTC 4 TH WAVE ENDED, BUY ON DIPSRevised analysys (always good in TA) some times gives good counts
Hope the triple zigzag combo WXYXZ completed @ 29296 will be the end of 4 th wave (sharp and swift always)
The emerging wave resembles like WAVE 'B' is crossed more than 50% of 4th wave fall which is a bullish confirmation signal
support @ bullish trend line is a good sign of buy
Correction in stock markets ,cooling oil prices will pump this crypto to previous highs(65000) Before sep'21
So we are in 5th wave
Enjoy BULLS!!

YFII WILL PUMP AT LEAST X4. HURRY UP AND BUY IT RIGHT NOW. See the chart and go to Binance too and see the order book. There is an order with +$170k on 1500 YFII price.
HURRY UP, BUT IT.

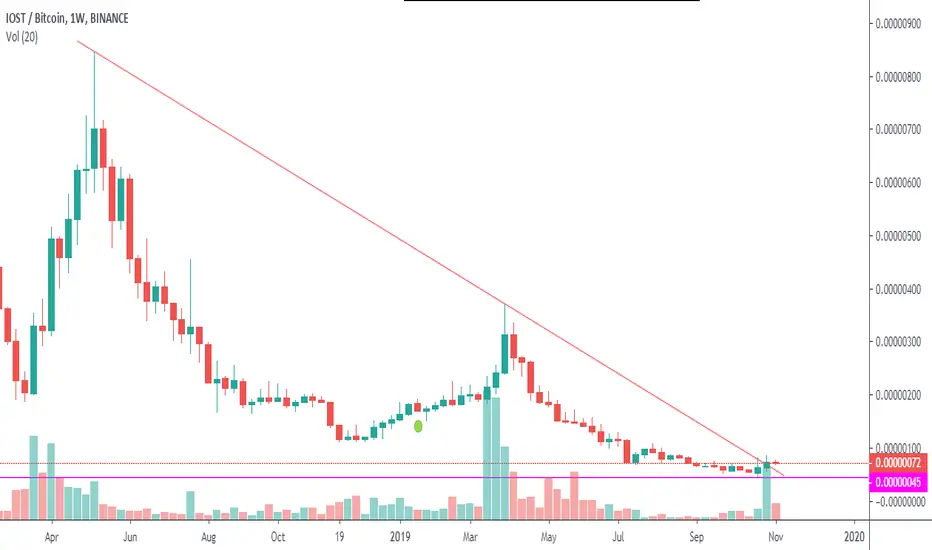
IOSTBTC Weekly Breakout | Extremely Bullish Coinweekly and appeared volume is also very nice
Buy : 67 - 71
target : 5% to 40%
stop : 60

NASBTC LOOK REALLY GOOD VERY SHORT TERM TRADE#NASBTC looks really good and the triangle formation is beautiful.
buy at Current price for early entry or buy below 1400 i expect that it can drop 1 to 1.5 %
sl 3%
target : 5% , 10 % , open
Join my channel @iamcryptoman

BRDBTC | very good Triangle format#BRDBTC
coin looks very good on daily time frame.
buy : 5300 - 5450 ( buy 10% of amount or wait for btc move to buy below 5400 )
sl : 4%
target : 5% , 10% , 15 % ( short term )
join here telegram channel
