Pundix

PUNDI X - TIME TO TRY IT AGAINPUNDI X is starting to look great again. There is a noticable green volume.
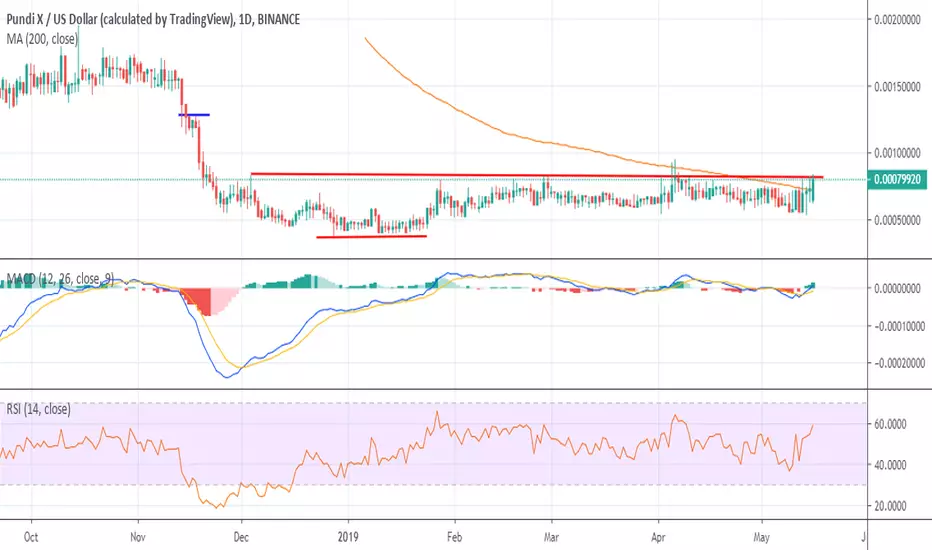
RSI is turning out to the bulls side. I think this could be that moment we are going to break the f. daily MA200 finally.
The fundament around this project is great and positive and community is huge.
Go ahead PUNDI X. This is your time!

NPXS TargetNPXS
Several bullish divs showing up here, I think we could see a bounce to R1. If I were looking to enter, I'd try to snipe one at/near the yearly low.

Pundi X Price Analysis NPXS / USD: Uptown BreakoutPundi X / USD Short-term price analysis
Pundi X has a bullish short-term trading outlook, with the cryptocurrency trading well above its 200-period moving average on the four-hour time frame.
The four-hour time frame continues to show a head and shoulders pattern, with NPXS / USD bulls now attempting to invalidate the bearish pattern.
Technical indicators across the four-hour time frame are bullish and show scope for further upside.
Pattern Watch
Traders should note that the NPXS / USD pair will need to rally to a new 2019 trading high in order to invalidate the head and shoulders pattern on the four-hour time frame.
Relative Strength Index
The RSI indicator is turning higher on the four-hour time frame and shows scope for further upside.
MACD Indicator
The MACD indicator is bullish on four-hour time frame, although the MACD histogram is currently lagging behind the recent up move in the NPXS / USD pair.
Pundi X / USD Medium-term price analysis
Pundi X has an increasingly bullish medium-term outlook, with the cryptocurrency attempting to break above its key 200-day moving average.
The daily time frame is showing that the NPXS / USD pair is trading towards the neckline of a large inverted head and shoulders pattern with a sizeable upside projection.
Technical indicators on the daily time frame are bullish and show scope for further upside.
NPXS / USD Daily Chart by TradingView
Pattern Watch
Traders should note that the November 13th, 2018 swing high is the initial target of the large inverted head and shoulders on the daily time frame.
Relative Strength Index
The RSI indicator has turned bullish on the daily time frame and shows scope for further upside.
MACD Indicator
The MACD indicator on the daily time frame is bullish, with both the MACD signal line and histogram issuing buy signals.
Conclusion
Pundi X is once again threatening a major technical breakout, with the short-term bulls now needing to invalidate the bearish pattern on the four-hour time frame.
If buyers can finally ignite the large bullish pattern on the daily time frame, the NPXS / USD pair could move into a new bullish phase over the medium-term horizon.
PundiX/Bitcoin (14 May) #NPXS $NPXS #BTC $BTCNPXS has dropped a lot from the peak of 22sts and now only 8-9sts. However, NPXS will continue to decrease to 7sts. But here it will be very diffitcult to buy so I recommend ordering at 7sts and 8sts
NPXS after hitting 7sts (or maybe the worst case is 6sts, but I think it's good to buy at 7-8sts), it will increase in a few days. Target should be 14-17sts
Stoploss if price is lower than 6sts

NPXSBTCNPXS on the daily chart
* Currently in the buy zone
* Bullish divergence in OBV, Histogram and Willy
* Nice double bottom
* VPVR looks nice and full
I will be risking to the low. NPXS has some really good fundamentals coming out soon.
* Don't forget to hit that like button and follow me on Trading View and Twitter for more chart analysis :)

566% upside potential gain on NPXS!Stop loss at 0 sats and target at the 3 day order block will give you a nice a nice 5.6r trade/ 566% on PundiX
its
a
joke

Daily Bullish Signal $NPXS #NPXS #NPXSBTC #BTC $BTC (07 April)RED ARROW indicates the EXPECTED Time and Targets
Level Stoploss point up to maximize profit and reduce risk
I'm working all the time, even in Bearish Market


There is a possibility for the beginning of an uptrend in NPXETHTechnical analysis:
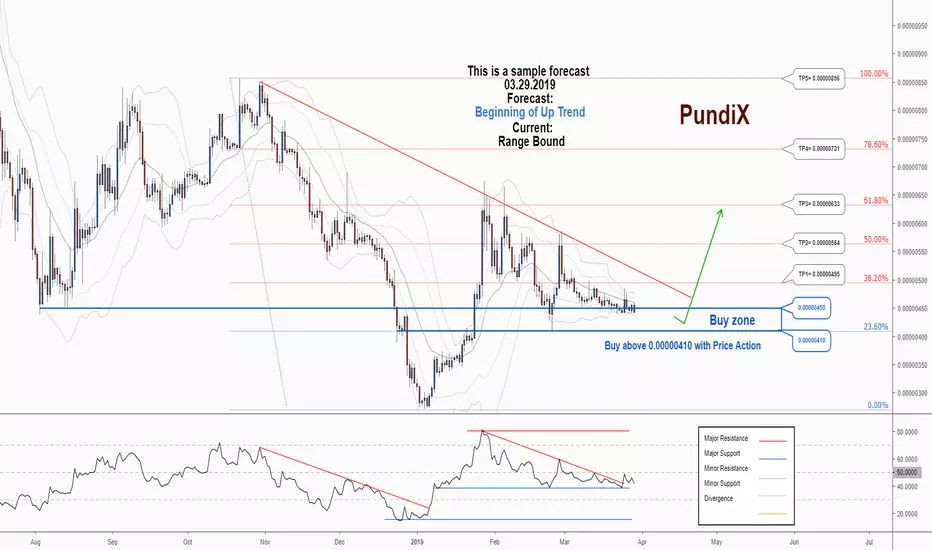
. PUNDIX/ETHEREUM is in a range bound and the beginning of uptrend is expected.
. The price is below the 21-Day WEMA which acts as a dynamic resistance.
. The RSI is at 43.
. While the price downtrend in the daily chart are not broken, bearish wave in price would continue.
Trading suggestion:
. There is a possibility of temporary retracement to suggested support zone (0.00000450 to 0.00000410). if so, traders can set orders based on Price Action and expect to reach short-term targets.
Beginning of entry zone (0.00000450)
Ending of entry zone (0.00000410)
Entry signal:
Signal to enter the market occurs when the price comes to "Buy zone" then forms one of the reversal patterns, whether "Bullish Engulfing" , "Hammer" or "Valley" in other words,
NO entry signal when the price comes to the zone BUT after any of the reversal patterns is formed in the zone.
To learn more about "Entry signal" and the special version of our "Price Action" strategy FOLLOW our lessons:
Take Profits:
TP1= @ 0.00000495
TP2= @ 0.00000564
TP3= @ 0.00000633
TP4= @ 0.00000731
TP5= @ 0.00000856
TP6= @ 0.00001113
TP7= Free

Pundi X Tries To Move [NPXSBTC](70%)Remember how I keep on mentioning that my trades are clearly marked?
When I share a trade rather than chart analysis, you will see the altcoin pair and profits potential listed on the title, i.e. (NPXSBTC)(70%).
Quick analysis for Pundi X vs Bitcoin
Increasing volume.
Breaking above resistance (Moving Averages).
MACD bullish crossover.
Bullish RSI.
Pundi X (NPXSBTC) Trade by Alan Masters
Trade: Pundi X (NPXSBTC)
BUY: 16-17
TARGET:
(1) 19
(2) 22
(3) 24
(4) 26
(5) 29
STOP-LOSS: Close daily below 15.
Note: This is not financial advice.
ABUNDANCE COMES WITH THE RAIN
Each time you see the rain, when you see it come from far away.
Always remain open to its blessings, the rain brings with it lots of prosperity, and some information it wants to share.
The rain comes after the sun, after the need for growth has evolved.
So when you see the rain pouring, you know abundance is about to come.
Namaste.


Daily Bullish Signal $NPXS #NPXS #NPXSBTC (25 March 2019)RED ARROW indicates the EXPECTED Time and Targets
Level Stoploss point up to maximize profit and reduce risk
I'm working all the time, even in Bearish Market

NPXS DROP BEFORE MOONNEXT 3 MONTHS SUPPOSE TO BE DISTRIBUTING THE REST OF THE TOKENS, THIS WILL DILUTE THE COINS IN WHICH WILL DROP THE PRICE, I DONT SEE THE DEMAND FOR THE TOKEN COMING IN THAT FAST FOR OVER 100 BILLION COINS COMING INTO CIRCULATION, ISNT GONNA HAPPEN, AFTER THE DROPS ARE FINISHED THERE WILL BE NO MORE ADDED COINS AVAILABLE TO PUT INTO CIRCULATION. WITH THAT SAID, THE POINT OF SALE DEVICE WILL ULTIMATELY SPREAD OUT AND MORE BUSINESSES USING IT WILL CAUSE MORE USERS IN RETURN MORE TRANSACTION FEES WILL OCCUR, ALL FEES ARE AUTOMATICALLY BURNED FOREVER WHICH WILL SLOWLY DECREASE THE SUPPLY AND MORE USE CASE WILL INCREASE DEMAND CAUSING PRICE TO RISE. LONG STORY SHORT...... WAIT WILL LAST AIRDROP TO BUY NPXS. SEE YOU ON THE MOON!!!!!

There is a possibility for the beginning of an uptrend in NPXETHTechnical analysis:
. PUNDIX/ETHEREUM is in a range bound and the beginning of uptrend is expected.
. The price is below the 21-Day WEMA which acts as a dynamic resistance.
. The RSI is at 43.
. While the RSI downtrend and the price downtrend in the daily chart are not broken, bearish wave in price would continue.
Trading suggestion:
. There is a possibility of temporary retracement to suggested support zone (0.00000450 to 0.00000409). if so, traders can set orders based on Price Action and expect to reach short-term targets.
Beginning of entry zone (0.00000450)
Ending of entry zone (0.00000409)
Entry signal:
Signal to enter the market occurs when the price comes to " Buy zone " then forms one of the reversal patterns, whether " Bullish Engulfing ", " Hammer " or " Valley " in other words,
NO entry signal when the price comes to the zone BUT after any of the reversal patterns is formed in the zone.
To learn more about " Entry signal " and the special version of our " Price Action " strategy FOLLOW our lessons:
Take Profits:
TP1= @ 0.00000494
TP2= @ 0.00000564
TP3= @ 0.00000633
TP4= @ 0.00000731
TP5= @ 0.00000856
TP6= @ 0.00001113
TP7= Free

Pundi-NPXS consolidation about to end.picture is clearer against eth. clear support, great risk reward.

NPXS HAS POSSIBLE INVERSE HEAD N SHOULDERS PATTERN GOING FOR ITPundi X, although undervalued in this market, similar thing can be mentioned about few other cryptocurrencies. Since it entered during largely bear market, we haven't had a chance to see what's it capable of. Payment system they are working on may provide us with some insight on where we will move in next few month, but in short term, besides massive accumulation we've seen, PundiX is also in possible Inverse Head N Shoulders pattern.

There is a trading opportunity to buy in NPXETHTechnical analysis:
. PUNDIX/ETHEREUM is in a range bound and the beginning of uptrend is expected.
. The price is below the 21-Day WEMA which acts as a dynamic resistance.
. The RSI is at 47.
. While the RSI downtrend and the price downtrend in the daily chart are not broken, bearish wave in price would continue.
Trading suggestion:
. There is a possibility of temporary retracement to suggested support zone (0.00000454 to 0.00000374). if so, traders can set orders based on Price Action and expect to reach short-term targets.
Beginning of entry zone (0.00000454)
Ending of entry zone (0.00000374)
Entry signal:
Signal to enter the market occurs when the price comes to " Buy zone " then forms one of the reversal patterns, whether " Bullish Engulfing ", " Hammer " or " Valley " in other words,
NO entry signal when the price comes to the zone BUT after any of the reversal patterns is formed in the zone.
To learn more about " Entry signal " and the special version of our " Price Action " strategy FOLLOW our lessons:
Take Profits:
TP1= @ 0.00000564
TP2= @ 0.00000639
TP3= @ 0.00000703
TP4= @ 0.00000848
TP5= @ 0.00001113
TP6= @ 0.00001293
TP7= Free


PUNDIX GETTING ON MY NERVES #NPXSIf $npxs doesn't move within a week , then i will officially declare it a stable coin.
This coin has literary checked all my patience.
In terms on TA its holding strong on the support, i am expecting some major moves soon. Just don't ask when
i'll really appreciate if you would leave a like.
Dont forget to follow to get notified for further trade opportunities.

Pundi buy zones
This chart is not an easy one to read because of small unit value. Moving averages and cycles theory are here to help.
Trading range between 16 and 20. Right now moving down to 16-17 support. Current cycle went all in sidemoving so the next one should bring some action.
Plan A: buy the dip at 15-16 with stop loss at 14. Targets 19 - 21 - 24
Plan B: if it falls down, buy at 11, sell at 15 - 16 (losses on SL from plan A will be fully covered)

NPXS smaller inverse head and shouldersI recently added the TI sequential indicator to my indicators list. As you can see there is a clear stop and reverse point in the chart. I believe that on the completion of the inverse head and shoulders the likely target should be at 45%
