The 3-Method Framework: Simplifying Technical AnalysisMost traders get caught up in complex indicator setups, thinking that more tools equal better results. We rely on moving averages to tell us if prices are trending up or down, and we depend on support and resistance levels to predict market movement. But what if I told you there's a simpler, more powerful way to read the market using pure price action?
Today, I want to share my experience and understanding of bias and expectations for the next candle formation. This approach is refreshingly simple because we don't need to understand every single price movement - we just need to focus on what matters most.
Method 1: Opening Price Comparison
The first method is beautifully straightforward. For a bullish bias, the current opening price should be above the previous opening price. That's it. Sounds almost too simple, right? But simplicity often holds the greatest power in trading.
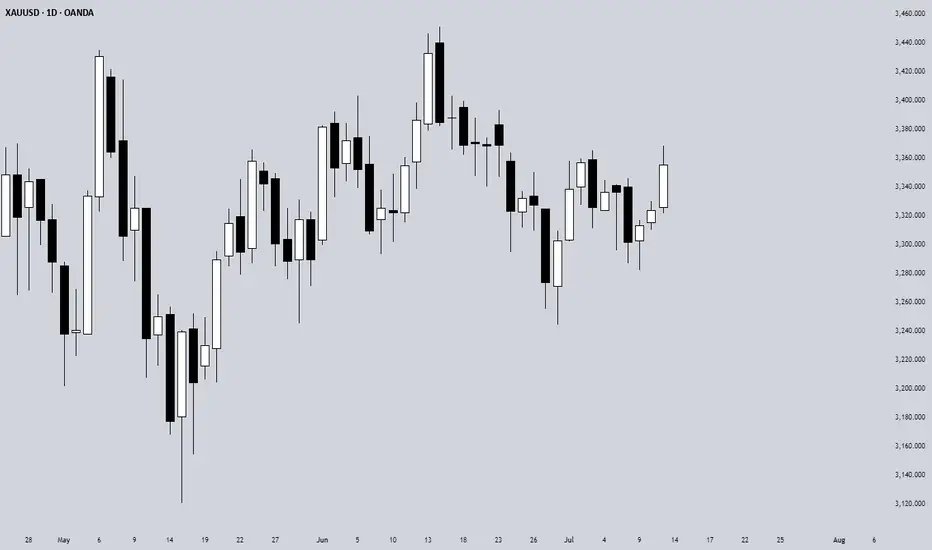
For Gold yesterday, we simply needed to compare the latest opening price on the Daily timeframe with the previous opening price. It's that simple.
Method 2: Mid-Level Analysis
The second approach involves comparing mid-levels between candles. We compare the mid-level of the previous candle with the mid-level of the candle before that. I know it might sound a bit complicated when explained this way, but once you visualize it on your chart, the concept becomes crystal clear.
Still on Gold, we just compare the 50% or mid-level of the previous candle with the candle two periods back from the latest candle on the daily chart.
Method 3: Expansion Expectations
The third method helps us anticipate expansion in price. Traditional complex methods require analyzing numerous factors, but this simplified approach only needs two candles before the current one. Here's how it works: we use the high and low of the candle two periods back, and the open and close (body) of the previous candle. If the previous candle's body sits within the high-low range of the two-candle-back formation, we can expect price expansion.
The beauty of this method is that we don't care whether the price is bullish or bearish - we simply expect expansion to occur. Think of it like a compressed spring: when price gets squeezed within a previous range, it often seeks to break out in either direction. We're not predicting the direction, just the likelihood of significant movement.
Still on Gold, I randomly selected all inside candles on the Daily timeframe. Remember, the purpose is only to expect expansion, not direction. If you want to use this for directional bias, make sure you apply the additional analysis required.
Remember, there are no guarantees in trading, but this method provides valuable insight into potential market expansion.
Advanced Combinations for Enhanced Analysis
Combining Methods 1 and 2 creates our most accessible approach since you only need two candles. When both the opening price and mid-point from two candles ago indicate bullish conditions, we can expect the current candle to follow an OLHC bullish pattern.
You can see the 3 examples I've provided in the image, and all of these are applicable across all timeframes, both daily and 4-hour.
Combining all three methods offers a more sophisticated analysis, particularly useful for anticipating market reversals. This involves marking the current and previous opening prices, comparing mid-levels from the last two candles, and identifying the high/low range from two to three candles back.
Now I'm adding Inside Candles from 2-3 periods back (My personal rule is maximum 3 candles before the current candle, or this analysis will lead to analysis paralysis).
The Bullish and Bearish Rules
Bullish Rule 1:
Opening price above the previous opening price
Mid-level of the previous candle above the mid-level of the previous candle before that.
Inside candle formation (optional)
Bearish Rule 1:
Opening price below the previous opening price
Mid-level of the previous candle below the mid-level of the previous candle before that.
Inside candle formation (optional)
The Secret Sauce: Timeframe Harmony
Here's where the "devil is in the details" comes into play. You might find perfect bullish conditions on your chart, but the market still reverses. The secret lies in using this method on Daily and 4-hour timeframes simultaneously.
Simply understand it from the chart.
Simply understand it from the chart.
If Rule 1 conditions are met on the daily chart, they must also align on the 4-hour chart. When the 4-hour contradicts the daily, follow the 4-hour signal as it might indicate a "sell on strength" or "buy on weakness" scenario.
The formula is simple: must align with
I've never tested this on 1-hour charts because the Daily and 4-hour combination provides sufficient accuracy for my trading approach.
Enhanced Rules for Precision
Rule 2 makes the inside candle formation mandatory rather than optional. Sometimes you'll encounter mixed signals where the mid-level suggests one direction while the opening price suggests another. The solution? Drop down to a lower timeframe for additional confirmation.
I don't recommend using this method below the 4-hour timeframe, but you can certainly apply it to Monthly or Weekly charts for long-term bias determination. The key is analyzing both Daily AND 4-hour timeframes together, not just one or the other.
When timeframes conflict, often just one key level provides the confirmation you need - typically a previous Monthly or Weekly high or low.
Final Thoughts
Pure price action mastery isn't about having the most sophisticated setup or the most indicators on your chart. It's about understanding the fundamental relationship between opening prices, mid-levels, and candle formations across meaningful timeframes.
This approach has served me well because it cuts through market noise and focuses on what price is actually telling us. Start with these three methods, practice identifying the patterns, and gradually build your confidence in reading pure price action.
Remember, consistent profitability comes from mastering simple, reliable methods rather than chasing complex strategies. Keep practicing, stay disciplined, and let price action guide your trading decisions.
Good Luck! :)
Purepriceaction
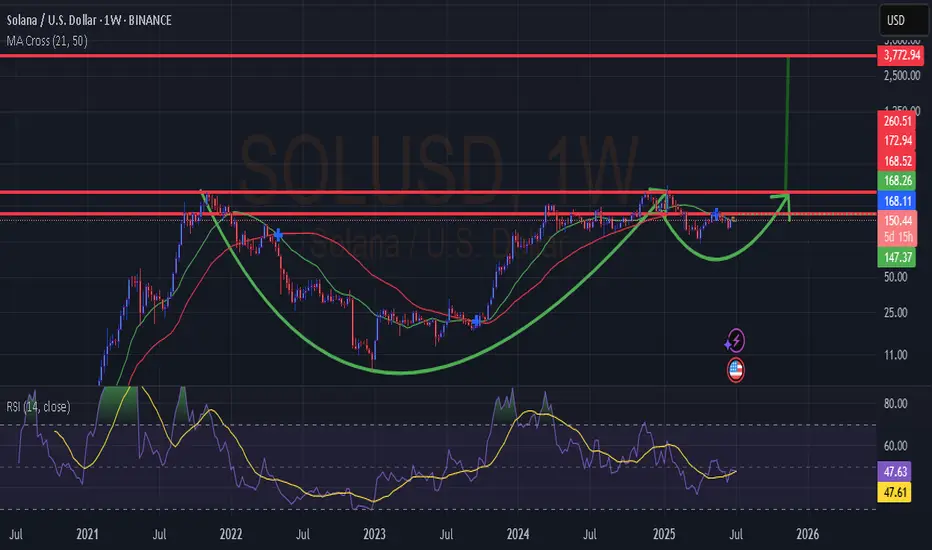
SULUSD Cup & HandleHi All, SOLUSD in a textbook cup & handle pattern. It might break sooner than indicated. Current price is a steal imo. Keep an eye for a strong breakout. Not financial advice. If you enjoyed the content of this analysis, please do leave a like for future updates. Lets crush this market. Be safe.
EURUSD - SHORT PREDICTION - MONDAY, 26TH MAY 2025A pullback appears to be underway, following a sweep of inducement around the 15-minute level at 1.13900—marking our first significant Change of Character (CHoCH). This shift aligns with the broader narrative from the 1-hour timeframe, suggesting the potential for a deeper retracement into the extreme 1H order block.
With the current price trading around 1.13777, we anticipate a move back up to the 1.14078 level. This area is of interest for initiating short positions, in line with the ongoing correction.
Our first take-profit target is set at 1.13368, where we expect an initial reaction. Should bearish momentum continue, we foresee price extending lower to sweep the previous daily low at 1.12771 and potentially tapping into the daily external order block at 1.12664.
From there, we’ll closely monitor price behavior. If bullish intent begins to form, we’ll assess the potential for long setups targeting a move back toward the weekly high at 1.14190.

Identify when Price begins Behaving in 'Certain' waysIf you watch it long enough, you will start to see little nuisances in price that tip you off on what may likely occur. It can switch from day to day, so you have to be willing and able to switch up some biases you may have from the previous day. This is why I love price action so much. It can give great clues!
Hope you enjoy.

Yemi_Fx1 | BEARISH SETUP ON AUDJPY Maintaining a sell bias on AUDJPY based on the presence of a well-defined sell structure.
On the 1-hour timeframe (1HTF) shows the bearish bias is further supported by a potential continuation pattern in the form of an ascending wedge, with price currently testing resistance.
Be aware that today's high-impact Non-Farm Payroll (NFP) data release could cause price to break out of the ascending wedge resistance before moving in it main direction.
I anticipate a potential third touch of the ascending wedge's resistance. If price rejects this level, we can look for a confirmation shorting signal(A flag )on a lower timeframe (e.g., 15-minute chart) to enter the trade.
If you found this helpful please support your fellow trader with a like .

GBPJPY BUYA clear bullish momentum because GBPJPY price retest on the most recent zone which is now a support zone and confirmation of a change of direction as price touched a trendline on the daily.
expect buys as soon as markets opens.
#Thctrading

SELL ON NAS100 showing signs of bears taking over. first from the break of structure & the correction; now we should see a continuation to the downside. PRICE ACTION; we should see this trade come to fruition.

Beautiful SELL setup for NY sessionlooking to close out the month strong with this possible SELL setup. the chart describes my idea for NY session trade. with patience, this trade should play out beautiful

Taking another entry on GOLDYou can see from my first idea that we're trading XAUUSD. I made my first entry at 2001 & currently in a lot of profit. My initial entry I placed a 10 lot & this entry is much less via a 3 lot, just to protect my profits I foreseen that around this area would've been a good entry & so far it's looking promising. Usually I wouldn't advise trading outside of session (I usually only trade gold in London or NY but sometimes GOLD has good volume in Asia). With all the signs of price action & using this fib, I have good confidence in my second entry. I will take this trade all the down to my 1970 & then down to my extension at 1955. Please always take partials & place your stop loss in profit after doing so. You can follow me on this journey of finally sharing my knowledge & wisdom of trading.. You guys will see a lot more, currently curating a free group & course. Stay posted!!

all went right as we discussed..ya it's true that the stock market is not predictable and we are not predicting it at all. all we are doing is helping ourselves to make decisions on how/when to react. we don't have control over markets but yes we do have control over ourselves and we are leveraging it. the stock market is all about timing folks.

pure price action and nothing else..just relaxed traders if the market stays in the prior day's range just chill and sell otm money options and wait for them to become 0 at the end,
remember folks you don't have to trade daily to make money in the stock market.
best of luck to the expiry traders.

Overall Range Meanwhile Daily Bullish Monthly: Overall Ranging , Most recent two candles show that buyers are in control
Weekly: Overall Bearish, Price is Currently Retracing and may find resistance at current level.
Daily SETUP : Overall Bullish, Price has broken resistance, creating a CHOCH Confluence #1 , Found Support @ 38.2% (FIBONACCI) Confluence #2 , Price forms a Bullish Engulfing Pattern Confluence #3
** Price Must continue to Test Trend Line on Daily** Marked
Entry will be on H1: Price must Break LH (1) and Test New Found Support(2) ended with a Bullish Engulfing Candlestick Pattern (3)
Daily Targets Based off where price currently is (Disclaimer: These are TARGETS not Take Profits) **You take profits alone the way.**
A. 0.69384
B. 0.71175

now this make sense to trade..all you all know I only marked levels based on pure price action. we are here not to fight the market but to be with the market and move in the same direction. i will keep my bias neutral and will initiate the trade accordingly.

EURCHF SHORT MULTI-TF ANALYSISHello TradingView community and my followers, please if you like the ideas, don't forget to support them with likes and comments, thank you very much and here we go.
.
EURCHF
Multi-timeframe analysis
Daily view (structural timeframe) : It has taken resistance from resistance on daily.
4 hour (behavioural timeframe) : It has given breakdown of "Rising wedge" with strong bearish impulse.
1 hour (entry timeframe) : It has made Ascending triangle.
.
Wait patiently for breakdown of pattern and we could see downside continuation movement.
Thank You !!!!

IBULHSGFIN SHORT (INTRADAY NOV 22)Hello TradingView community and my followers, please if you like the ideas, don't forget to support them with likes and comments, thank you very much and here we go.
.
IBULHSGFIN
Stock has broken Ascending Triangle on daily.
In 15 min it has made Descending triangle.
Now wait for breakout and we could see downside movement.
Thank You !

CROMPTON LONG (INTRADAY NOV 22)Hello TradingView community and my followers, please if you like the ideas, don't forget to support them with likes and comments, thank you very much and here we go.
.
CROMPTON
Stock has broken higher low on daily and reversed.
In 15 min it has made falling wedge pattern.
Now wait for breakout and we could see upside movement after it retest the breakout level.
Thank You !

ACC LONG (INTRADY NOV 22)Hello TradingView community and my followers, please if you like the ideas, don't forget to support them with likes and comments, thank you very much and here we go.
.
ACC
Stock is in uptrend on daily and
in 15 min it is making descending triangle.
Wait for breakout and then we can see upside movement after retest.
Thank You !

USDCAD LONG MULTI-TF ANALYSISHello TradingView community and my followers, please if you like the ideas, don't forget to support them with likes and comments, thank you very much and here we go.
.
USDCAD
Multi-timeframe analysis
Daily view (structural timeframe) : Multiple wick rejections on daily.
4 hour (behavioural timeframe) : It has made triple bottom and break of structure on 4 hour.
1 hour (entry timeframe) : It is now respecting a Trendline.
.
we could see upside continuation movement if trendline breaks and candle close.
Thank You !!!!

AUDUSD SHORT MULTI-TF ANALYSISo
Hello TradingView community and my followers, please if you like the ideas, don't forget to support them with likes and comments, thank you very much and here we go.
.
AUDUSD
Multi-timeframe analysis
Daily view (structural timeframe) : It has Reversed from daily resistance zone.
4 hour (behavioral timeframe) : It has failed to make new higher high and has broken the structure to downside.
1 hour (entry timeframe) : It is now respecting a Trendline.
.
we could see downside continuation movement if this trendline breaks below and candle closes.
Thank You !!!!

AMBUJACEM SHORT (INTRADAY NOV 18)Hello TradingView community and my followers, please if you like the ideas, don't forget to support them with likes and comments, thank you very much and here we go.
.
AMBUJACEM
It has broken the neck of triple top on bigger timeframe and
in 15 min it has also broken "Ascending Triangle".
So now wait for "ABC correction" in 5 min candle and on "Breakout of trendline" we could see downside movement.
Thank you !

NAM_INDIA SHORT (INTRADAY NOV 15)Hello TradingView community and my followers, please if you like the ideas, don't forget to support them with likes and comments, thank you very much and here we go.
.
NAM_INDIA has given "Break Of Structure" on daily and in 15 min it is at "Daily Resistance Area" and it is making "Descending triangle". On Breakout we could see downside continuation movement. Thank You !

when all is well, its time to sellyes, we may witness a trending day today because the range banknifty closes on Friday was pretty tight. the cpr is also gonna be not very wide. added to these we have some gaps as well which the market may fill today. overall market sentiments are not that bad, the best way to yourself in the game is to maintain your RRR. remember one thing folks. in stock market
WHEN ALL IS WELL
ITS TIME TO SELL.
Best of luck traders.

NZDCHF SHORT MULTI-TF ANALYSISHello TradingView community and my followers, please if you like the ideas, don't forget to support them with likes and comments, thank you very much and here we go.
.
NZDCHF
Multi-timeframe analysis
Daily view (structural timeframe) : Took resistance from "Daily Resistance zone".
4 hour (behavioural timeframe) : It has given "Breakdown Of Trendline" with huge bearish impulse.
1 hour (entry timeframe) : Now it is forming "Ascending Triangle".
.
Now we could see downside continuation movement on 1 hour breakdown. Wait patiently.
Thank You !!!!1
